| Param | Original file | Final file |
|---|---|---|
| Filename | modeM0/AS1A09_061T01_9000005330_37533cztM0_level2.evt | modeM0/AS1A09_061T01_9000005330_37533cztM0_level2_quad_clean.evt |
| Size (bytes) | 2,910,545,280 | 313,729,920 |
| Size | 2.7 GB | 299.2 MB |
| Events in quadrant A | 15,908,010 | 1,987,179 |
| Events in quadrant B | 16,306,628 | 1,999,858 |
| Events in quadrant C | 15,521,299 | 1,967,988 |
| Events in quadrant D | 38,491,857 | 1,583,807 |
| Mode SS | |||
|---|---|---|---|
| Quadrant | BADHDUFLAG | Total packets | Discarded packets |
| A | 0 | 582 | 0 |
| B | 0 | 582 | 0 |
| C | 0 | 582 | 0 |
| D | 0 | 582 | 0 |
| Mode M9 | |||
|---|---|---|---|
| Quadrant | BADHDUFLAG | Total packets | Discarded packets |
| A | 0 | 95 | 0 |
| B | 0 | 95 | 0 |
| C | 0 | 95 | 0 |
| D | 0 | 95 | 0 |
| Mode M0 | |||
|---|---|---|---|
| Quadrant | BADHDUFLAG | Total packets | Discarded packets |
| A | 0 | 64411 | 7 |
| B | 0 | 66182 | 6 |
| C | 0 | 62945 | 6 |
| D | 0 | 133459 | 6 |
| Quadrant | Total seconds | Saturated seconds | Saturation percentage |
|---|---|---|---|
| A | 28530 | 179 | 0.627410% |
| B | 28530 | 612 | 2.145110% |
| C | 28530 | 248 | 0.869260% |
| D | 28530 | 9092 | 31.868209% |
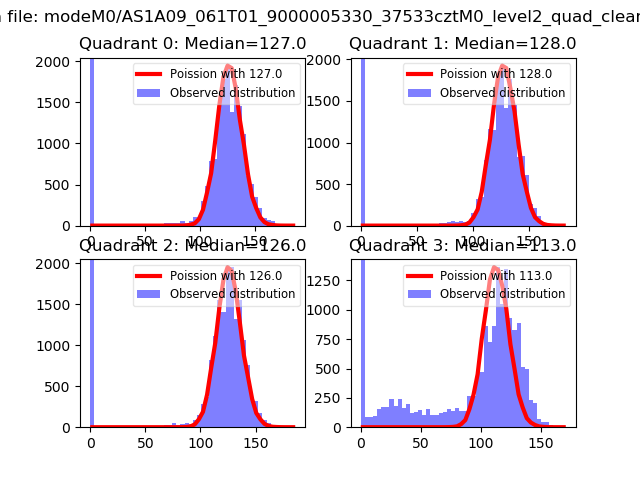
Noise dominated data is calculated using 1-second bins in cleaned event files. If a bin has >2000 counts, and if more than 50% of those come from <1% of pixels, then it is considered to be noise-dominated and hence unusable.
| Quadrant | # 1 sec bins | Bins with >0 counts | Bins with >2000 counts | High rate bins dominated by noise | Noise dominated (total time) | Noise dominated (detector-on time) | Marked lightcurve |
|---|---|---|---|---|---|---|---|
| A | 38023 | 28536 | 124 | 124 | 0.33% | 0.43% | 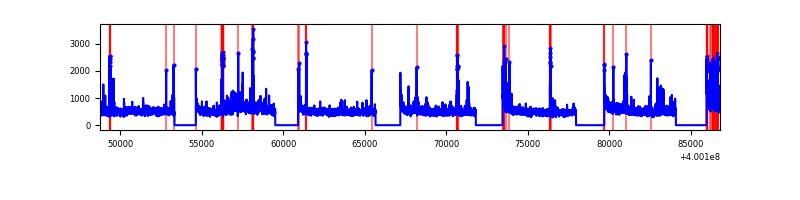 |
| B | 38023 | 28536 | 429 | 429 | 1.13% | 1.50% | 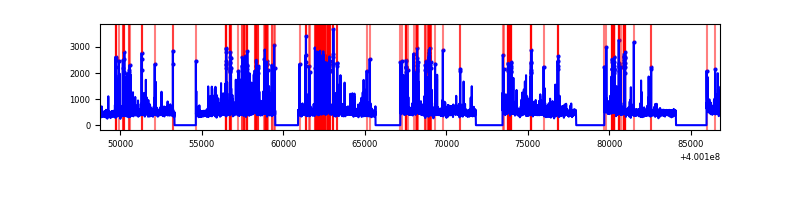 |
| C | 38023 | 28536 | 222 | 222 | 0.58% | 0.78% | 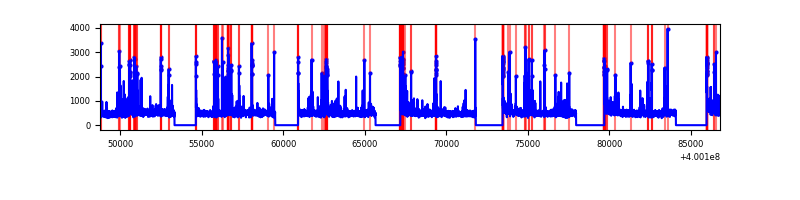 |
| D | 38022 | 28534 | 9026 | 9026 | 23.74% | 31.63% | 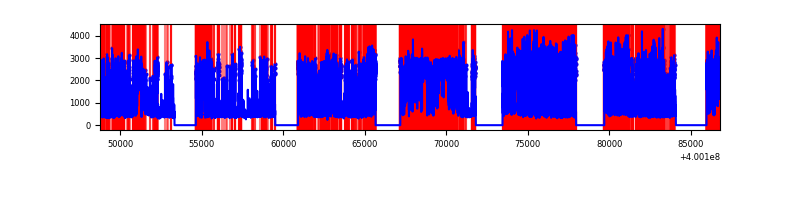 |
Top three noisy pixels from each quadrant. If the there are fewer than three noisy pixels in the level2.evt file, extra rows are filled as -1
| Pixel properties | Quadrant properties | ||||||
|---|---|---|---|---|---|---|---|
| Quadrant | DetID | PixID | Counts | Sigma | Mean | Median | Sigma |
| A | 10 | 83 | 1446996 | 2144.28 | 3317 | 3245 | 673.3 |
| A | 15 | 222 | 828282 | 1225.36 | 3317 | 3245 | 673.3 |
| A | 9 | 143 | 286372 | 420.5 | 3317 | 3245 | 673.3 |
| B | 5 | 172 | 1653265 | 2639.47 | 3299 | 3216 | 625.1 |
| B | 0 | 213 | 416448 | 661.02 | 3299 | 3216 | 625.1 |
| B | 0 | 229 | 353864 | 560.91 | 3299 | 3216 | 625.1 |
| C | 15 | 214 | 1224832 | 1611.37 | 3241 | 3262 | 758.1 |
| C | 14 | 254 | 1194960 | 1571.96 | 3241 | 3262 | 758.1 |
| C | 0 | 10 | 272819 | 355.57 | 3241 | 3262 | 758.1 |
| D | 12 | 227 | 19377579 | 29326.9 | 2691 | 2617 | 660.7 |
| D | 12 | 233 | 3565842 | 5393.47 | 2691 | 2617 | 660.7 |
| D | 2 | 249 | 2466908 | 3730.07 | 2691 | 2617 | 660.7 |
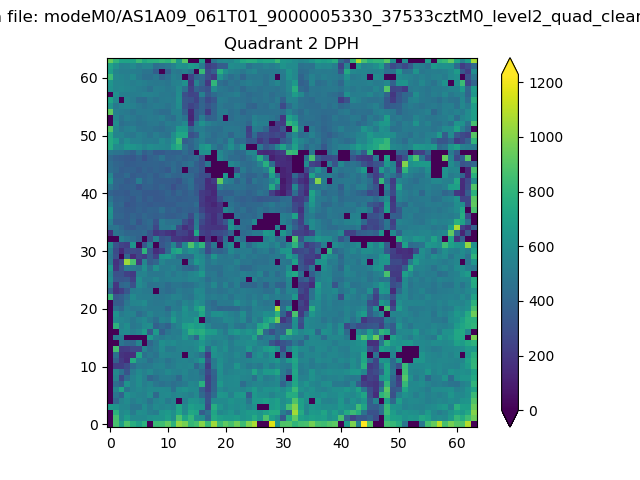
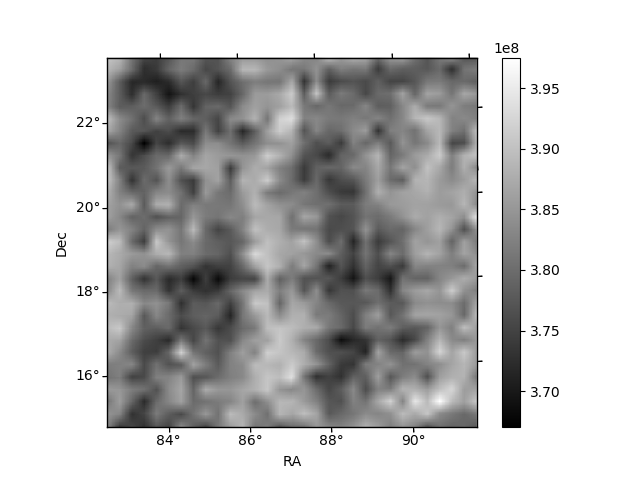
Histogram calculated using DETX and DETY for each event in the final _common_clean file
| Quadrant A | 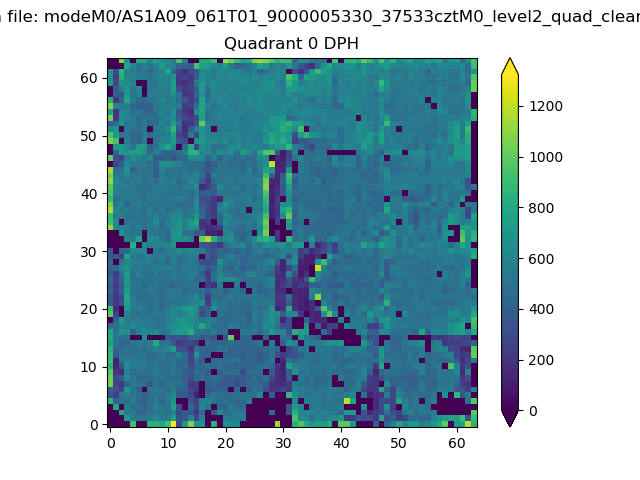 |
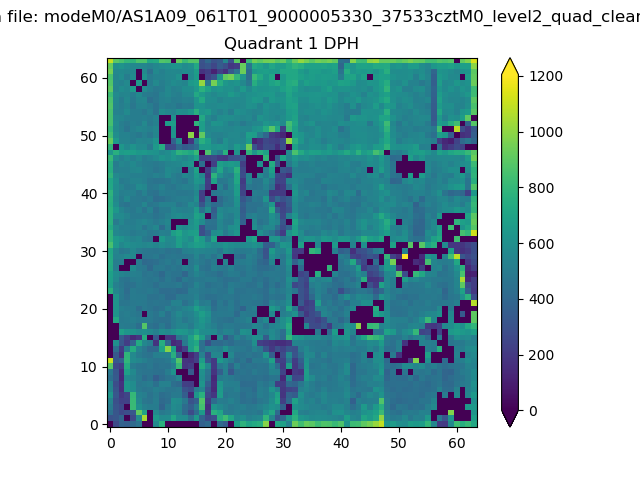 |
Quadrant B |
|---|---|---|---|
| Quadrant D | 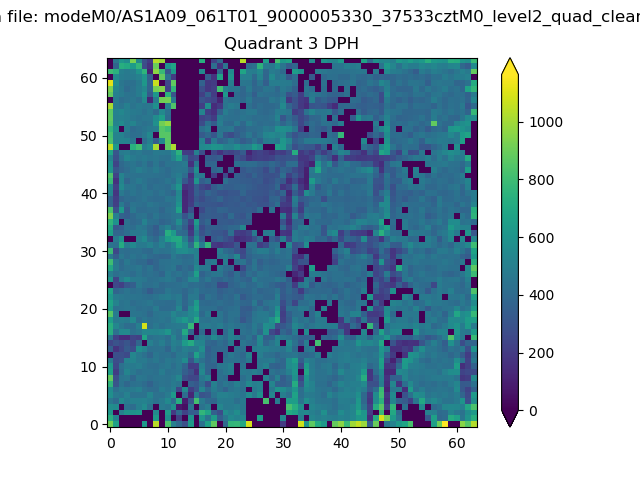 |
 |
Quadrant C |
| Plot type | Count rate plots | Images |
|---|---|---|
| Comparison with Poisson distribution Blue bars denote a histogram of data divided into 1 sec bins. Red curve is a Poisson curve with rate = median count rate of data. |
 |
 |
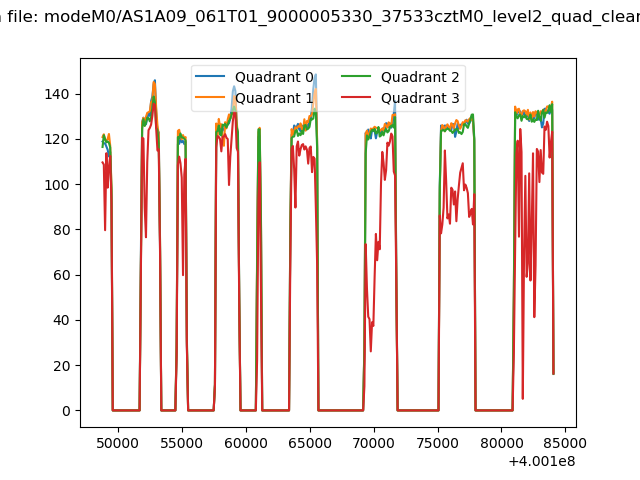
| Quadrant-wise count rates Data is divided into 100 sec bins |
 |
|
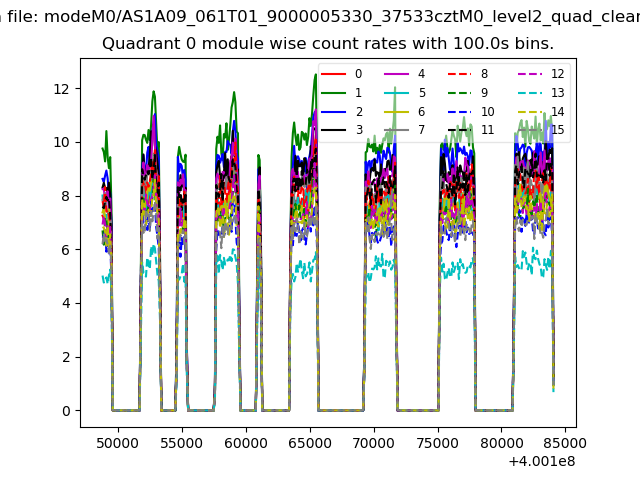
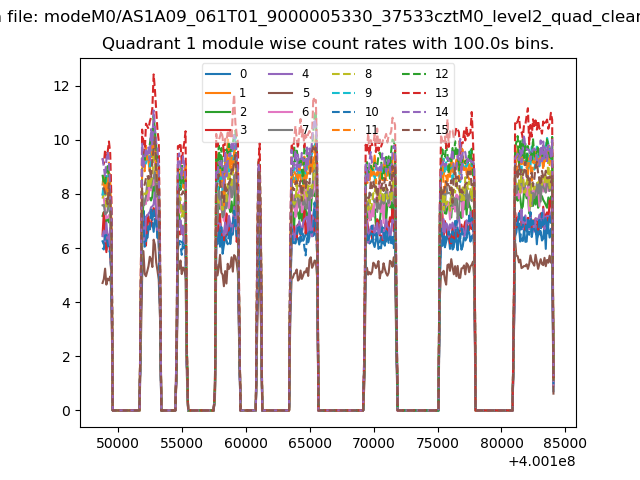
| Module-wise count rates for Quadrant A Data is divided into 100 sec bins |
 |
 |
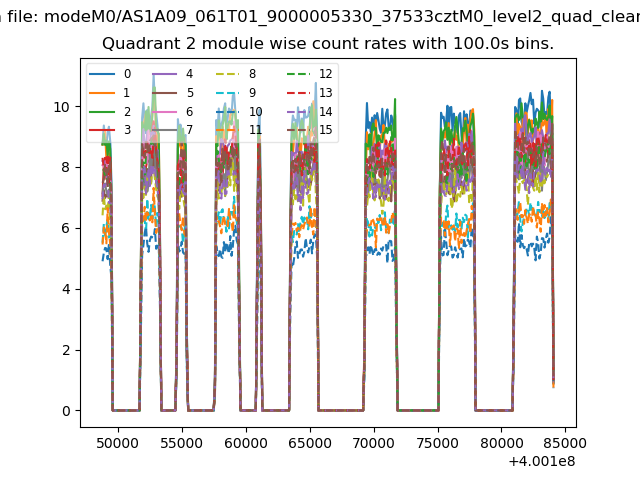
| Module-wise count rates for Quadrant B Data is divided into 100 sec bins |
 |
 |
| Module-wise count rates for Quadrant C Data is divided into 100 sec bins |
 |
 |
| Module-wise count rates for Quadrant D Data is divided into 100 sec bins |
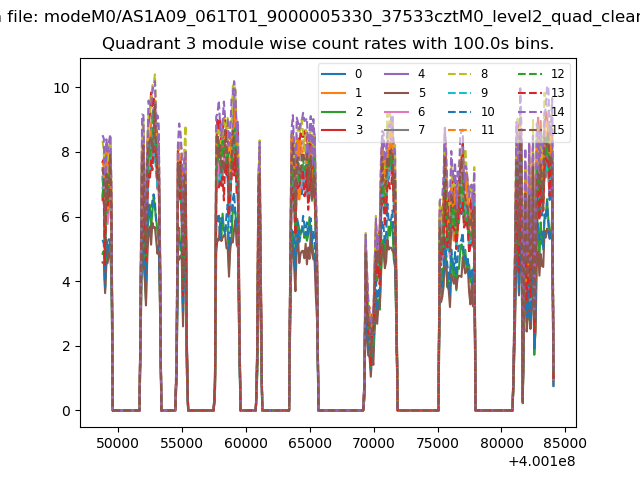 |
 |
| Parameter | Plot |
|---|---|
| CZT HV Monitor | 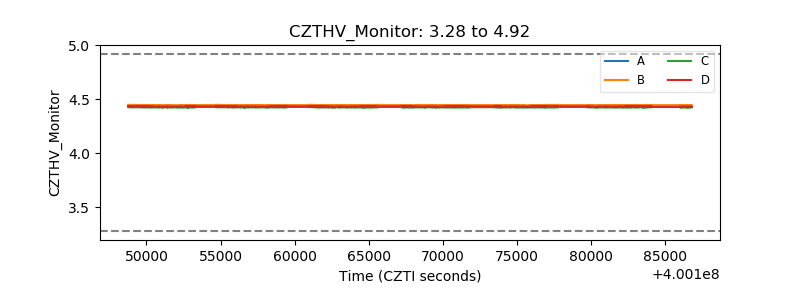 |
| D_VDD | 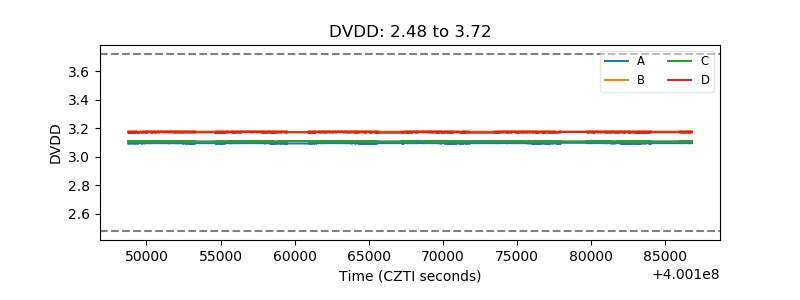 |
| Temperature 1 | 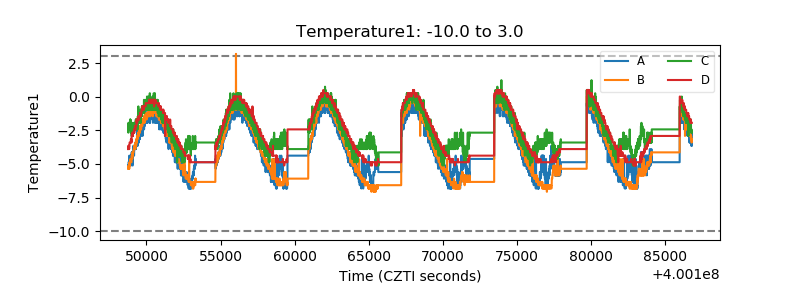 |
| Veto HV Monitor |  |
| Veto LLD | 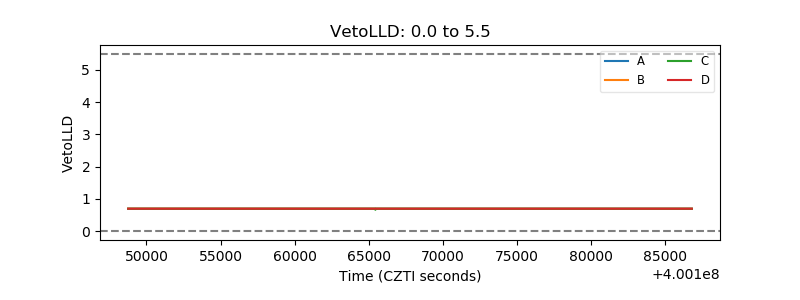 |
| Alpha Counter | 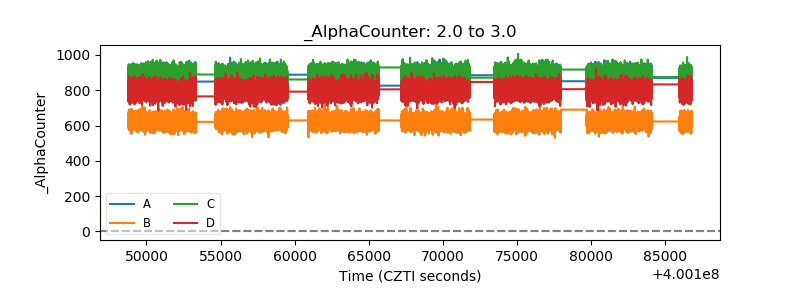 |
| _CPM_Rate | 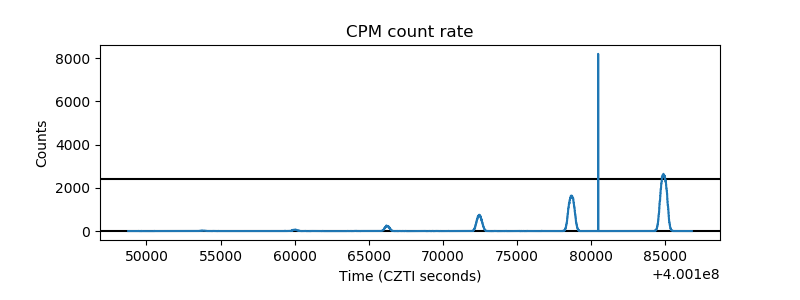 |
| CZT Counter | 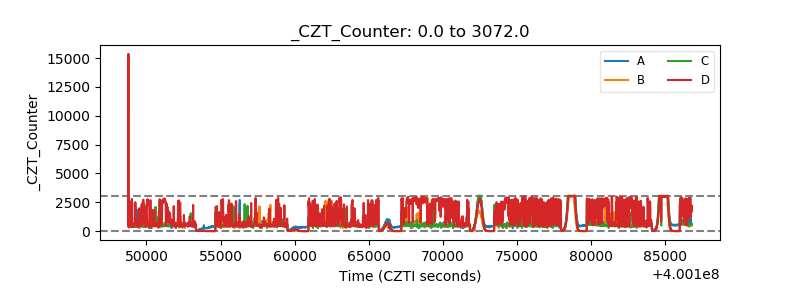 |
| +2.5 Volts monitor | 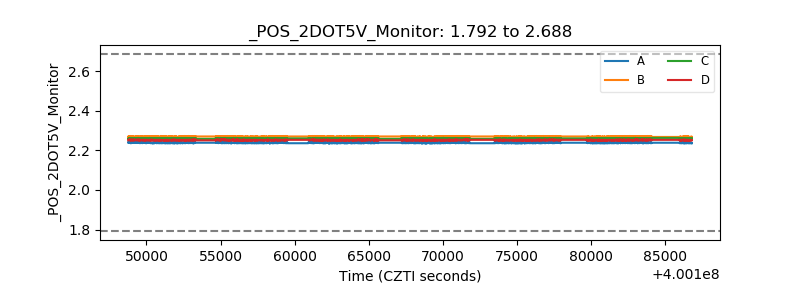 |
| +5 Volts monitor | 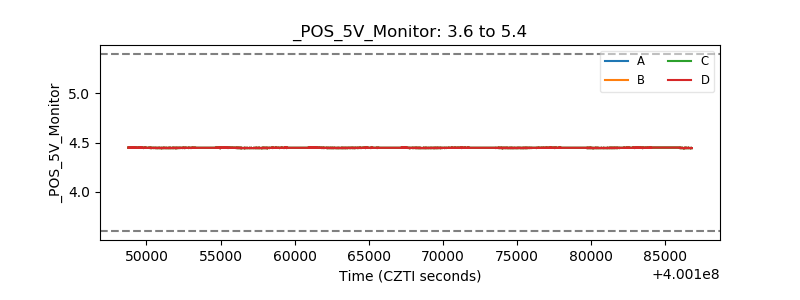 |
| _ROLL_ROT | 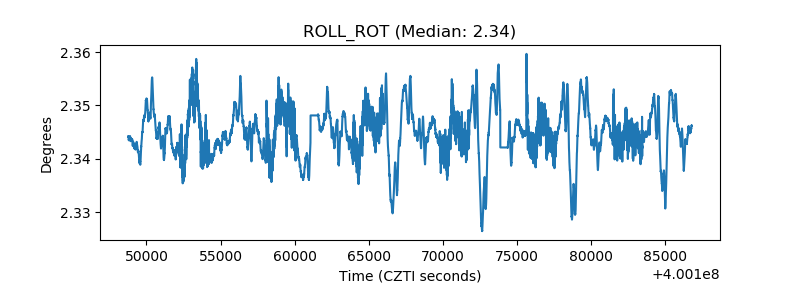 |
| _Roll_DEC | 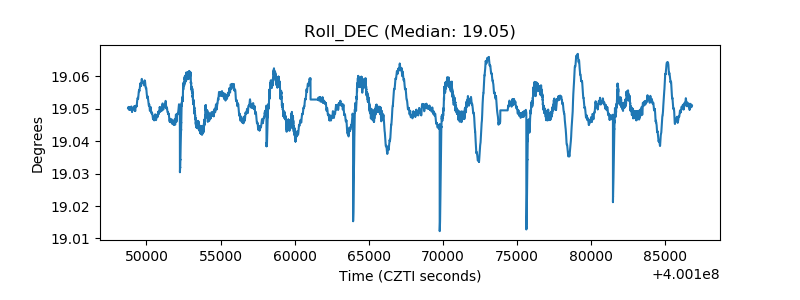 |
| _Roll_RA | 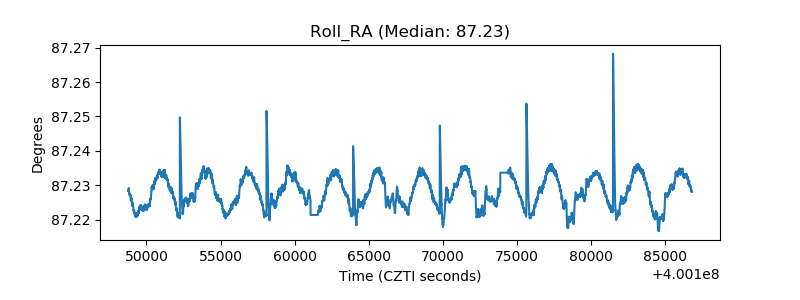 |
| Veto Counter | 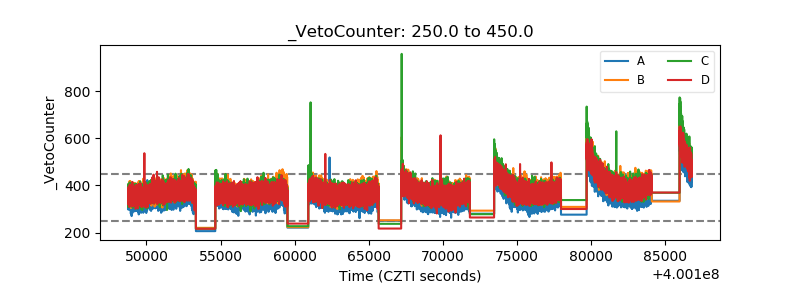 |