| Param | Original file | Final file |
|---|---|---|
| Filename | modeM0/AS1A09_061T01_9000005330_37534cztM0_level2.evt | modeM0/AS1A09_061T01_9000005330_37534cztM0_level2_quad_clean.evt |
| Size (bytes) | 517,760,640 | 77,829,120 |
| Size | 493.8 MB | 74.2 MB |
| Events in quadrant A | 3,529,886 | 510,092 |
| Events in quadrant B | 2,816,283 | 523,981 |
| Events in quadrant C | 3,106,846 | 518,877 |
| Events in quadrant D | 5,880,667 | 445,023 |
| Mode SS | |||
|---|---|---|---|
| Quadrant | BADHDUFLAG | Total packets | Discarded packets |
| A | 0 | 104 | 0 |
| B | 0 | 104 | 0 |
| C | 0 | 104 | 0 |
| D | 0 | 104 | 0 |
| Mode M9 | |||
|---|---|---|---|
| Quadrant | BADHDUFLAG | Total packets | Discarded packets |
| A | 0 | 34 | 0 |
| B | 0 | 34 | 0 |
| C | 0 | 34 | 0 |
| D | 0 | 35 | 0 |
| Mode M0 | |||
|---|---|---|---|
| Quadrant | BADHDUFLAG | Total packets | Discarded packets |
| A | 0 | 13756 | 3 |
| B | 0 | 11607 | 2 |
| C | 0 | 12389 | 2 |
| D | 0 | 20891 | 2 |
| Quadrant | Total seconds | Saturated seconds | Saturation percentage |
|---|---|---|---|
| A | 5119 | 115 | 2.246533% |
| B | 5119 | 27 | 0.527447% |
| C | 5119 | 87 | 1.699551% |
| D | 5119 | 1119 | 21.859738% |
Noise dominated data is calculated using 1-second bins in cleaned event files. If a bin has >2000 counts, and if more than 50% of those come from <1% of pixels, then it is considered to be noise-dominated and hence unusable.
| Quadrant | # 1 sec bins | Bins with >0 counts | Bins with >2000 counts | High rate bins dominated by noise | Noise dominated (total time) | Noise dominated (detector-on time) | Marked lightcurve |
|---|---|---|---|---|---|---|---|
| A | 7122 | 5120 | 90 | 90 | 1.26% | 1.76% | 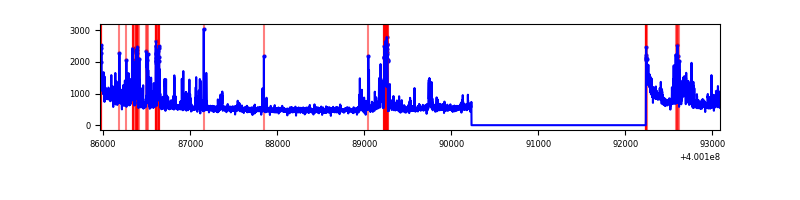 |
| B | 7122 | 5120 | 14 | 14 | 0.20% | 0.27% | 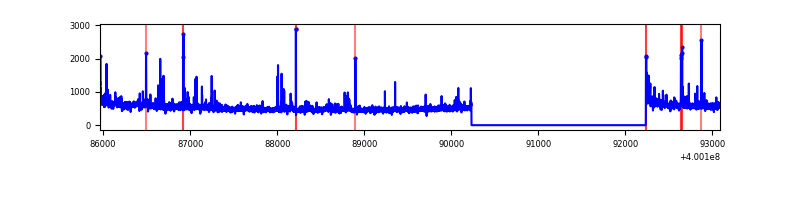 |
| C | 7122 | 5120 | 72 | 72 | 1.01% | 1.41% | 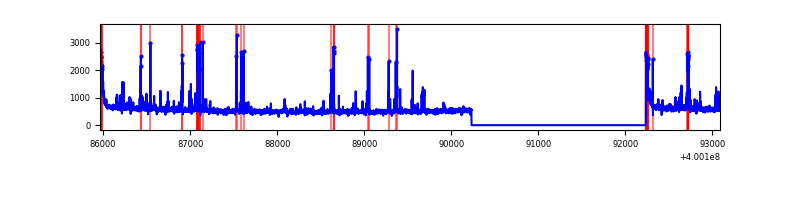 |
| D | 7122 | 5120 | 1111 | 1111 | 15.60% | 21.70% | 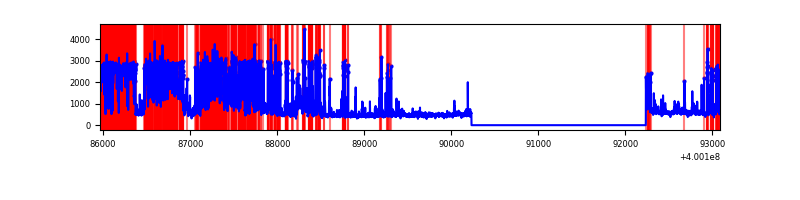 |
Top three noisy pixels from each quadrant. If the there are fewer than three noisy pixels in the level2.evt file, extra rows are filled as -1
| Pixel properties | Quadrant properties | ||||||
|---|---|---|---|---|---|---|---|
| Quadrant | DetID | PixID | Counts | Sigma | Mean | Median | Sigma |
| A | 15 | 222 | 590681 | 4538.65 | 639 | 627 | 130.0 |
| A | 10 | 83 | 320632 | 2461.45 | 639 | 627 | 130.0 |
| A | 9 | 143 | 79844 | 609.33 | 639 | 627 | 130.0 |
| B | 5 | 172 | 62327 | 504.98 | 646 | 631 | 122.2 |
| B | 0 | 219 | 27840 | 222.7 | 646 | 631 | 122.2 |
| B | 0 | 229 | 27352 | 218.71 | 646 | 631 | 122.2 |
| C | 15 | 214 | 221497 | 1496.8 | 633 | 640 | 147.6 |
| C | 14 | 254 | 200028 | 1351.3 | 633 | 640 | 147.6 |
| C | 0 | 10 | 119780 | 807.44 | 633 | 640 | 147.6 |
| D | 12 | 227 | 2830398 | 20924.24 | 552 | 538 | 135.2 |
| D | 2 | 249 | 275112 | 2030.22 | 552 | 538 | 135.2 |
| D | 13 | 249 | 232563 | 1715.61 | 552 | 538 | 135.2 |
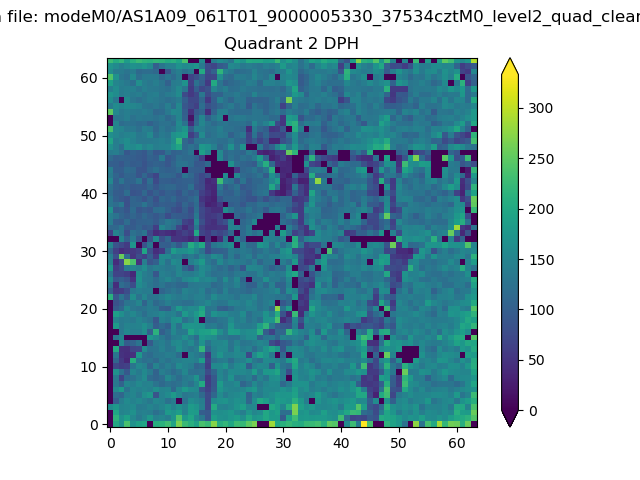
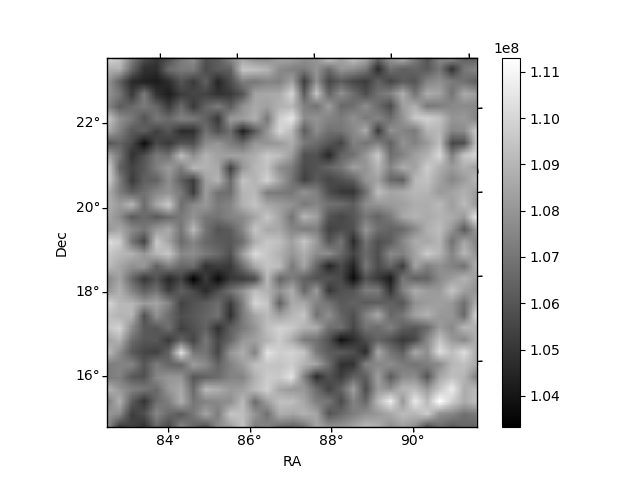
Histogram calculated using DETX and DETY for each event in the final _common_clean file
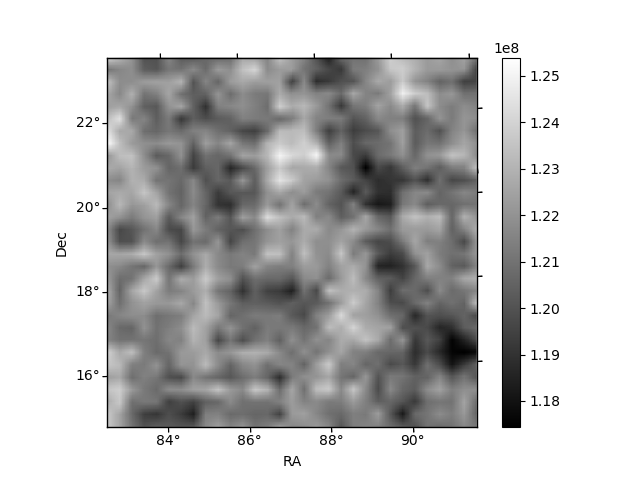
| Quadrant A | 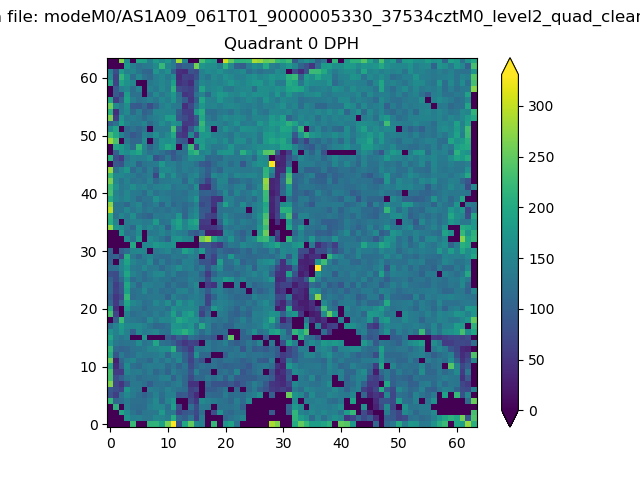 |
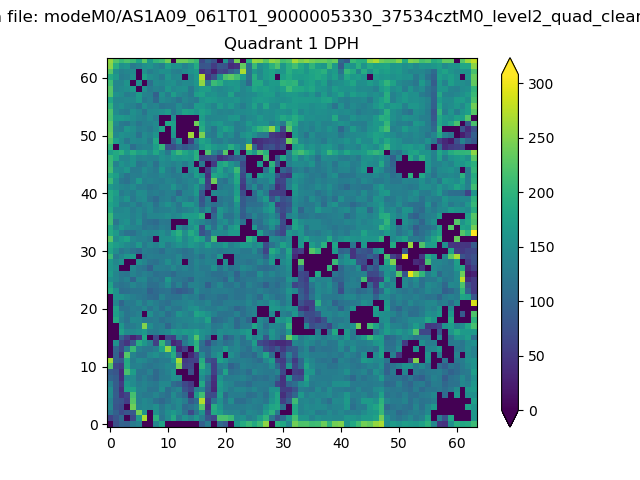 |
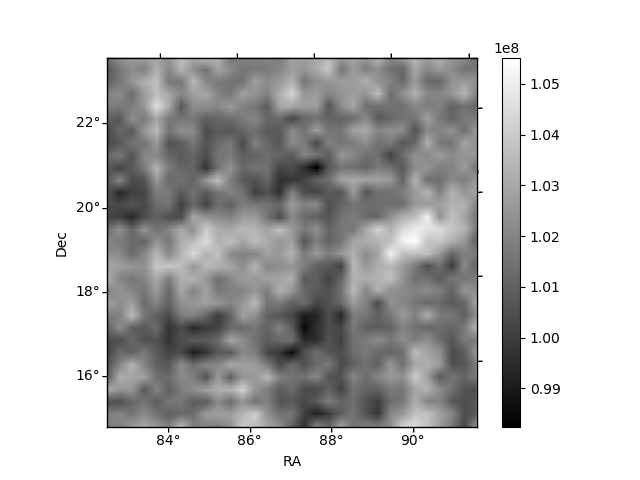
Quadrant B |
|---|---|---|---|
| Quadrant D | 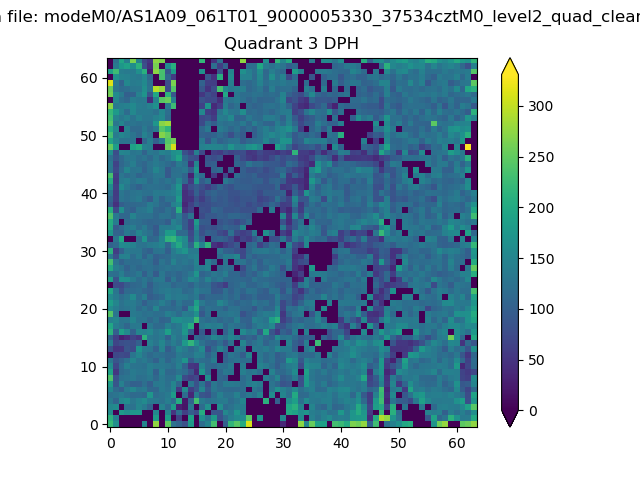 |
 |
Quadrant C |
| Plot type | Count rate plots | Images |
|---|---|---|
| Comparison with Poisson distribution Blue bars denote a histogram of data divided into 1 sec bins. Red curve is a Poisson curve with rate = median count rate of data. |
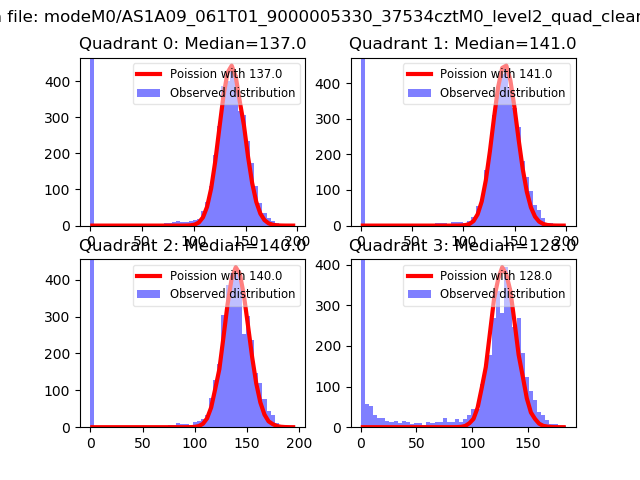 |
 |
| Quadrant-wise count rates Data is divided into 100 sec bins |
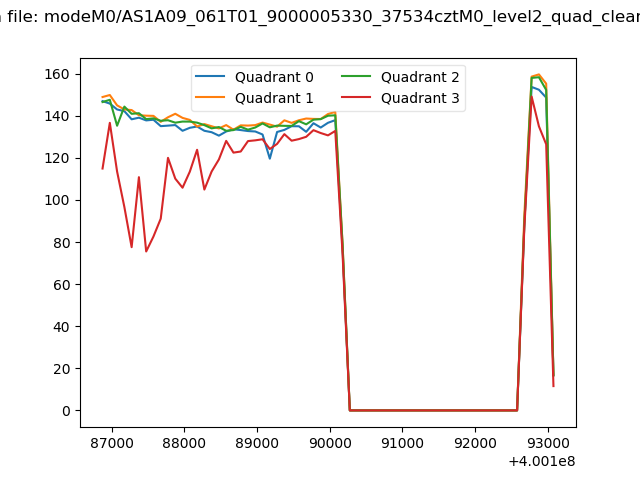 |
|
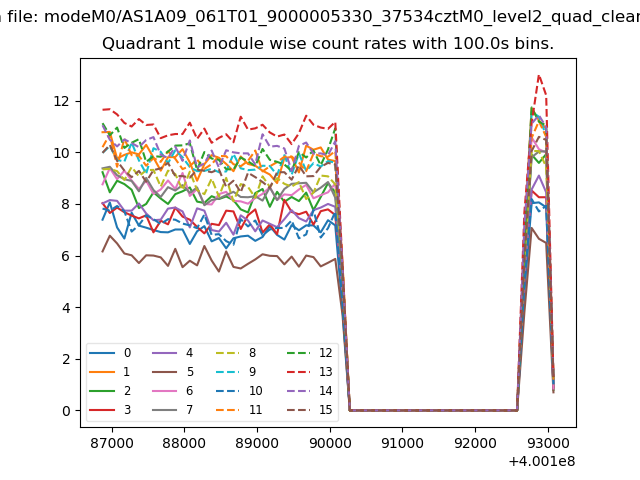
| Module-wise count rates for Quadrant A Data is divided into 100 sec bins |
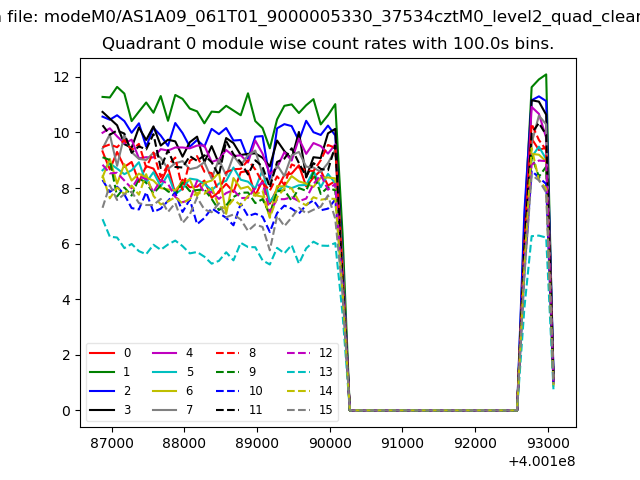 |
 |
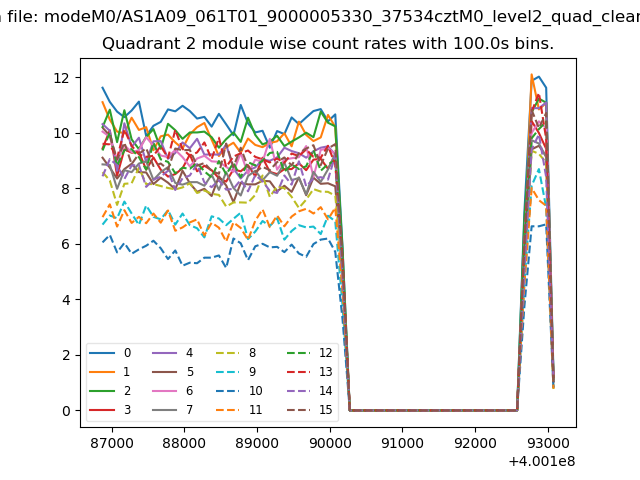
| Module-wise count rates for Quadrant B Data is divided into 100 sec bins |
 |
 |
| Module-wise count rates for Quadrant C Data is divided into 100 sec bins |
 |
 |
| Module-wise count rates for Quadrant D Data is divided into 100 sec bins |
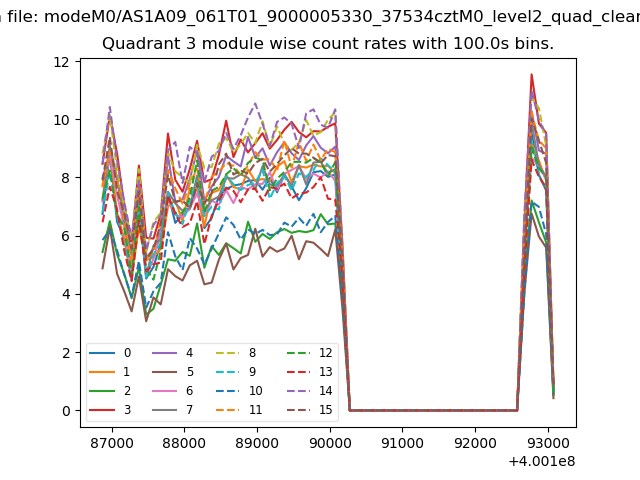 |
 |
| Parameter | Plot |
|---|---|
| CZT HV Monitor | 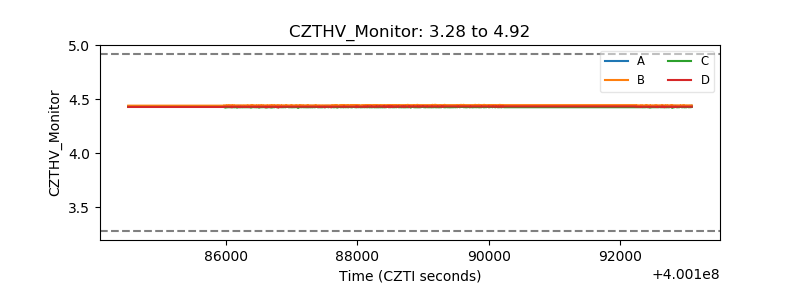 |
| D_VDD | 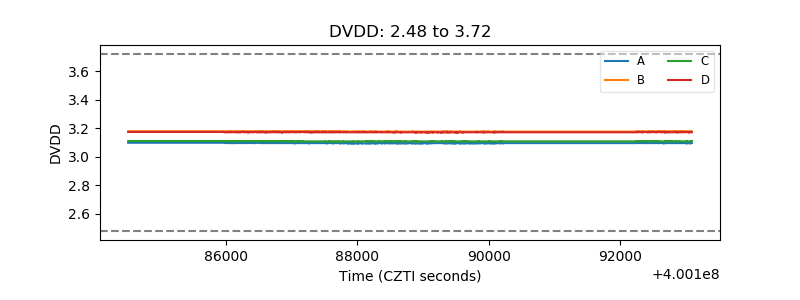 |
| Temperature 1 | 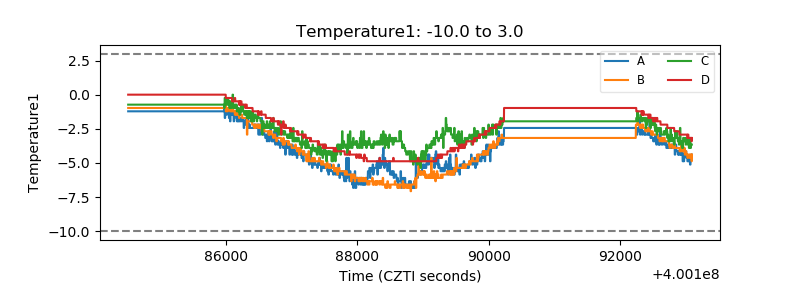 |
| Veto HV Monitor | 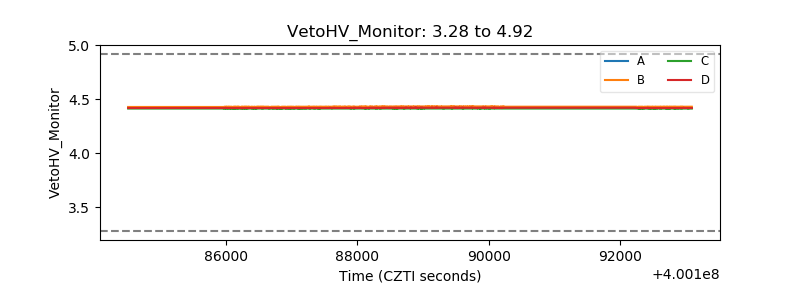 |
| Veto LLD | 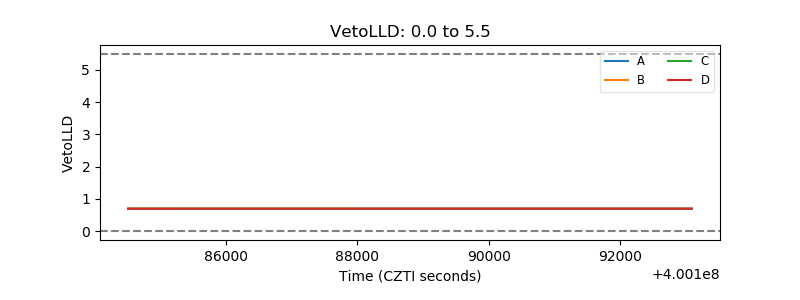 |
| Alpha Counter | 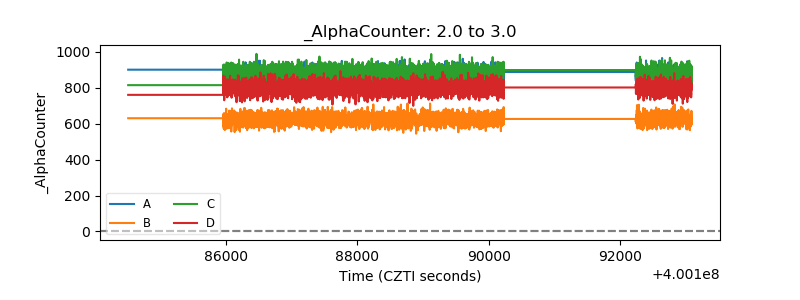 |
| _CPM_Rate | 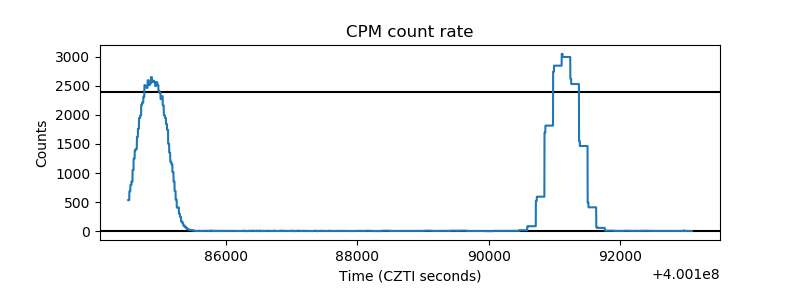 |
| CZT Counter | 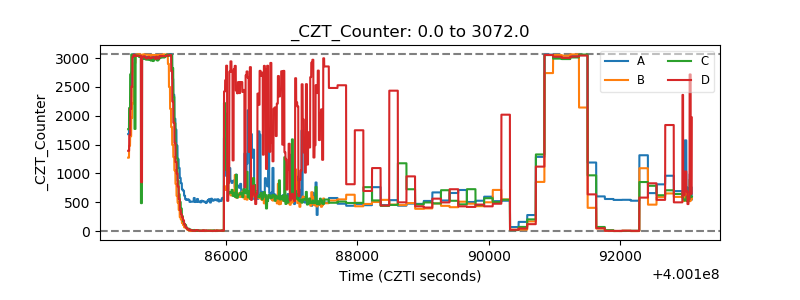 |
| +2.5 Volts monitor | 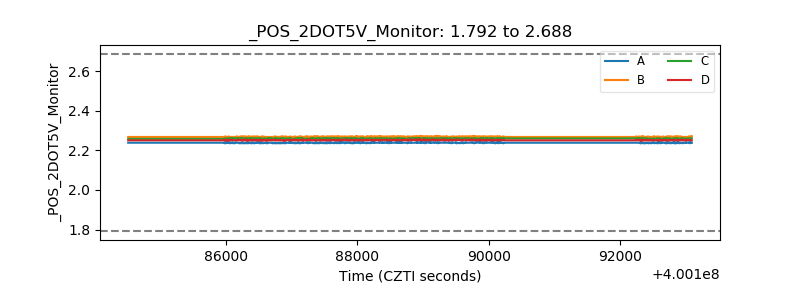 |
| +5 Volts monitor | 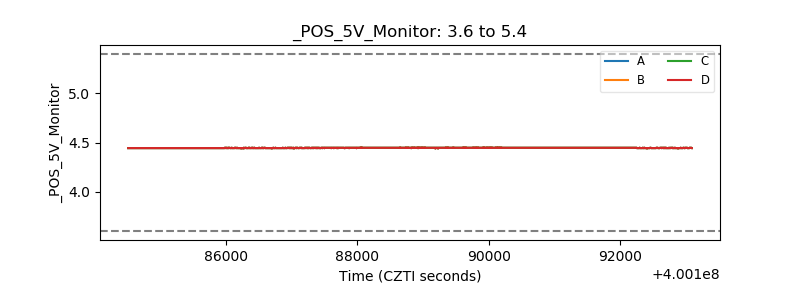 |
| _ROLL_ROT | 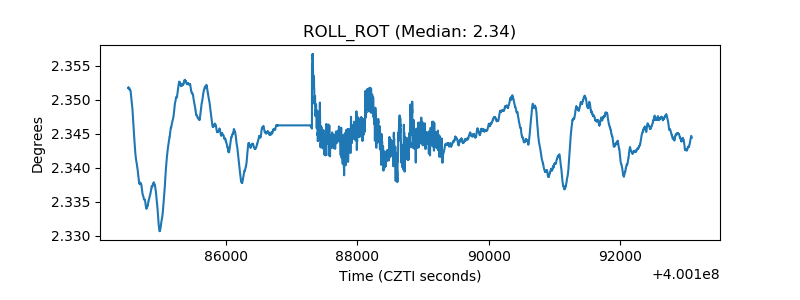 |
| _Roll_DEC | 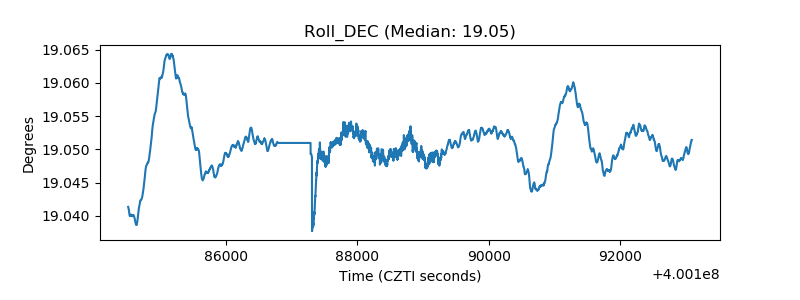 |
| _Roll_RA | 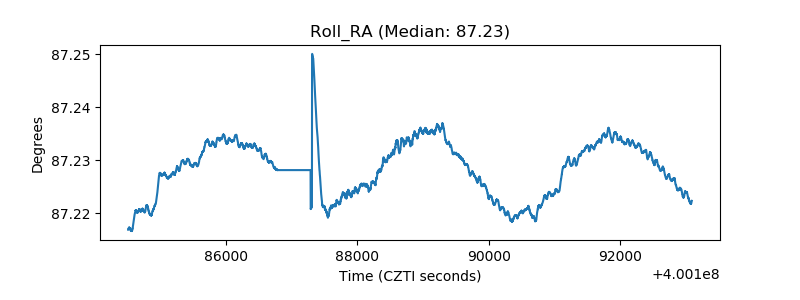 |
| Veto Counter | 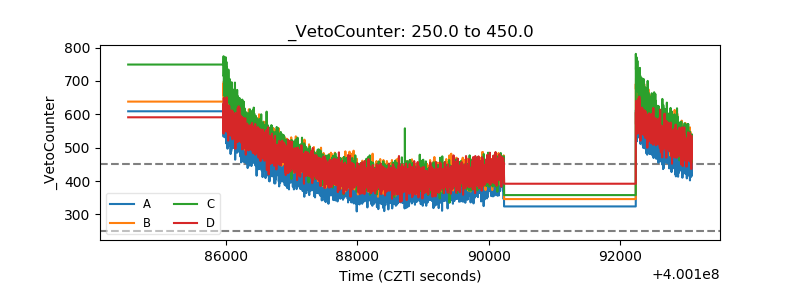 |