| Param | Original file | Final file |
|---|---|---|
| Filename | modeM0/AS1A09_061T01_9000005330_37535cztM0_level2.evt | modeM0/AS1A09_061T01_9000005330_37535cztM0_level2_quad_clean.evt |
| Size (bytes) | 429,554,880 | 90,161,280 |
| Size | 409.7 MB | 86.0 MB |
| Events in quadrant A | 3,621,820 | 593,286 |
| Events in quadrant B | 2,787,498 | 617,303 |
| Events in quadrant C | 2,979,995 | 610,611 |
| Events in quadrant D | 3,286,091 | 564,376 |
| Mode SS | |||
|---|---|---|---|
| Quadrant | BADHDUFLAG | Total packets | Discarded packets |
| A | 0 | 100 | 0 |
| B | 0 | 100 | 0 |
| C | 0 | 100 | 0 |
| D | 0 | 100 | 0 |
| Mode M9 | |||
|---|---|---|---|
| Quadrant | BADHDUFLAG | Total packets | Discarded packets |
| A | 0 | 26 | 0 |
| B | 0 | 26 | 0 |
| C | 0 | 26 | 0 |
| D | 0 | 27 | 0 |
| Mode M0 | |||
|---|---|---|---|
| Quadrant | BADHDUFLAG | Total packets | Discarded packets |
| A | 0 | 13966 | 3 |
| B | 0 | 11413 | 2 |
| C | 0 | 11801 | 2 |
| D | 0 | 13031 | 2 |
| Quadrant | Total seconds | Saturated seconds | Saturation percentage |
|---|---|---|---|
| A | 4917 | 100 | 2.033760% |
| B | 4917 | 47 | 0.955867% |
| C | 4917 | 107 | 2.176124% |
| D | 4917 | 202 | 4.108196% |
Noise dominated data is calculated using 1-second bins in cleaned event files. If a bin has >2000 counts, and if more than 50% of those come from <1% of pixels, then it is considered to be noise-dominated and hence unusable.
| Quadrant | # 1 sec bins | Bins with >0 counts | Bins with >2000 counts | High rate bins dominated by noise | Noise dominated (total time) | Noise dominated (detector-on time) | Marked lightcurve |
|---|---|---|---|---|---|---|---|
| A | 7009 | 4918 | 72 | 72 | 1.03% | 1.46% | 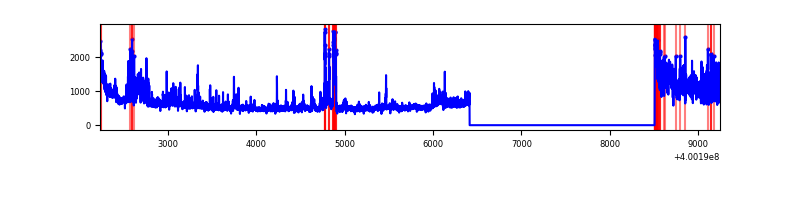 |
| B | 7009 | 4918 | 27 | 27 | 0.39% | 0.55% | 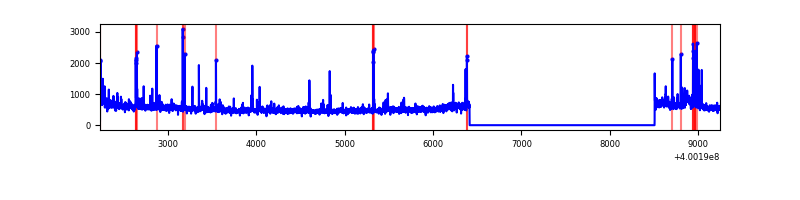 |
| C | 7009 | 4918 | 85 | 85 | 1.21% | 1.73% | 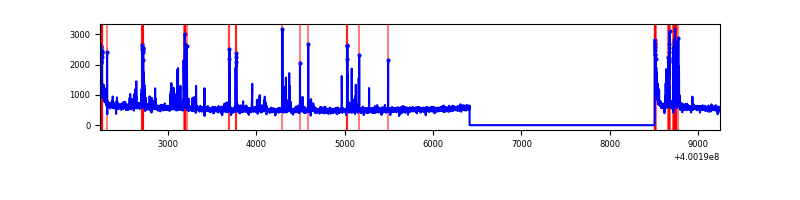 |
| D | 7009 | 4918 | 174 | 174 | 2.48% | 3.54% | 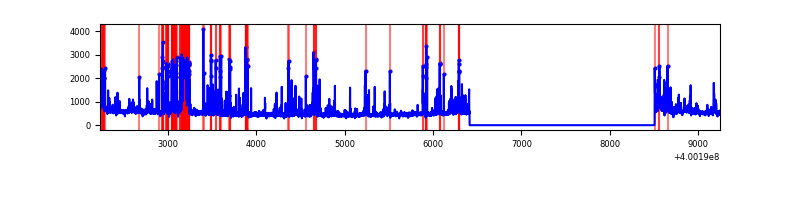 |
Top three noisy pixels from each quadrant. If the there are fewer than three noisy pixels in the level2.evt file, extra rows are filled as -1
| Pixel properties | Quadrant properties | ||||||
|---|---|---|---|---|---|---|---|
| Quadrant | DetID | PixID | Counts | Sigma | Mean | Median | Sigma |
| A | 15 | 222 | 853269 | 6878.71 | 607 | 598 | 124.0 |
| A | 10 | 83 | 292955 | 2358.52 | 607 | 598 | 124.0 |
| A | 9 | 143 | 77703 | 622.03 | 607 | 598 | 124.0 |
| B | 5 | 172 | 79471 | 675.49 | 616 | 601 | 116.8 |
| B | 4 | 141 | 66974 | 568.46 | 616 | 601 | 116.8 |
| B | 0 | 190 | 35990 | 303.09 | 616 | 601 | 116.8 |
| C | 14 | 254 | 296743 | 2080.54 | 604 | 610 | 142.3 |
| C | 15 | 214 | 210075 | 1471.64 | 604 | 610 | 142.3 |
| C | 0 | 10 | 105121 | 734.26 | 604 | 610 | 142.3 |
| D | 2 | 249 | 325534 | 2249.86 | 593 | 577 | 144.4 |
| D | 13 | 249 | 200979 | 1387.5 | 593 | 577 | 144.4 |
| D | 12 | 227 | 174393 | 1203.43 | 593 | 577 | 144.4 |
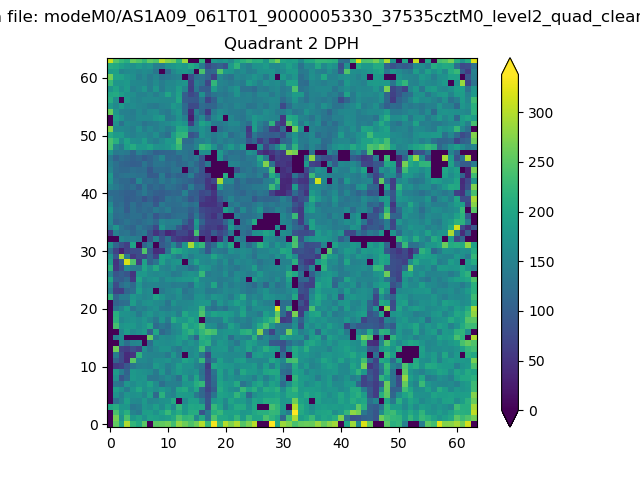
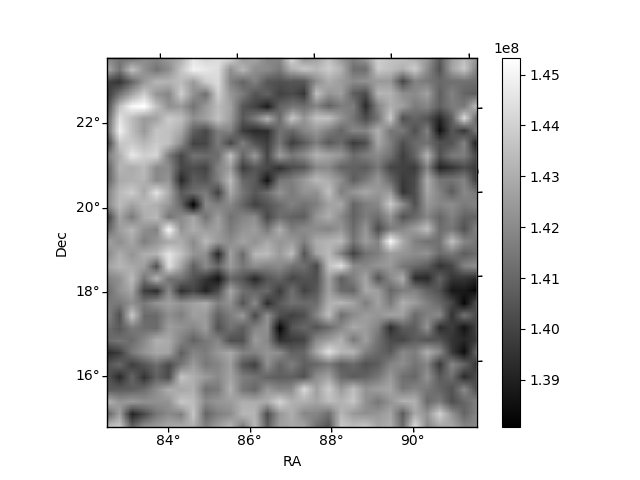
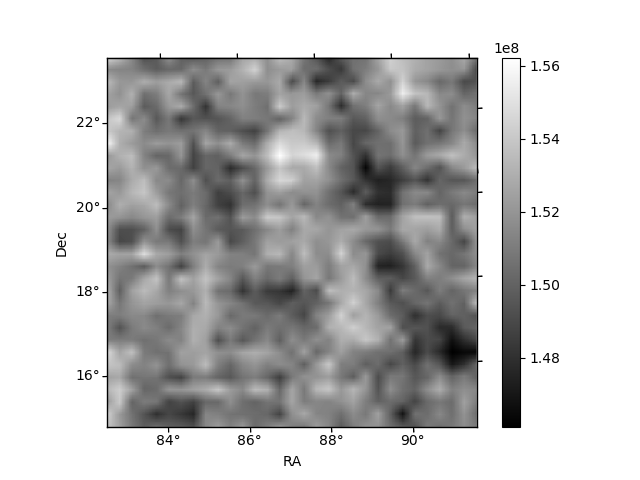
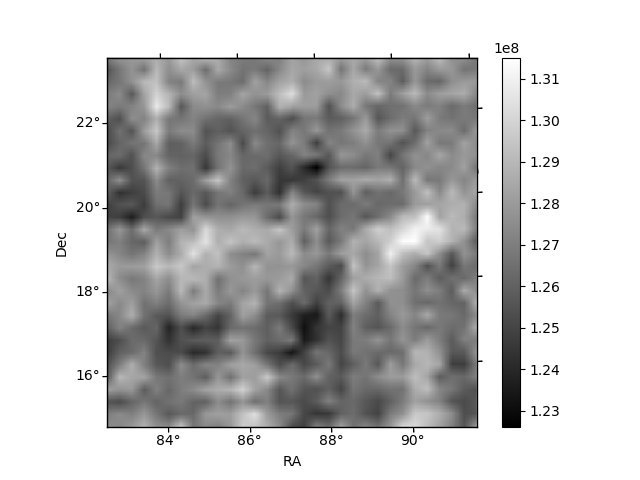
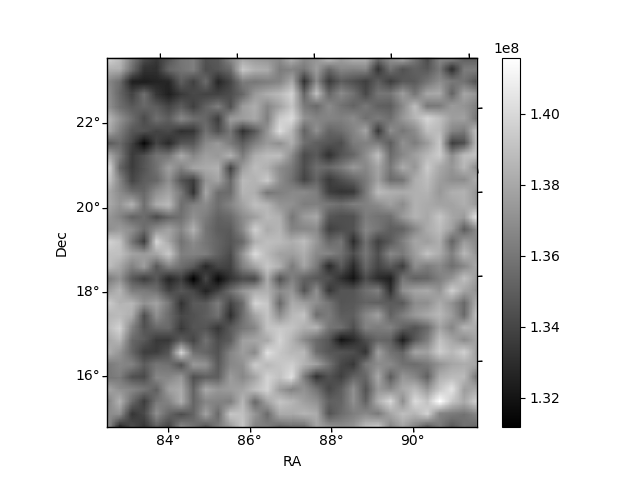
Histogram calculated using DETX and DETY for each event in the final _common_clean file
| Quadrant A | 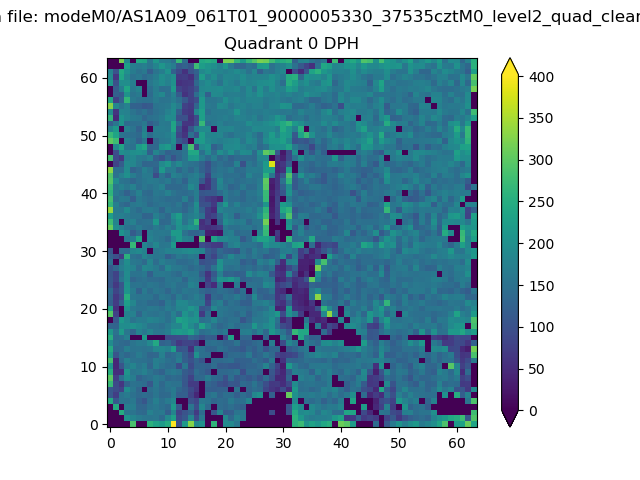 |
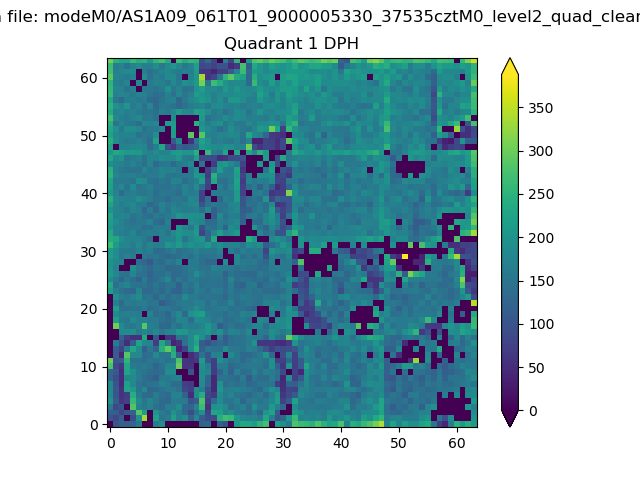 |
Quadrant B |
|---|---|---|---|
| Quadrant D | 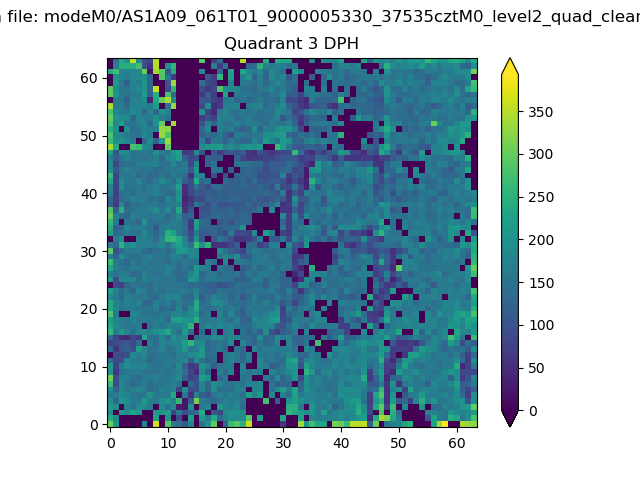 |
 |
Quadrant C |
| Plot type | Count rate plots | Images |
|---|---|---|
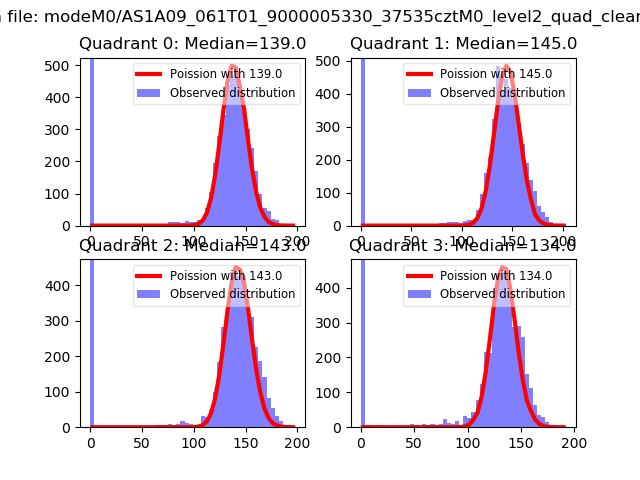
| Comparison with Poisson distribution Blue bars denote a histogram of data divided into 1 sec bins. Red curve is a Poisson curve with rate = median count rate of data. |
 |
 |
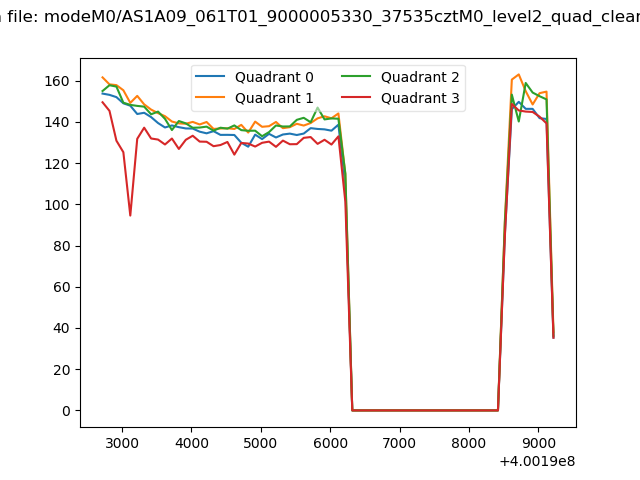
| Quadrant-wise count rates Data is divided into 100 sec bins |
 |
|
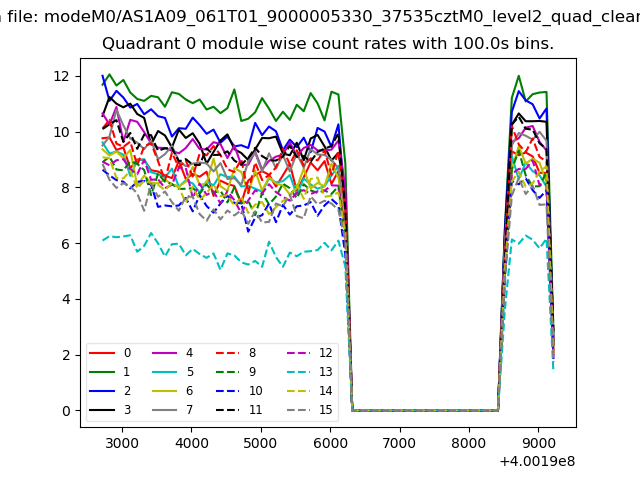
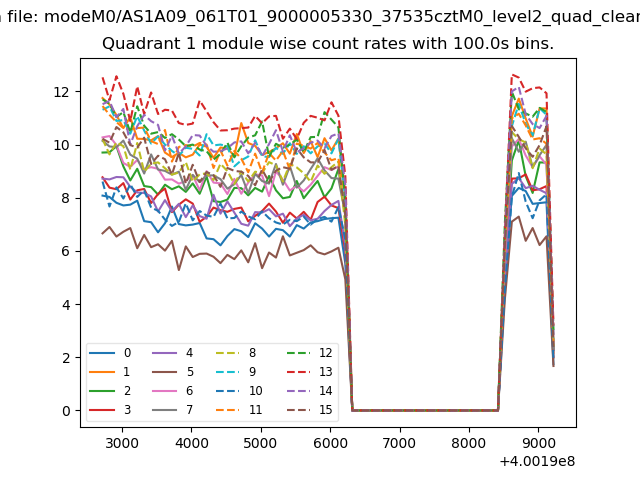
| Module-wise count rates for Quadrant A Data is divided into 100 sec bins |
 |
 |
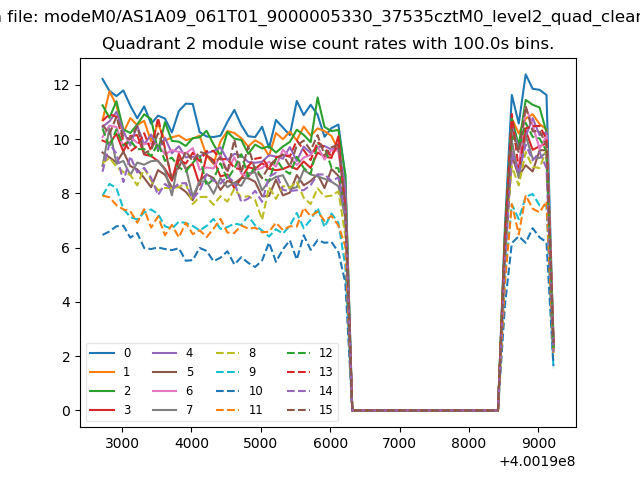
| Module-wise count rates for Quadrant B Data is divided into 100 sec bins |
 |
 |
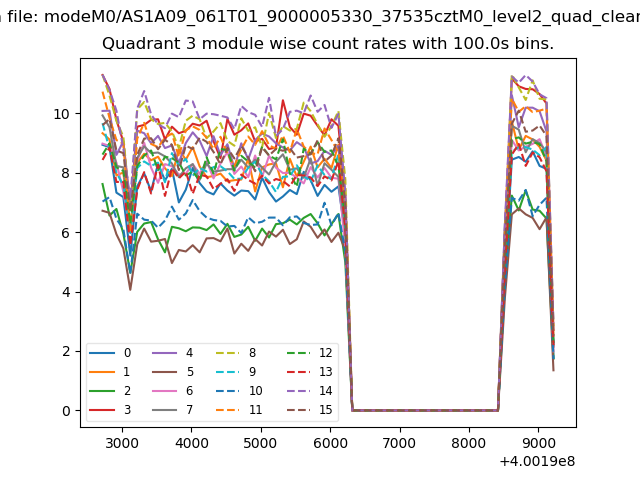
| Module-wise count rates for Quadrant C Data is divided into 100 sec bins |
 |
 |
| Module-wise count rates for Quadrant D Data is divided into 100 sec bins |
 |
 |
| Parameter | Plot |
|---|---|
| CZT HV Monitor | 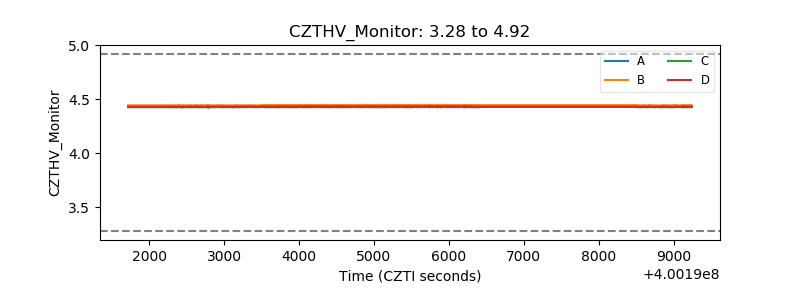 |
| D_VDD | 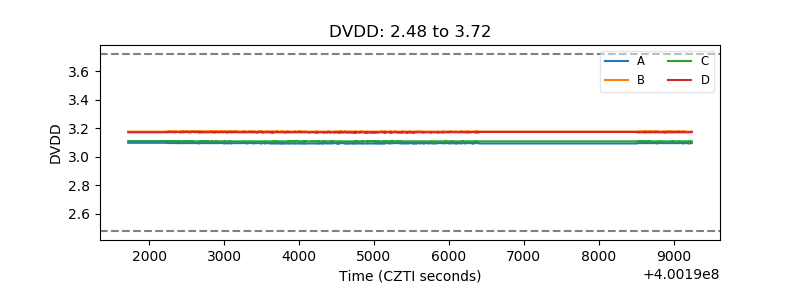 |
| Temperature 1 | 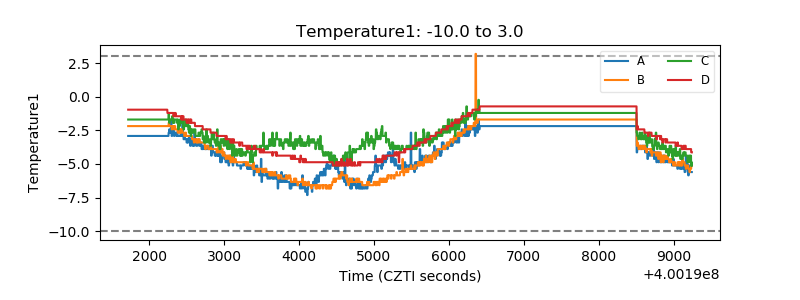 |
| Veto HV Monitor |  |
| Veto LLD | 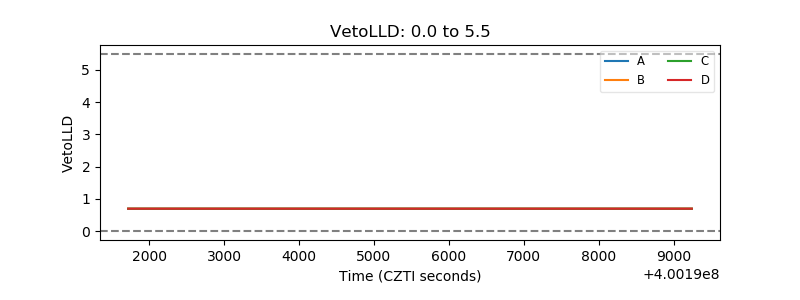 |
| Alpha Counter | 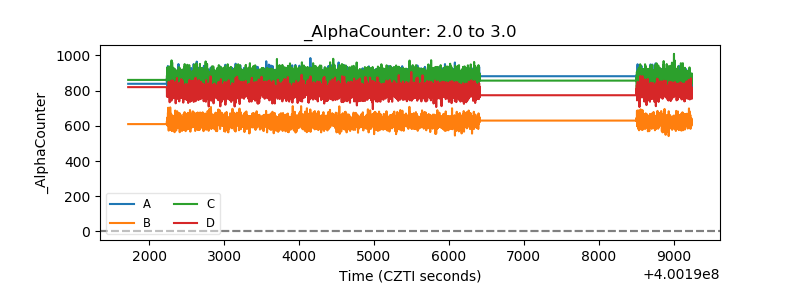 |
| _CPM_Rate | 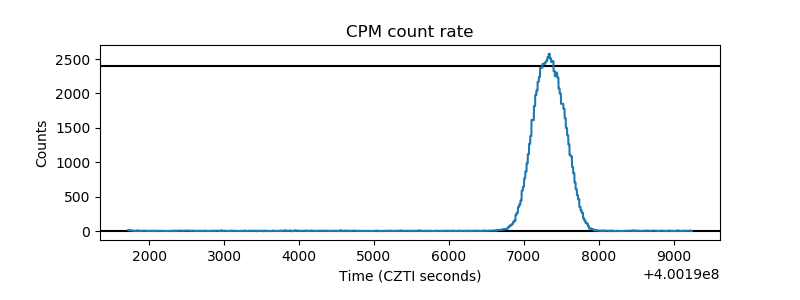 |
| CZT Counter | 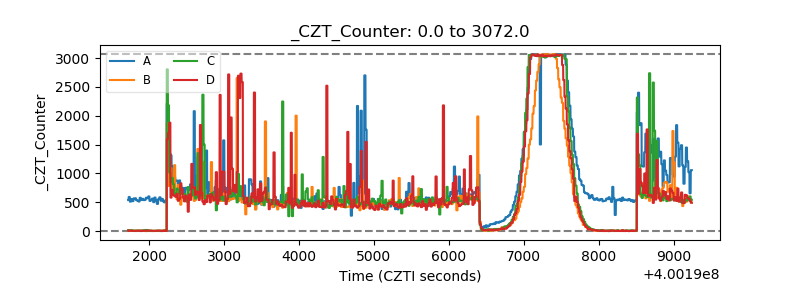 |
| +2.5 Volts monitor | 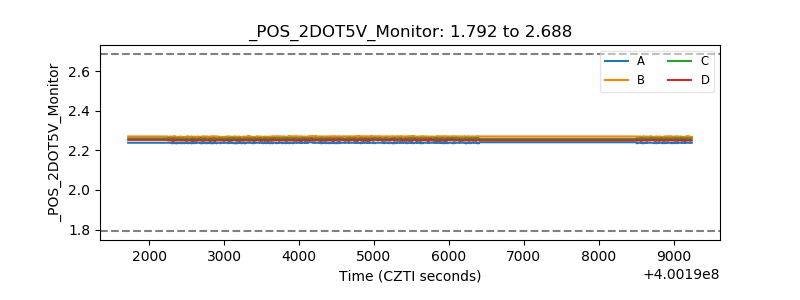 |
| +5 Volts monitor | 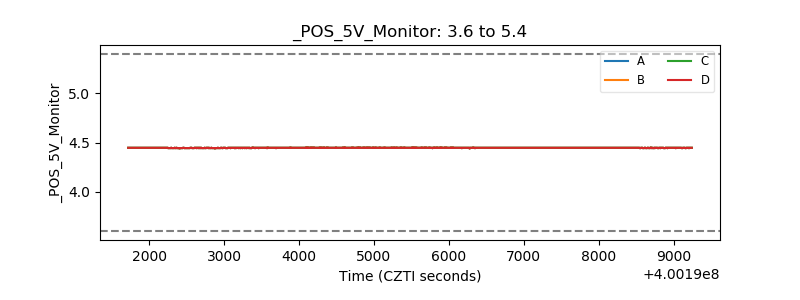 |
| _ROLL_ROT | 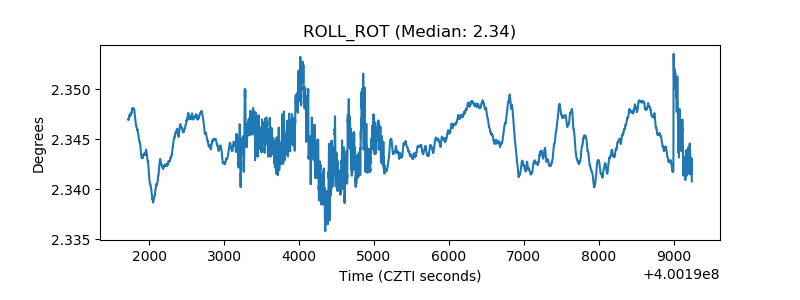 |
| _Roll_DEC | 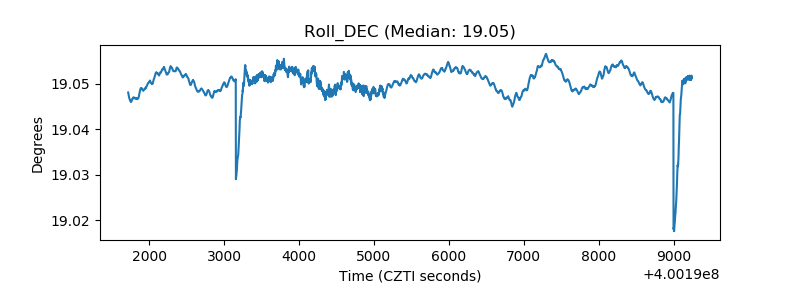 |
| _Roll_RA | 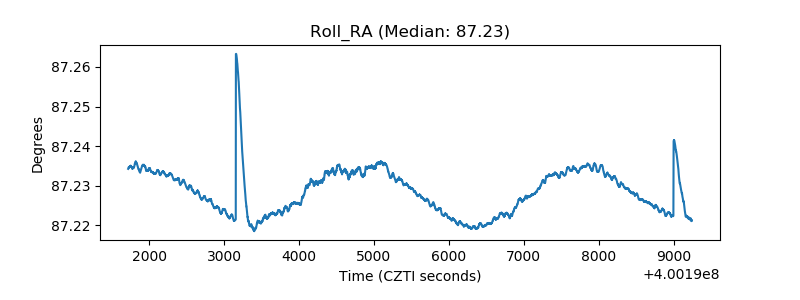 |
| Veto Counter | 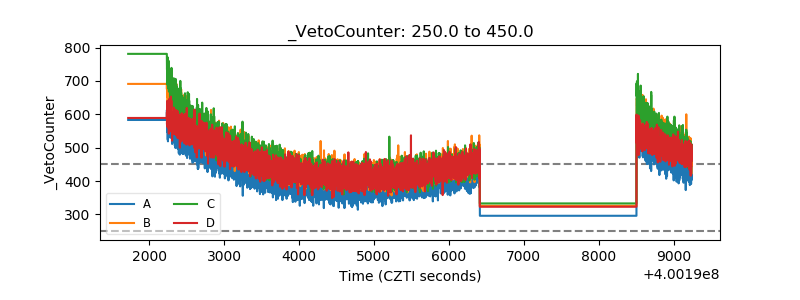 |