| Param | Original file | Final file |
|---|---|---|
| Filename | modeM0/AS1A09_061T01_9000005330_37536cztM0_level2.evt | modeM0/AS1A09_061T01_9000005330_37536cztM0_level2_quad_clean.evt |
| Size (bytes) | 124,312,320 | 24,958,080 |
| Size | 118.6 MB | 23.8 MB |
| Events in quadrant A | 1,310,697 | 162,369 |
| Events in quadrant B | 805,535 | 172,812 |
| Events in quadrant C | 792,378 | 169,328 |
| Events in quadrant D | 772,450 | 160,400 |
| Mode SS | |||
|---|---|---|---|
| Quadrant | BADHDUFLAG | Total packets | Discarded packets |
| A | 0 | 24 | 0 |
| B | 0 | 24 | 0 |
| C | 0 | 24 | 0 |
| D | 0 | 24 | 0 |
| Mode M9 | |||
|---|---|---|---|
| Quadrant | BADHDUFLAG | Total packets | Discarded packets |
| A | 0 | 9 | 0 |
| B | 0 | 9 | 0 |
| C | 0 | 9 | 0 |
| D | 0 | 10 | 0 |
| Mode M0 | |||
|---|---|---|---|
| Quadrant | BADHDUFLAG | Total packets | Discarded packets |
| A | 0 | 4770 | 1 |
| B | 0 | 3188 | 1 |
| C | 0 | 3059 | 1 |
| D | 0 | 3051 | 1 |
| Quadrant | Total seconds | Saturated seconds | Saturation percentage |
|---|---|---|---|
| A | 1196 | 56 | 4.682274% |
| B | 1196 | 18 | 1.505017% |
| C | 1196 | 45 | 3.762542% |
| D | 1196 | 26 | 2.173913% |
Noise dominated data is calculated using 1-second bins in cleaned event files. If a bin has >2000 counts, and if more than 50% of those come from <1% of pixels, then it is considered to be noise-dominated and hence unusable.
| Quadrant | # 1 sec bins | Bins with >0 counts | Bins with >2000 counts | High rate bins dominated by noise | Noise dominated (total time) | Noise dominated (detector-on time) | Marked lightcurve |
|---|---|---|---|---|---|---|---|
| A | 1196 | 1196 | 36 | 36 | 3.01% | 3.01% | 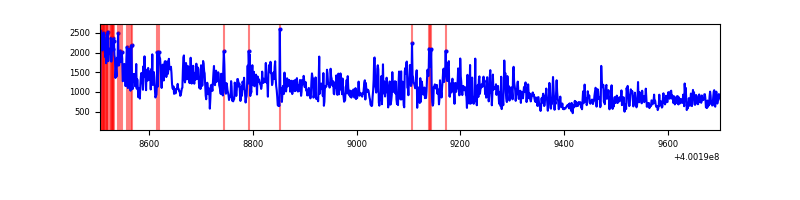 |
| B | 1196 | 1196 | 10 | 10 | 0.84% | 0.84% | 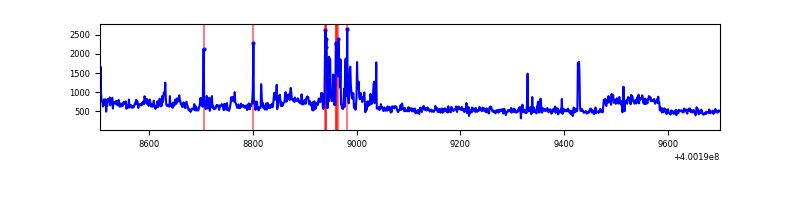 |
| C | 1196 | 1196 | 37 | 37 | 3.09% | 3.09% | 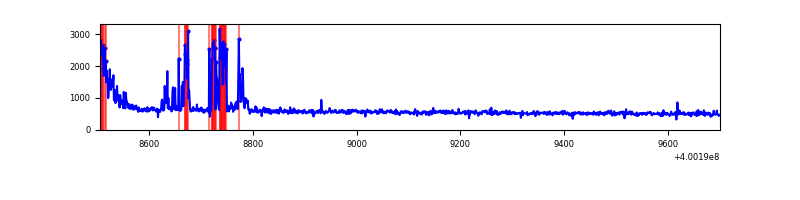 |
| D | 1196 | 1196 | 14 | 14 | 1.17% | 1.17% | 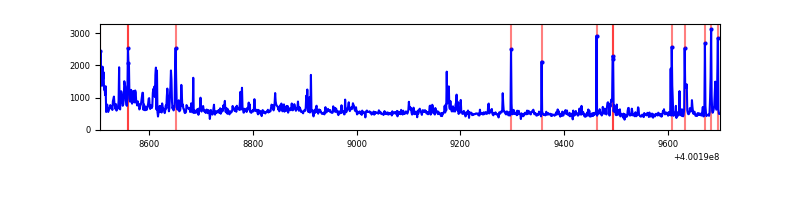 |
Top three noisy pixels from each quadrant. If the there are fewer than three noisy pixels in the level2.evt file, extra rows are filled as -1
| Pixel properties | Quadrant properties | ||||||
|---|---|---|---|---|---|---|---|
| Quadrant | DetID | PixID | Counts | Sigma | Mean | Median | Sigma |
| A | 15 | 222 | 610140 | 18550.28 | 151 | 148 | 32.9 |
| A | 10 | 83 | 106006 | 3219.22 | 151 | 148 | 32.9 |
| A | 13 | 6 | 4577 | 134.69 | 151 | 148 | 32.9 |
| B | 4 | 141 | 66292 | 2131.69 | 156 | 152 | 31.0 |
| B | 5 | 200 | 39186 | 1258.06 | 156 | 152 | 31.0 |
| B | 0 | 190 | 25195 | 807.13 | 156 | 152 | 31.0 |
| C | 14 | 254 | 93976 | 2482.97 | 153 | 153 | 37.8 |
| C | 15 | 214 | 53413 | 1409.49 | 153 | 153 | 37.8 |
| C | 0 | 10 | 45943 | 1211.8 | 153 | 153 | 37.8 |
| D | 2 | 249 | 53160 | 1360.93 | 151 | 147 | 39.0 |
| D | 12 | 233 | 40115 | 1026.04 | 151 | 147 | 39.0 |
| D | 12 | 227 | 21420 | 546.11 | 151 | 147 | 39.0 |
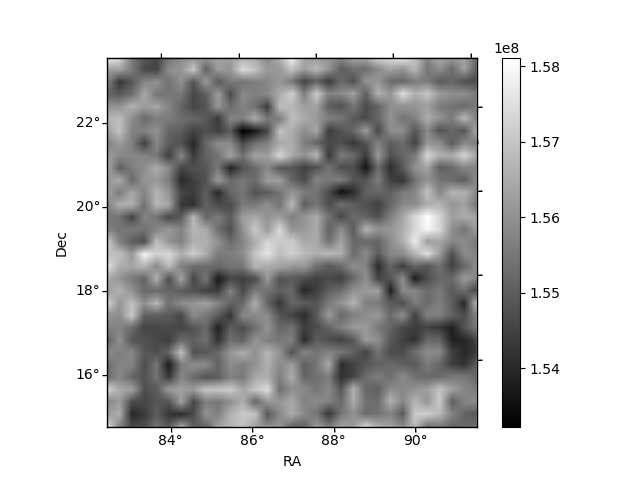
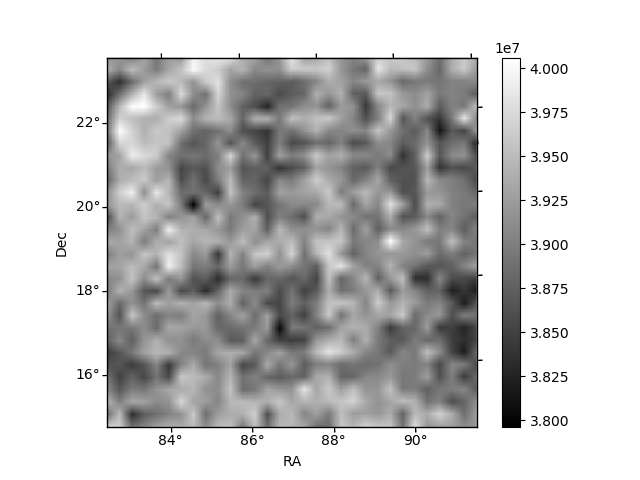
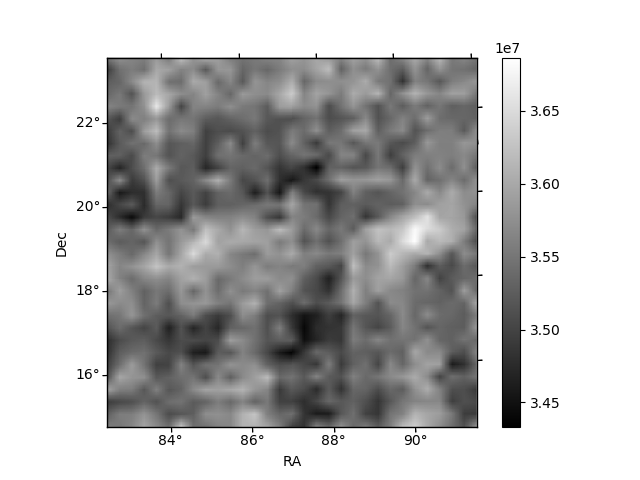
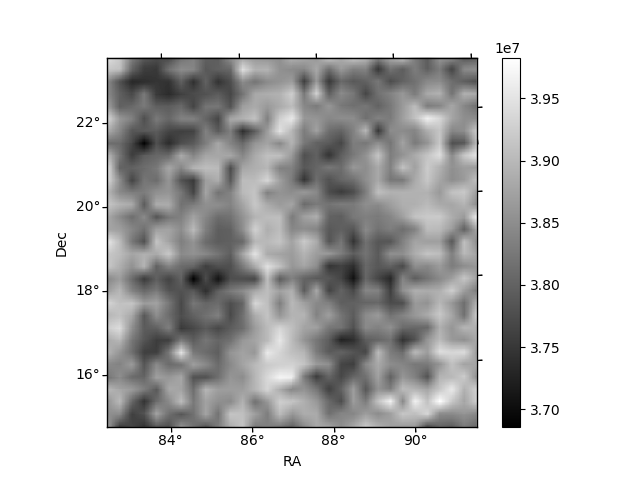
Histogram calculated using DETX and DETY for each event in the final _common_clean file
| Quadrant A | 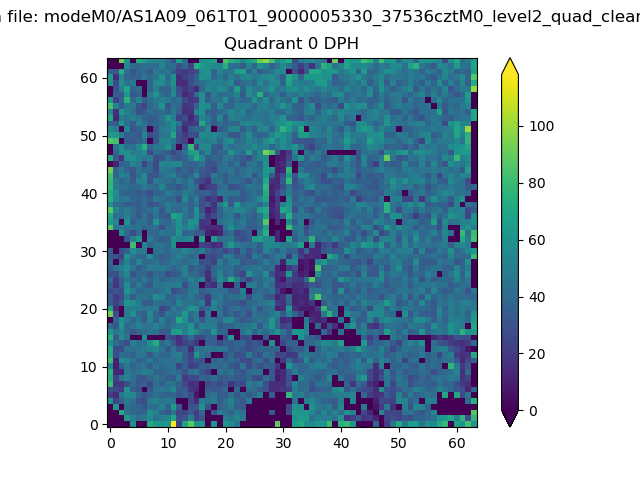 |
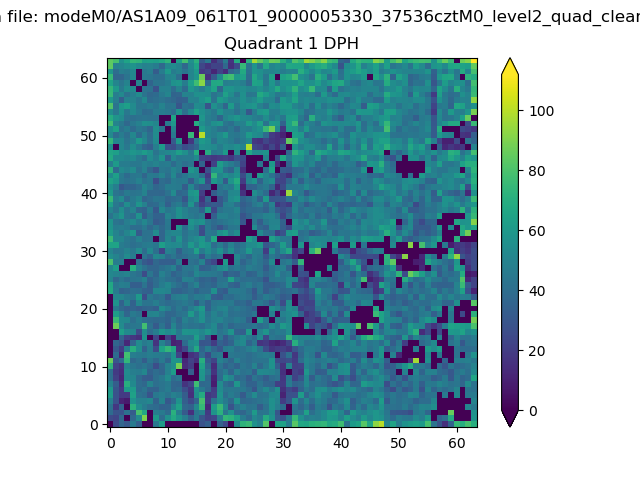 |
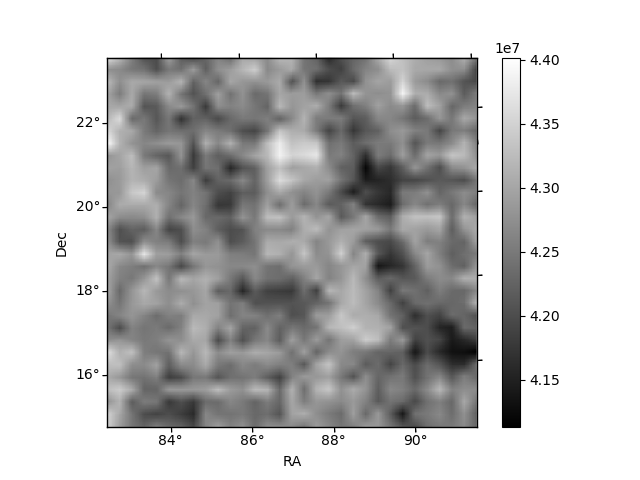
Quadrant B |
|---|---|---|---|
| Quadrant D | 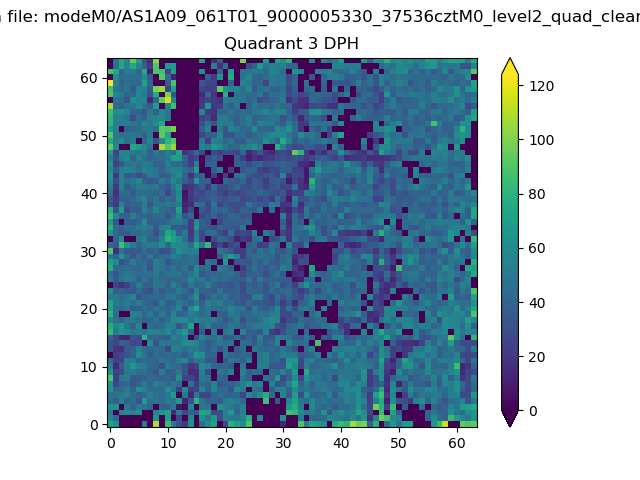 |
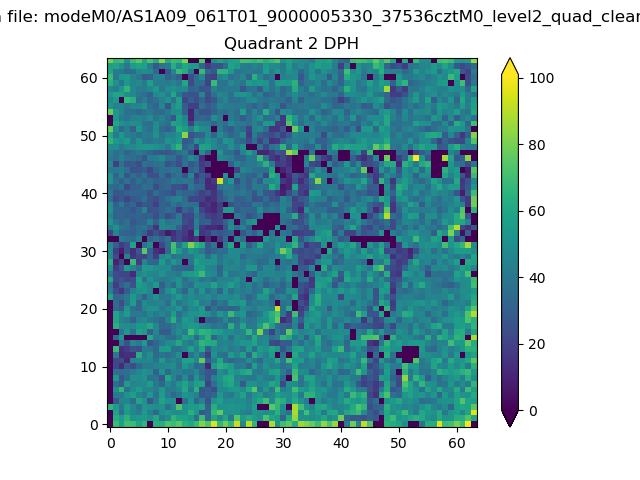 |
Quadrant C |
| Plot type | Count rate plots | Images |
|---|---|---|
| Comparison with Poisson distribution Blue bars denote a histogram of data divided into 1 sec bins. Red curve is a Poisson curve with rate = median count rate of data. |
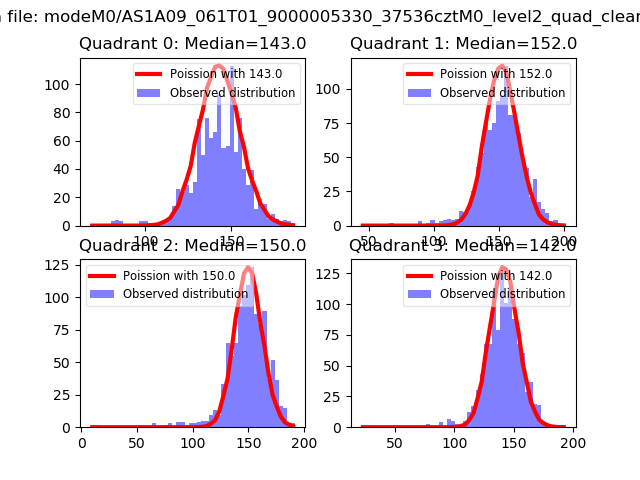 |
 |
| Quadrant-wise count rates Data is divided into 100 sec bins |
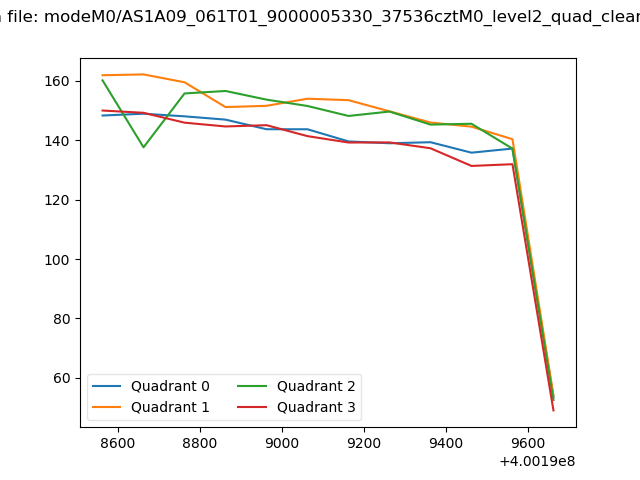 |
|
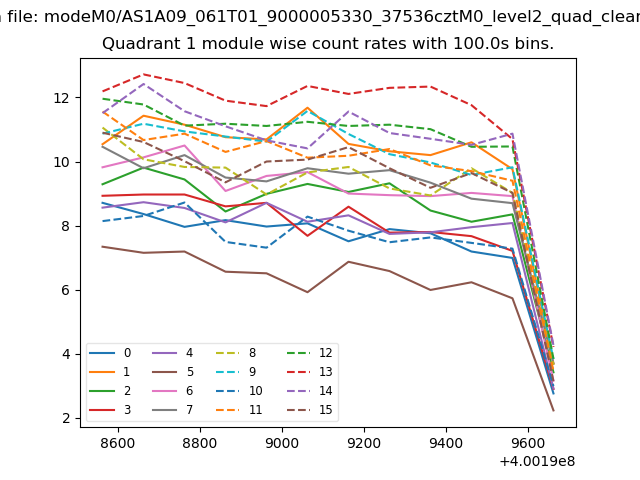
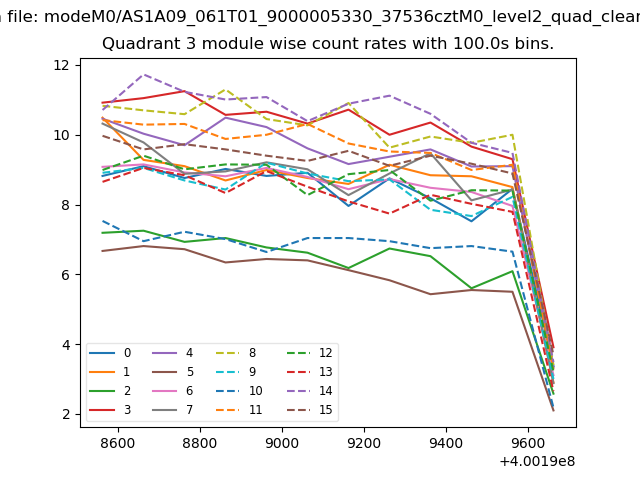
| Module-wise count rates for Quadrant A Data is divided into 100 sec bins |
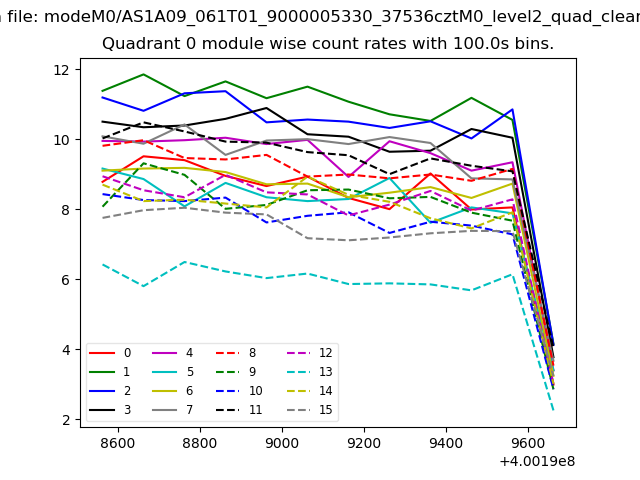 |
 |
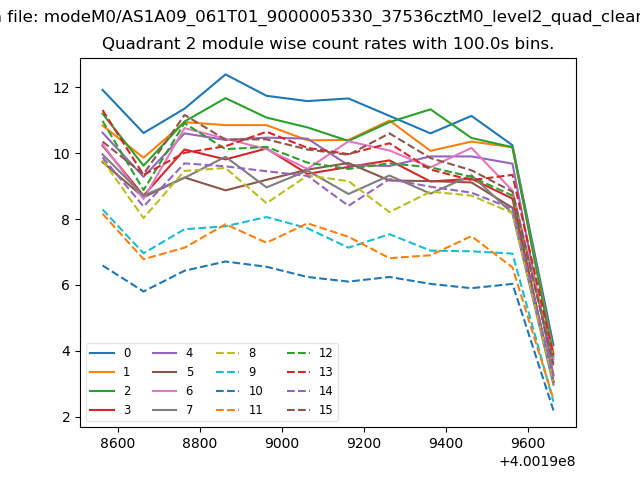
| Module-wise count rates for Quadrant B Data is divided into 100 sec bins |
 |
 |
| Module-wise count rates for Quadrant C Data is divided into 100 sec bins |
 |
 |
| Module-wise count rates for Quadrant D Data is divided into 100 sec bins |
 |
 |
| Parameter | Plot |
|---|---|
| CZT HV Monitor | 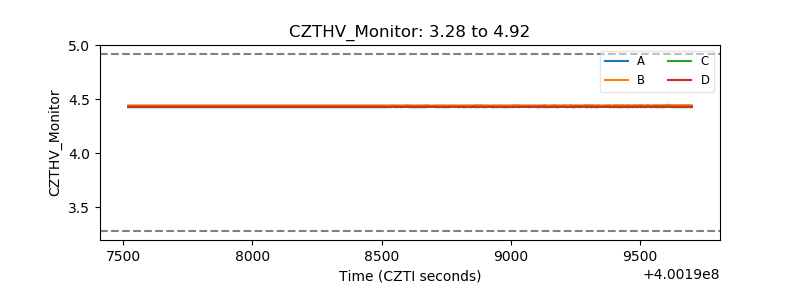 |
| D_VDD | 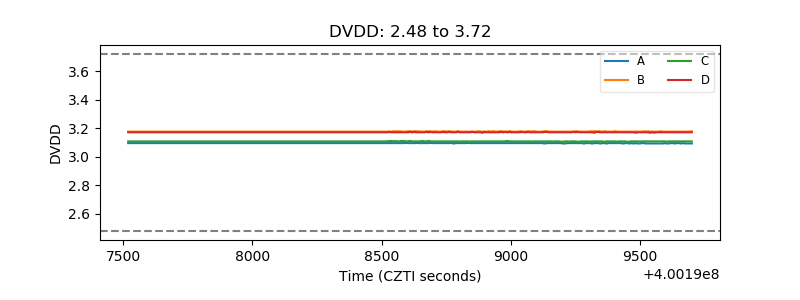 |
| Temperature 1 | 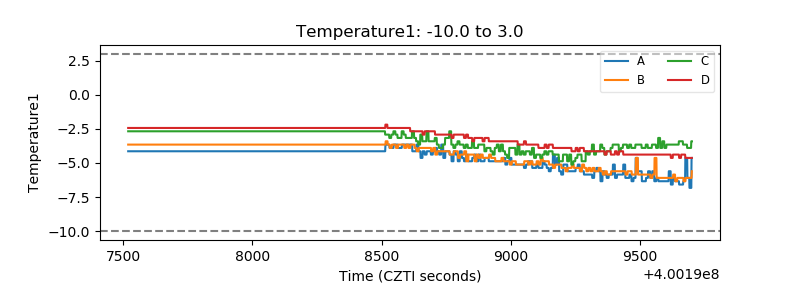 |
| Veto HV Monitor | 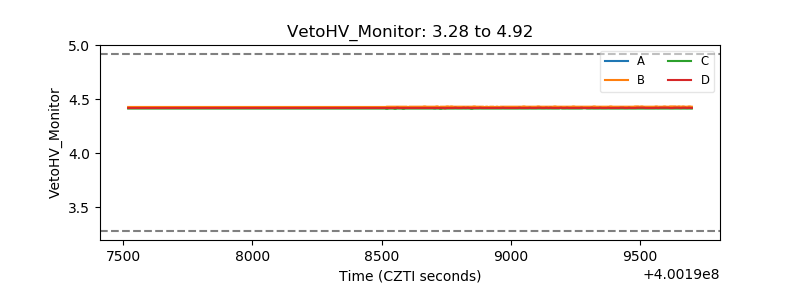 |
| Veto LLD | 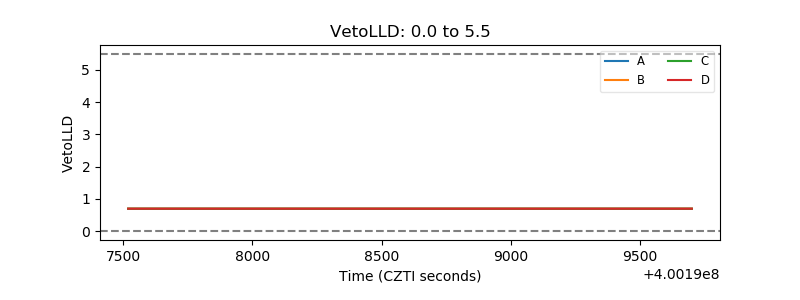 |
| Alpha Counter | 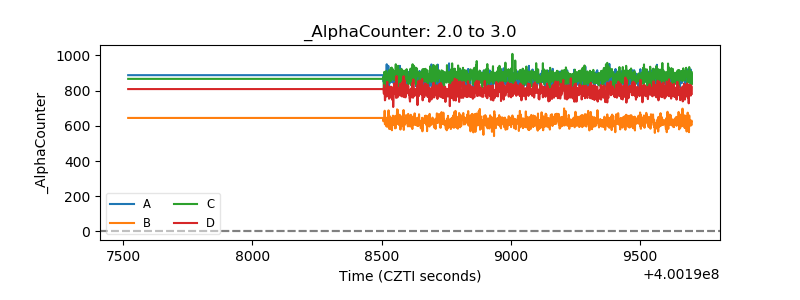 |
| _CPM_Rate | 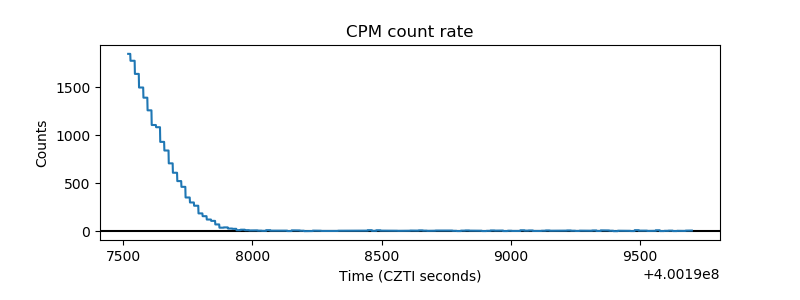 |
| CZT Counter | 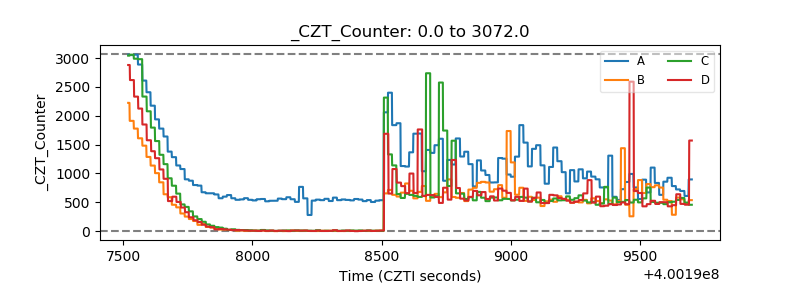 |
| +2.5 Volts monitor | 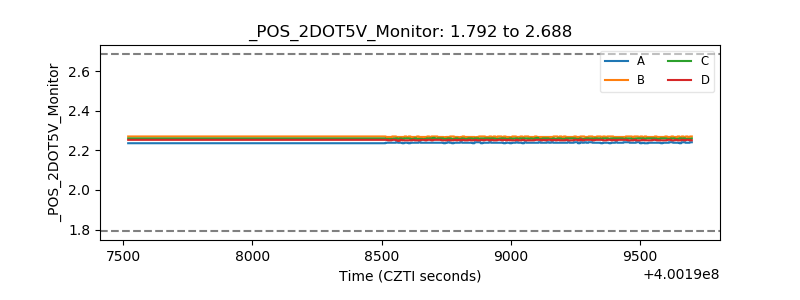 |
| +5 Volts monitor | 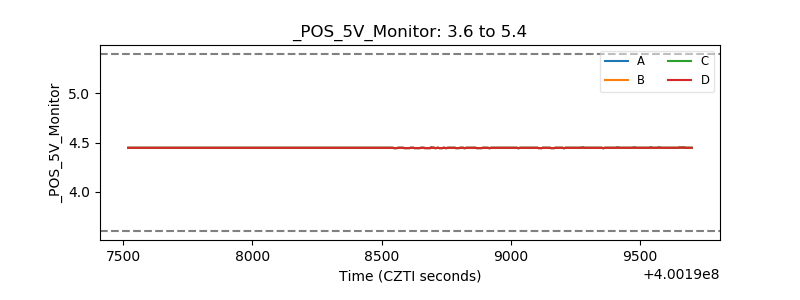 |
| _ROLL_ROT | 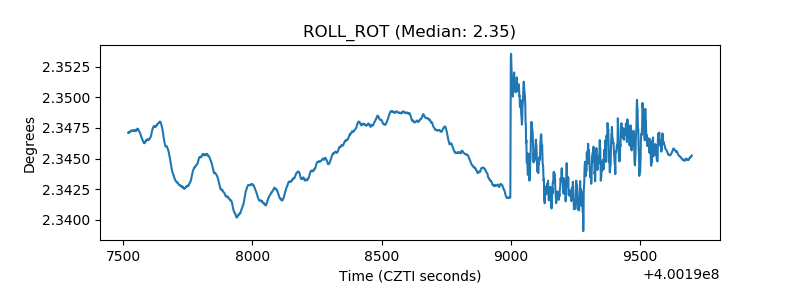 |
| _Roll_DEC | 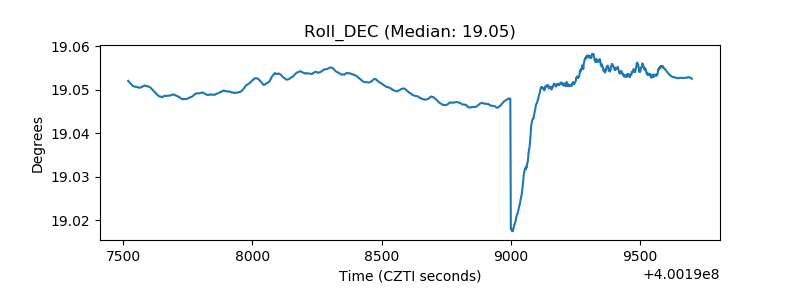 |
| _Roll_RA | 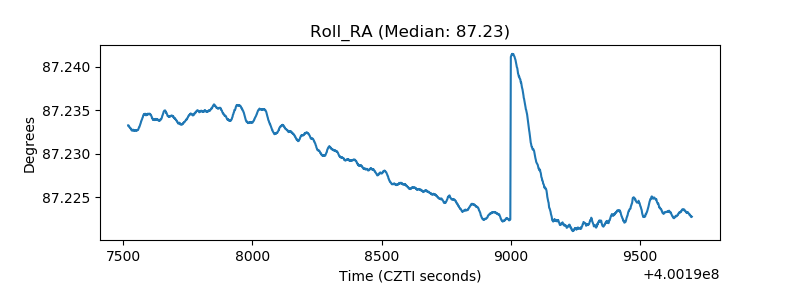 |
| Veto Counter | 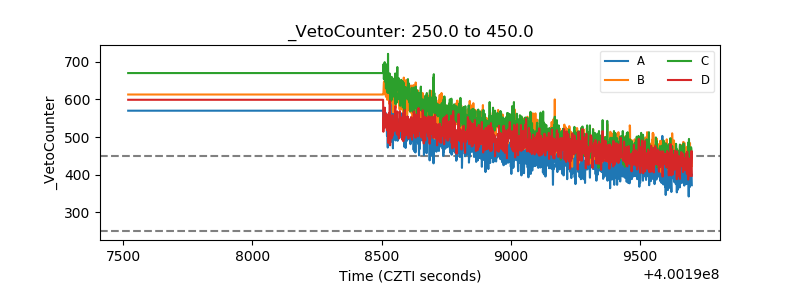 |