| Param | Original file | Final file |
|---|---|---|
| Filename | modeM0/AS1A10_113T02_9000005332cztM0_level2.fits | modeM0/AS1A10_113T02_9000005332cztM0_level2_quad_clean.evt |
| Size (bytes) | 212,068,800 | 235,382,400 |
| Size | 202.2 MB | 224.5 MB |
| Events in quadrant A | 1,283,926 | 1,501,828 |
| Events in quadrant B | 1,234,248 | 1,478,753 |
| Events in quadrant C | 1,278,050 | 1,437,687 |
| Events in quadrant D | 1,029,722 | 1,114,526 |
| Mode SS | |||
|---|---|---|---|
| Quadrant | BADHDUFLAG | Total packets | Discarded packets |
| A | 0 | 474 | 0 |
| B | 0 | 474 | 0 |
| C | 0 | 474 | 0 |
| D | 0 | 474 | 0 |
| Mode M9 | |||
|---|---|---|---|
| Quadrant | BADHDUFLAG | Total packets | Discarded packets |
| A | 0 | 89 | 0 |
| B | 0 | 89 | 0 |
| C | 0 | 89 | 0 |
| D | 0 | 89 | 0 |
| Mode M0 | |||
|---|---|---|---|
| Quadrant | BADHDUFLAG | Total packets | Discarded packets |
| A | 0 | 61376 | 0 |
| B | 0 | 51646 | 0 |
| C | 0 | 48605 | 0 |
| D | 0 | 77350 | 0 |
| Quadrant | Total seconds | Saturated seconds | Saturation percentage |
|---|---|---|---|
| A | 23182 | 217 | 0.936071% |
| B | 23182 | 329 | 1.419205% |
| C | 23182 | 97 | 0.418428% |
| D | 23182 | 3009 | 12.979898% |
Noise dominated data is calculated using 1-second bins in cleaned event files. If a bin has >2000 counts, and if more than 50% of those come from <1% of pixels, then it is considered to be noise-dominated and hence unusable.
| Quadrant | # 1 sec bins | Bins with >0 counts | Bins with >2000 counts | High rate bins dominated by noise | Noise dominated (total time) | Noise dominated (detector-on time) | Marked lightcurve |
|---|---|---|---|---|---|---|---|
| A | 32148 | 23181 | 0 | 0 | 0.00% | 0.00% |  |
| B | 32148 | 23176 | 0 | 0 | 0.00% | 0.00% |  |
| C | 32148 | 23180 | 0 | 0 | 0.00% | 0.00% |  |
| D | 32147 | 23051 | 0 | 0 | 0.00% | 0.00% |  |
Top three noisy pixels from each quadrant. If the there are fewer than three noisy pixels in the level2.evt file, extra rows are filled as -1
| Pixel properties | Quadrant properties | ||||||
|---|---|---|---|---|---|---|---|
| Quadrant | DetID | PixID | Counts | Sigma | Mean | Median | Sigma |
| A | 7 | 110 | 1098 | 9.41 | 335 | 315 | 83.2 |
| A | 9 | 19 | 1074 | 9.12 | 335 | 315 | 83.2 |
| A | 0 | 29 | 998 | 8.21 | 335 | 315 | 83.2 |
| B | 2 | 9 | 1036 | 10.91 | 328 | 313 | 66.3 |
| B | 3 | 80 | 1015 | 10.59 | 328 | 313 | 66.3 |
| B | 5 | 128 | 875 | 8.48 | 328 | 313 | 66.3 |
| C | 1 | 81 | 1047 | 8.38 | 338 | 318 | 87.0 |
| C | 1 | 80 | 1025 | 8.12 | 338 | 318 | 87.0 |
| C | 3 | 234 | 910 | 6.8 | 338 | 318 | 87.0 |
| D | 10 | 189 | 820 | 6.92 | 294 | 269 | 79.6 |
| D | 10 | 113 | 763 | 6.2 | 294 | 269 | 79.6 |
| D | 3 | 14 | 757 | 6.13 | 294 | 269 | 79.6 |
Histogram calculated using DETX and DETY for each event in the final _common_clean file
| Quadrant A | 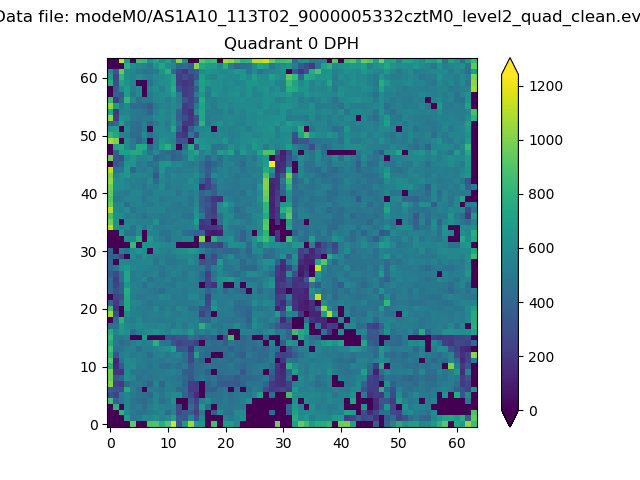 |
 |
Quadrant B |
|---|---|---|---|
| Quadrant D | 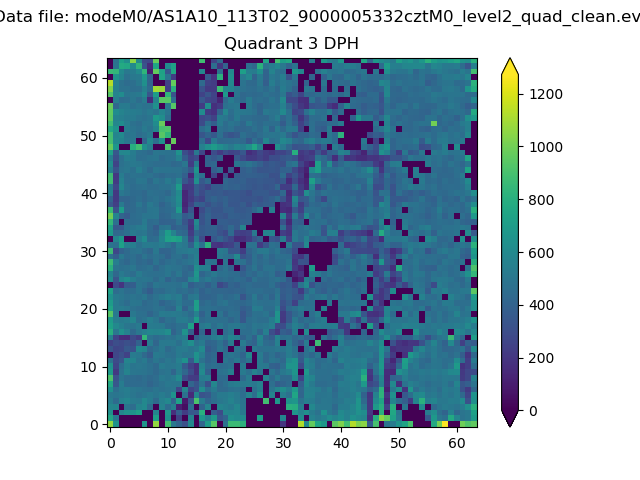 |
 |
Quadrant C |
| Plot type | Count rate plots | Images |
|---|---|---|
| Comparison with Poisson distribution Blue bars denote a histogram of data divided into 1 sec bins. Red curve is a Poisson curve with rate = median count rate of data. |
 |
 |
| Quadrant-wise count rates Data is divided into 100 sec bins |
 |
|
| Module-wise count rates for Quadrant A Data is divided into 100 sec bins |
 |
 |
| Module-wise count rates for Quadrant B Data is divided into 100 sec bins |
 |
 |
| Module-wise count rates for Quadrant C Data is divided into 100 sec bins |
 |
 |
| Module-wise count rates for Quadrant D Data is divided into 100 sec bins |
 |
 |
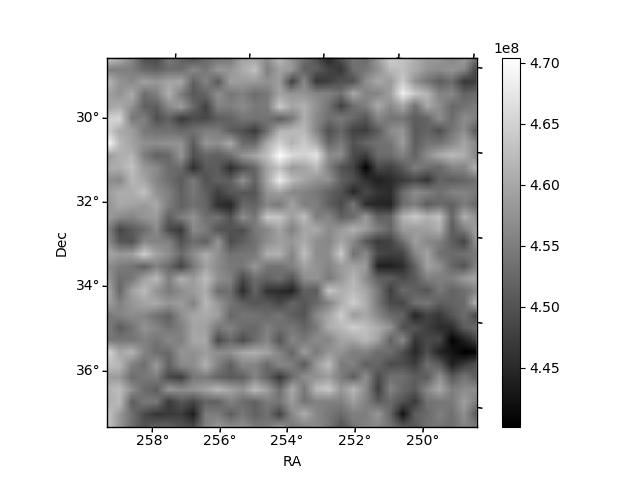
| Parameter | Plot |
|---|---|
| CZT HV Monitor |  |
| D_VDD | 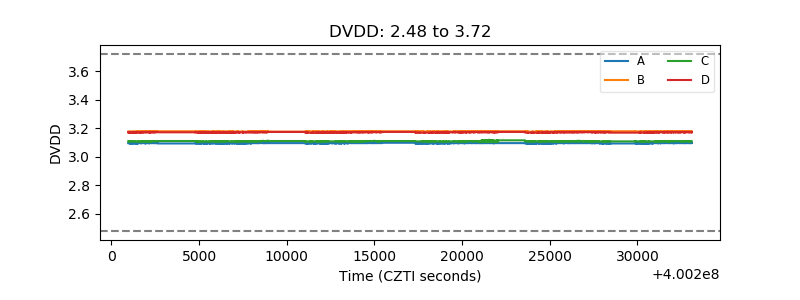 |
| Temperature 1 |  |
| Veto HV Monitor | 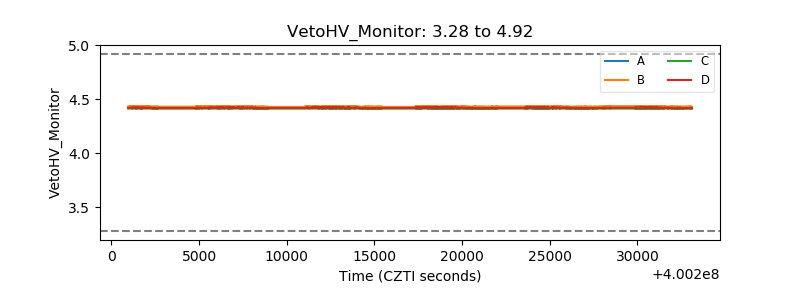 |
| Veto LLD |  |
| Alpha Counter |  |
| _CPM_Rate | 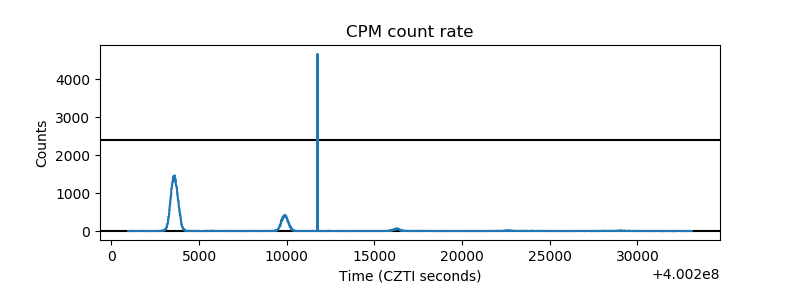 |
| CZT Counter | 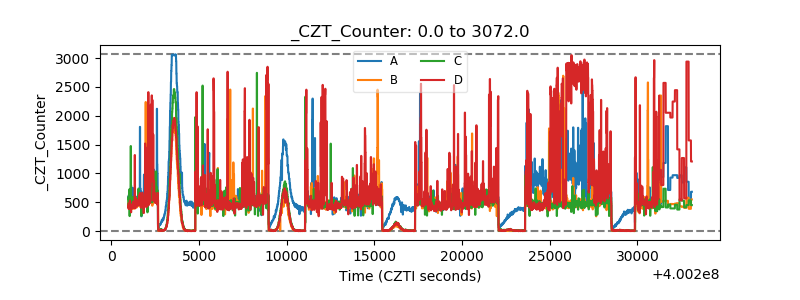 |
| +2.5 Volts monitor |  |
| +5 Volts monitor |  |
| _ROLL_ROT |  |
| _Roll_DEC |  |
| _Roll_RA |  |
| Veto Counter | 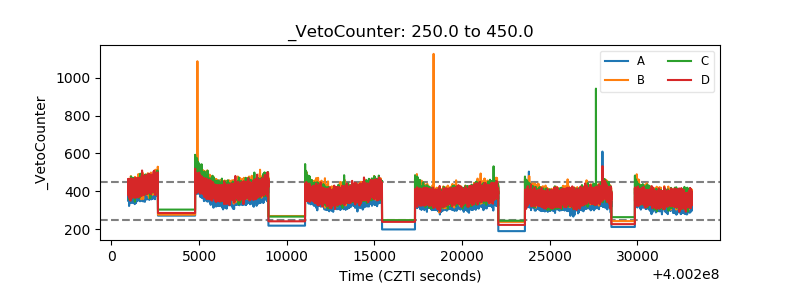 |