| Param | Original file | Final file |
|---|---|---|
| Filename | modeM0/AS1A10_113T02_9000005332_37536cztM0_level2.evt | modeM0/AS1A10_113T02_9000005332_37536cztM0_level2_quad_clean.evt |
| Size (bytes) | 203,250,240 | 34,223,040 |
| Size | 193.8 MB | 32.6 MB |
| Events in quadrant A | 1,669,024 | 218,344 |
| Events in quadrant B | 1,282,900 | 222,945 |
| Events in quadrant C | 1,376,236 | 219,874 |
| Events in quadrant D | 1,664,226 | 203,936 |
| Mode SS | |||
|---|---|---|---|
| Quadrant | BADHDUFLAG | Total packets | Discarded packets |
| A | 0 | 50 | 0 |
| B | 0 | 50 | 0 |
| C | 0 | 50 | 0 |
| D | 0 | 50 | 0 |
| Mode M9 | |||
|---|---|---|---|
| Quadrant | BADHDUFLAG | Total packets | Discarded packets |
| A | 0 | 21 | 0 |
| B | 0 | 21 | 0 |
| C | 0 | 21 | 0 |
| D | 0 | 21 | 0 |
| Mode M0 | |||
|---|---|---|---|
| Quadrant | BADHDUFLAG | Total packets | Discarded packets |
| A | 0 | 6641 | 2 |
| B | 0 | 5197 | 1 |
| C | 0 | 5416 | 1 |
| D | 0 | 6480 | 1 |
| Quadrant | Total seconds | Saturated seconds | Saturation percentage |
|---|---|---|---|
| A | 2370 | 35 | 1.476793% |
| B | 2370 | 24 | 1.012658% |
| C | 2370 | 29 | 1.223629% |
| D | 2370 | 134 | 5.654008% |
Noise dominated data is calculated using 1-second bins in cleaned event files. If a bin has >2000 counts, and if more than 50% of those come from <1% of pixels, then it is considered to be noise-dominated and hence unusable.
| Quadrant | # 1 sec bins | Bins with >0 counts | Bins with >2000 counts | High rate bins dominated by noise | Noise dominated (total time) | Noise dominated (detector-on time) | Marked lightcurve |
|---|---|---|---|---|---|---|---|
| A | 4493 | 2371 | 28 | 28 | 0.62% | 1.18% | 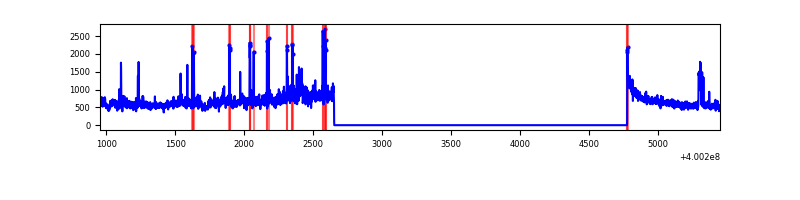 |
| B | 4493 | 2371 | 19 | 19 | 0.42% | 0.80% | 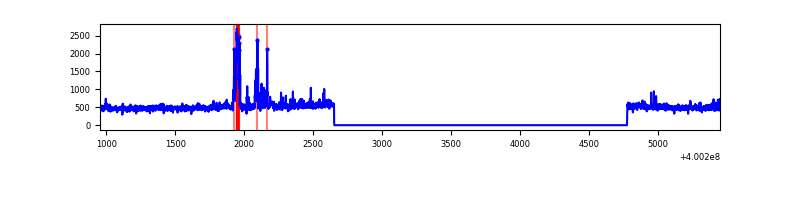 |
| C | 4493 | 2371 | 29 | 29 | 0.65% | 1.22% | 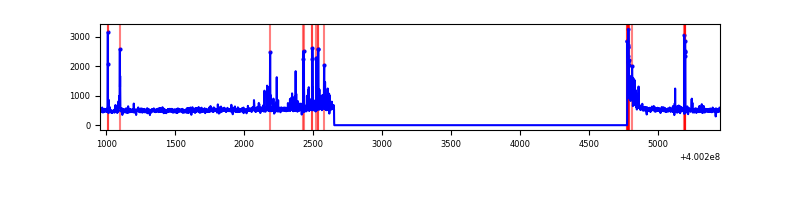 |
| D | 4492 | 2370 | 133 | 133 | 2.96% | 5.61% | 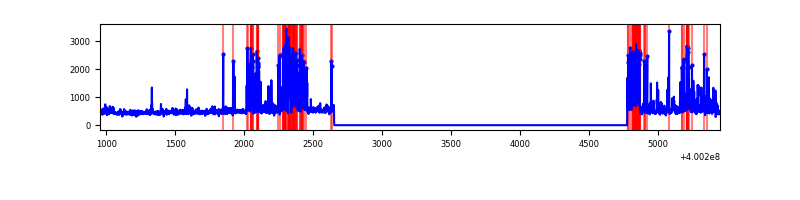 |
Top three noisy pixels from each quadrant. If the there are fewer than three noisy pixels in the level2.evt file, extra rows are filled as -1
| Pixel properties | Quadrant properties | ||||||
|---|---|---|---|---|---|---|---|
| Quadrant | DetID | PixID | Counts | Sigma | Mean | Median | Sigma |
| A | 15 | 222 | 384203 | 6390.59 | 291 | 286 | 60.1 |
| A | 10 | 83 | 136874 | 2273.61 | 291 | 286 | 60.1 |
| A | 6 | 10 | 9380 | 151.38 | 291 | 286 | 60.1 |
| B | 5 | 172 | 100061 | 1752.15 | 288 | 282 | 56.9 |
| B | 0 | 230 | 8062 | 136.62 | 288 | 282 | 56.9 |
| B | 0 | 219 | 7908 | 133.91 | 288 | 282 | 56.9 |
| C | 14 | 254 | 109854 | 1644.06 | 281 | 282 | 66.6 |
| C | 15 | 214 | 102072 | 1527.29 | 281 | 282 | 66.6 |
| C | 0 | 10 | 62976 | 940.68 | 281 | 282 | 66.6 |
| D | 2 | 249 | 239047 | 3498.94 | 278 | 272 | 68.2 |
| D | 12 | 233 | 167820 | 2455.2 | 278 | 272 | 68.2 |
| D | 10 | 199 | 47463 | 691.52 | 278 | 272 | 68.2 |
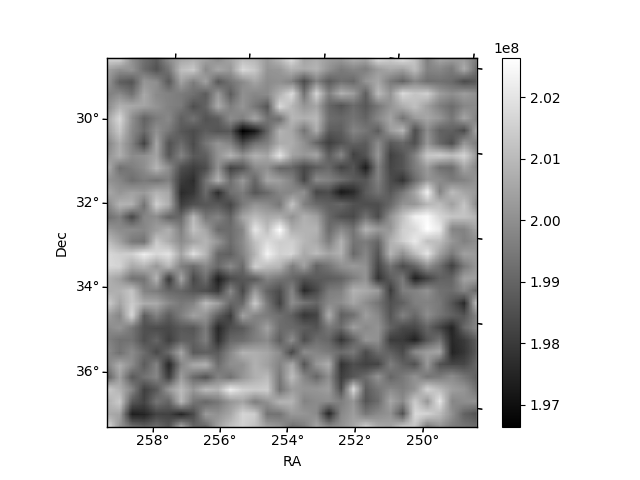
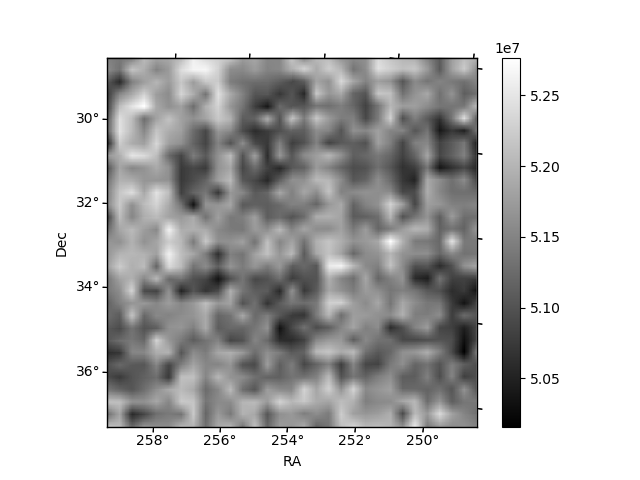
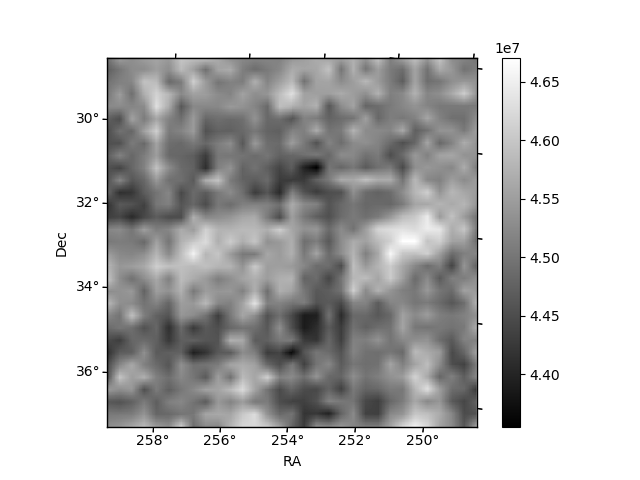
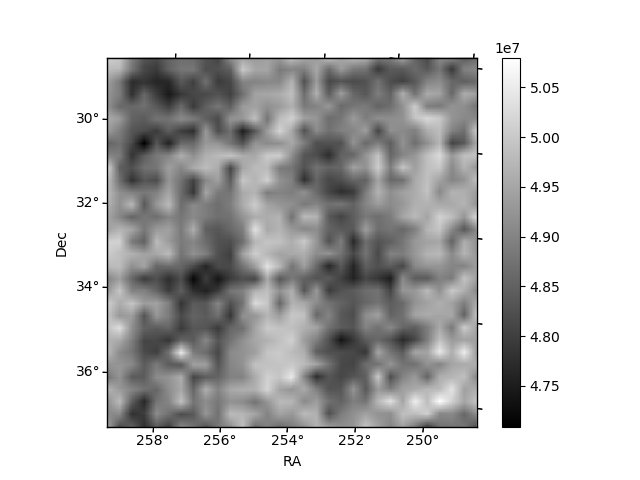
Histogram calculated using DETX and DETY for each event in the final _common_clean file
| Quadrant A | 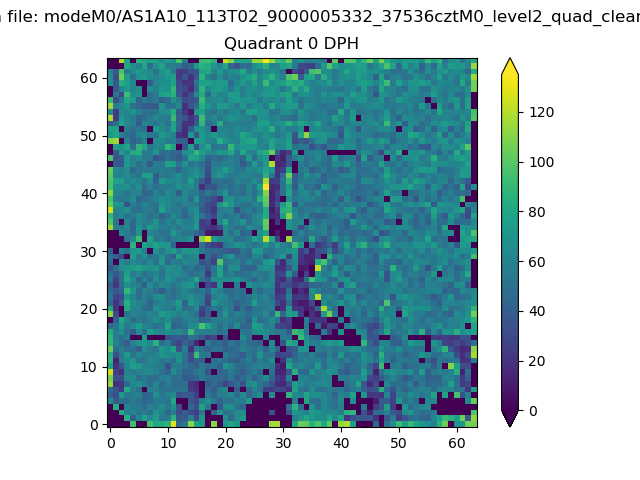 |
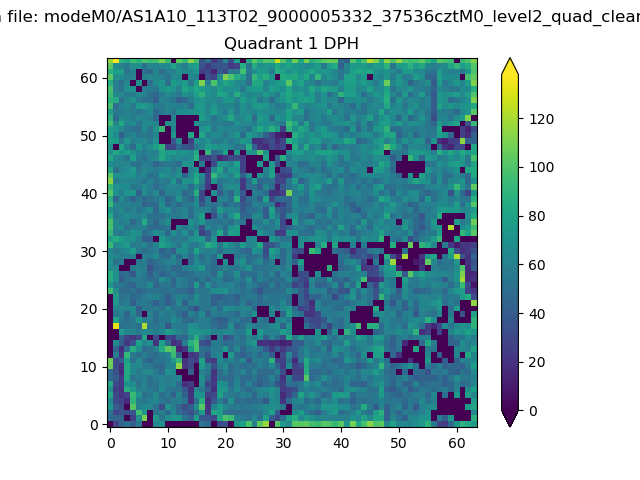 |
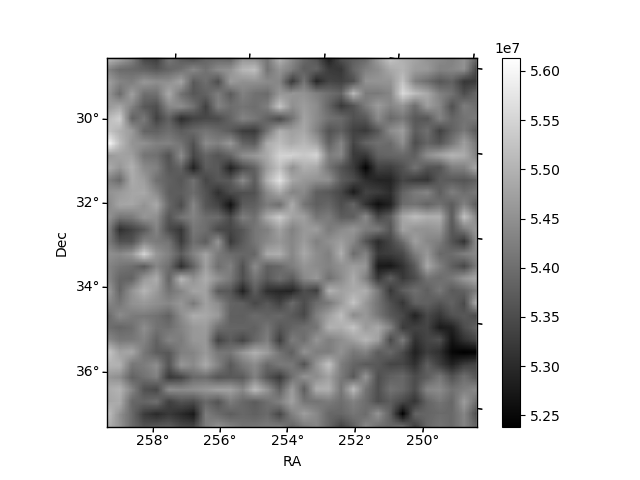
Quadrant B |
|---|---|---|---|
| Quadrant D | 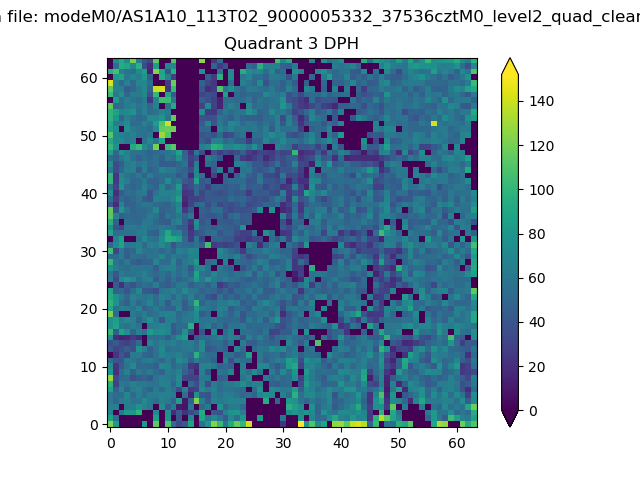 |
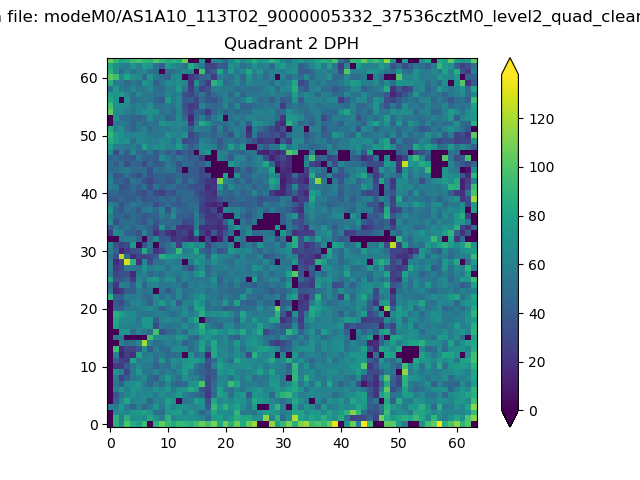 |
Quadrant C |
| Plot type | Count rate plots | Images |
|---|---|---|
| Comparison with Poisson distribution Blue bars denote a histogram of data divided into 1 sec bins. Red curve is a Poisson curve with rate = median count rate of data. |
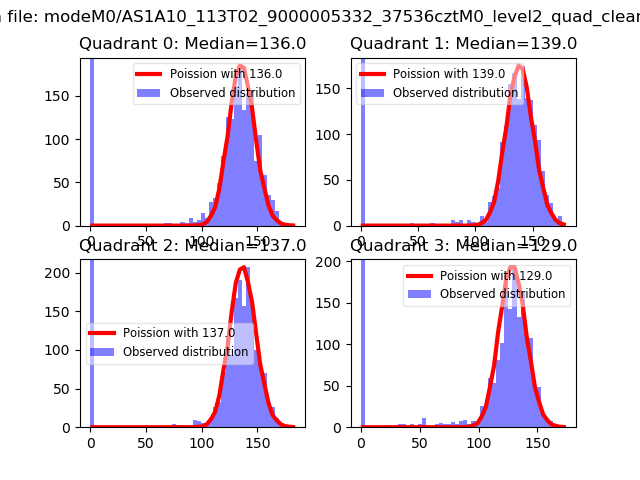 |
 |
| Quadrant-wise count rates Data is divided into 100 sec bins |
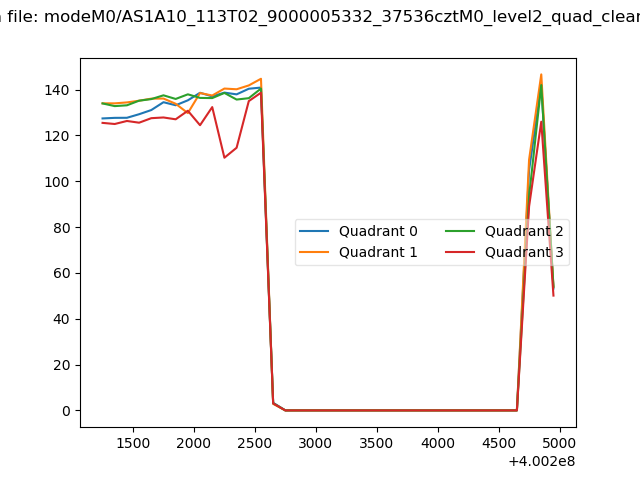 |
|
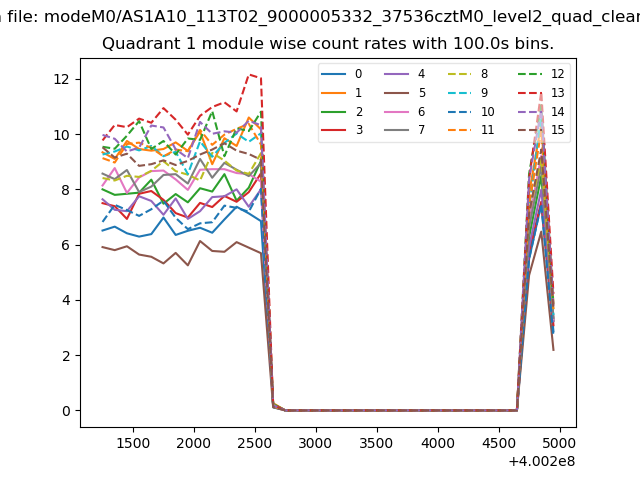
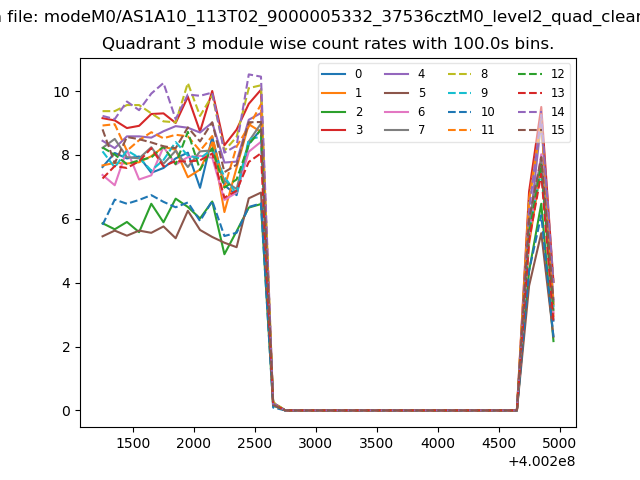
| Module-wise count rates for Quadrant A Data is divided into 100 sec bins |
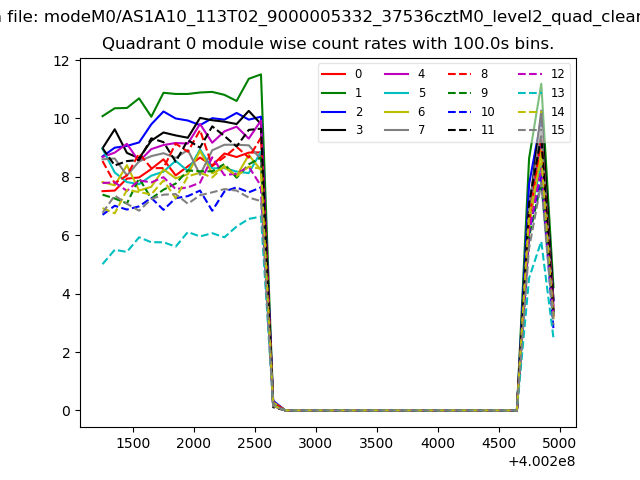 |
 |
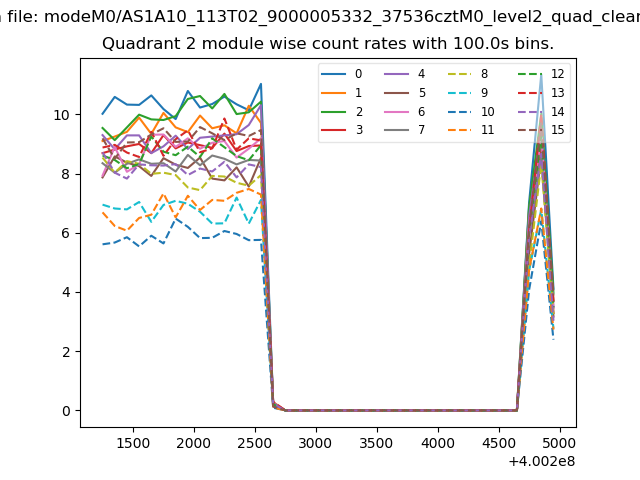
| Module-wise count rates for Quadrant B Data is divided into 100 sec bins |
 |
 |
| Module-wise count rates for Quadrant C Data is divided into 100 sec bins |
 |
 |
| Module-wise count rates for Quadrant D Data is divided into 100 sec bins |
 |
 |
| Parameter | Plot |
|---|---|
| CZT HV Monitor | 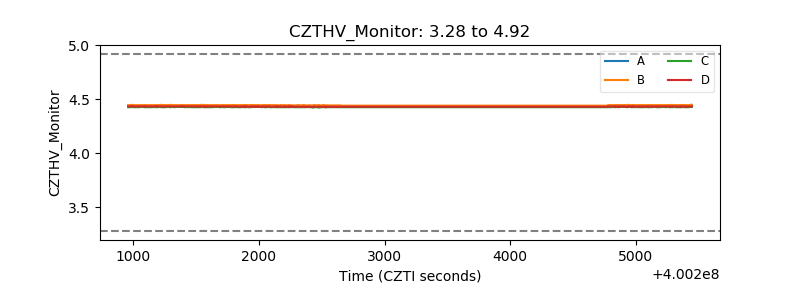 |
| D_VDD | 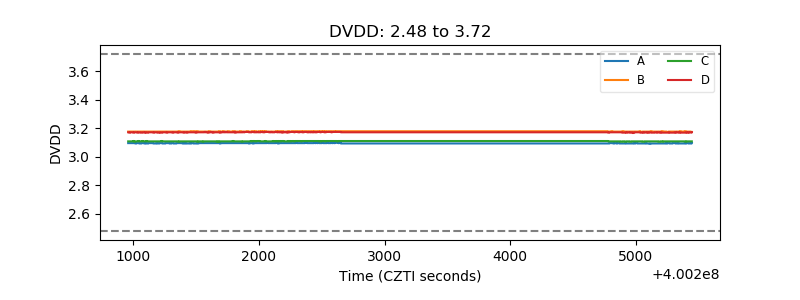 |
| Temperature 1 | 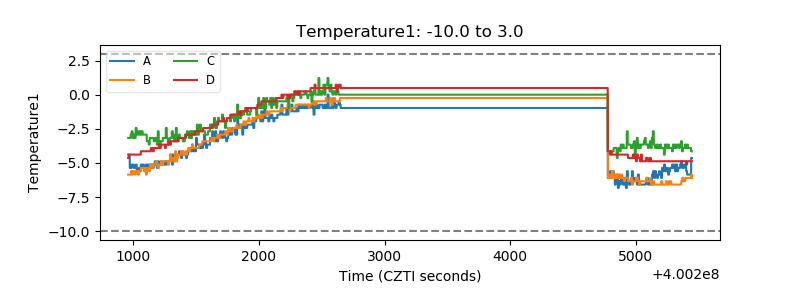 |
| Veto HV Monitor | 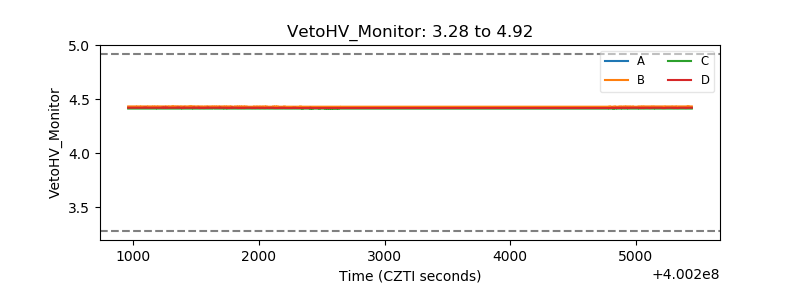 |
| Veto LLD | 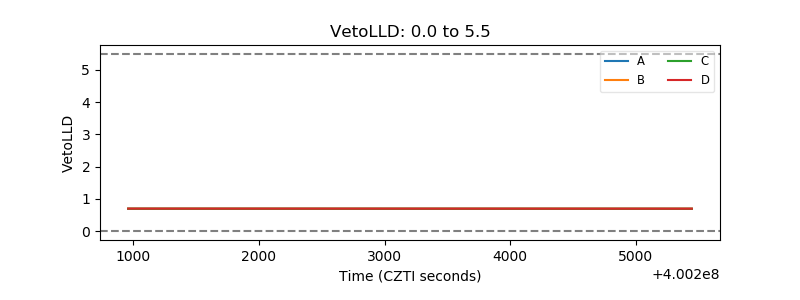 |
| Alpha Counter | 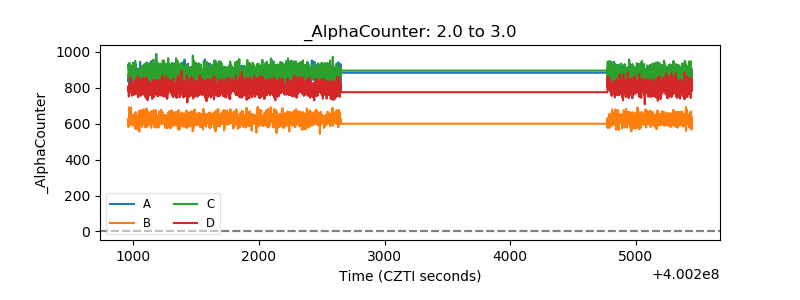 |
| _CPM_Rate | 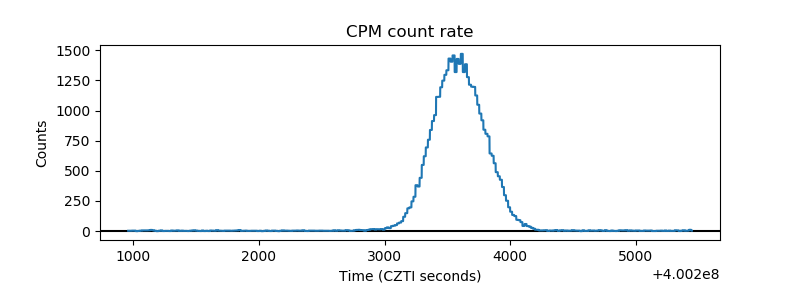 |
| CZT Counter | 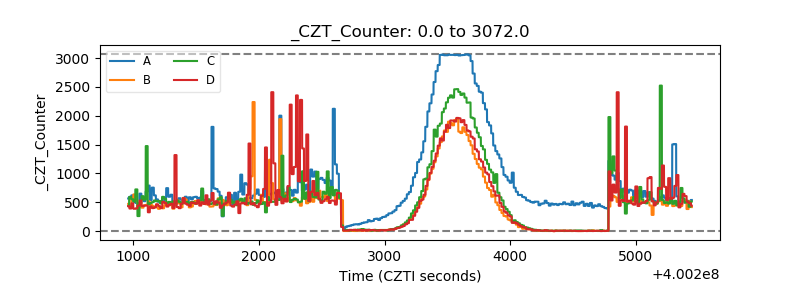 |
| +2.5 Volts monitor | 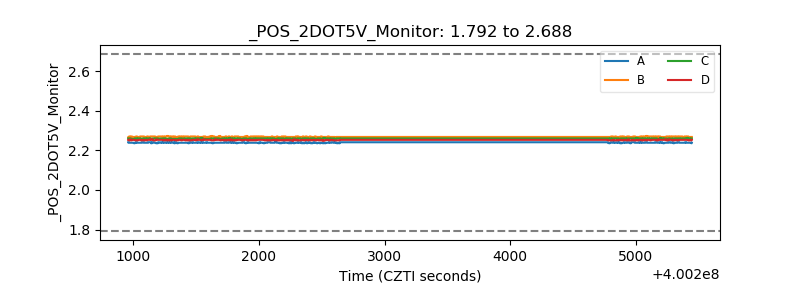 |
| +5 Volts monitor | 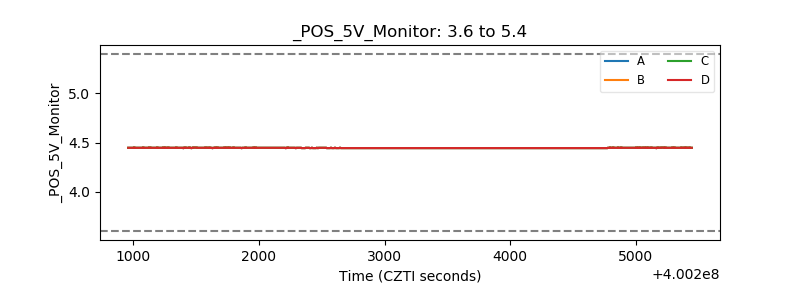 |
| _ROLL_ROT | 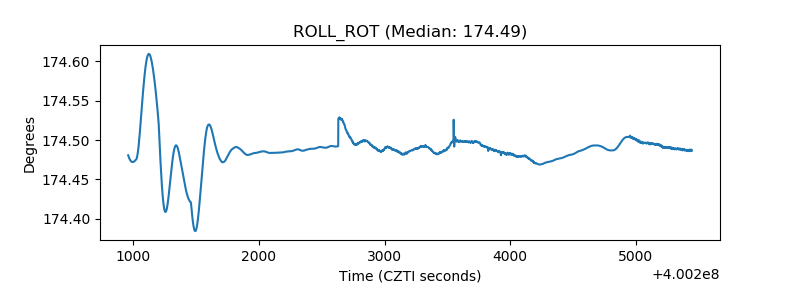 |
| _Roll_DEC | 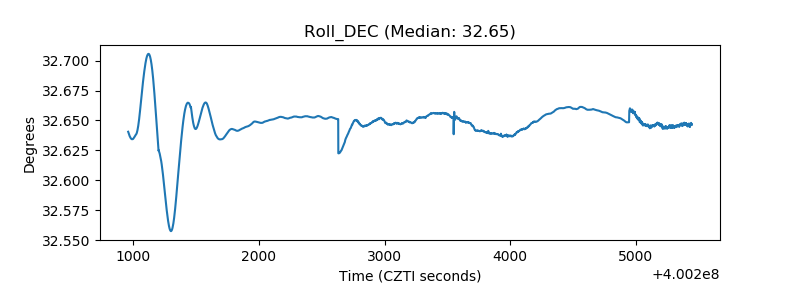 |
| _Roll_RA | 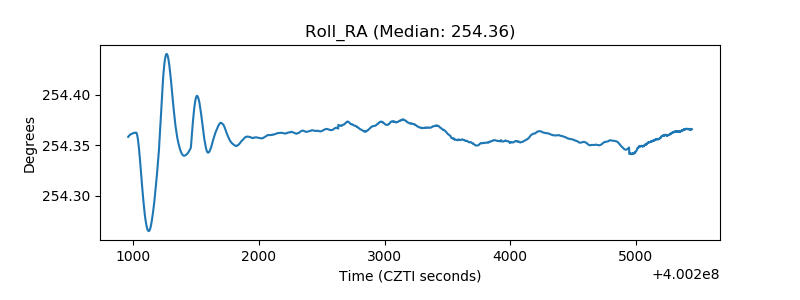 |
| Veto Counter | 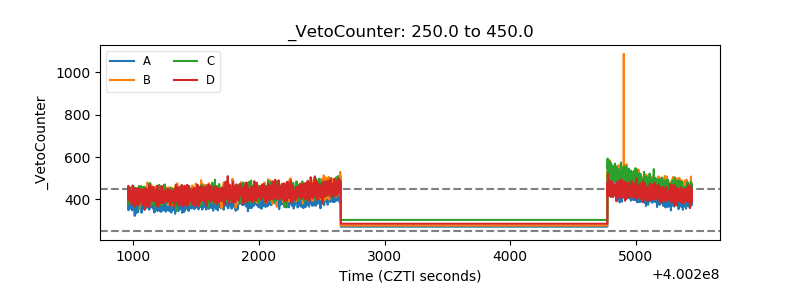 |