| Param | Original file | Final file |
|---|---|---|
| Filename | modeM0/AS1A10_113T02_9000005332_37537cztM0_level2.evt | modeM0/AS1A10_113T02_9000005332_37537cztM0_level2_quad_clean.evt |
| Size (bytes) | 413,297,280 | 47,759,040 |
| Size | 394.2 MB | 45.5 MB |
| Events in quadrant A | 2,911,482 | 277,370 |
| Events in quadrant B | 2,817,643 | 279,145 |
| Events in quadrant C | 2,770,097 | 273,182 |
| Events in quadrant D | 3,663,218 | 250,585 |
| Mode SS | |||
|---|---|---|---|
| Quadrant | BADHDUFLAG | Total packets | Discarded packets |
| A | 0 | 106 | 0 |
| B | 0 | 106 | 0 |
| C | 0 | 106 | 0 |
| D | 0 | 106 | 0 |
| Mode M9 | |||
|---|---|---|---|
| Quadrant | BADHDUFLAG | Total packets | Discarded packets |
| A | 0 | 41 | 0 |
| B | 0 | 41 | 0 |
| C | 0 | 41 | 0 |
| D | 0 | 41 | 0 |
| Mode M0 | |||
|---|---|---|---|
| Quadrant | BADHDUFLAG | Total packets | Discarded packets |
| A | 0 | 11815 | 3 |
| B | 0 | 11596 | 2 |
| C | 0 | 11225 | 2 |
| D | 0 | 14365 | 2 |
| Quadrant | Total seconds | Saturated seconds | Saturation percentage |
|---|---|---|---|
| A | 5213 | 33 | 0.633033% |
| B | 5213 | 51 | 0.978323% |
| C | 5213 | 33 | 0.633033% |
| D | 5213 | 335 | 6.426242% |
Noise dominated data is calculated using 1-second bins in cleaned event files. If a bin has >2000 counts, and if more than 50% of those come from <1% of pixels, then it is considered to be noise-dominated and hence unusable.
| Quadrant | # 1 sec bins | Bins with >0 counts | Bins with >2000 counts | High rate bins dominated by noise | Noise dominated (total time) | Noise dominated (detector-on time) | Marked lightcurve |
|---|---|---|---|---|---|---|---|
| A | 7306 | 5214 | 25 | 25 | 0.34% | 0.48% | 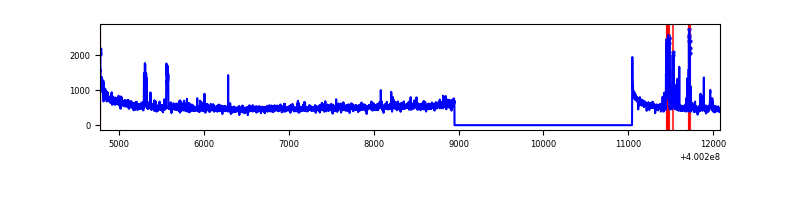 |
| B | 7306 | 5214 | 33 | 33 | 0.45% | 0.63% | 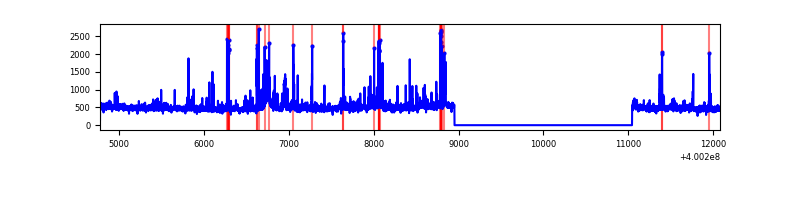 |
| C | 7306 | 5214 | 33 | 33 | 0.45% | 0.63% | 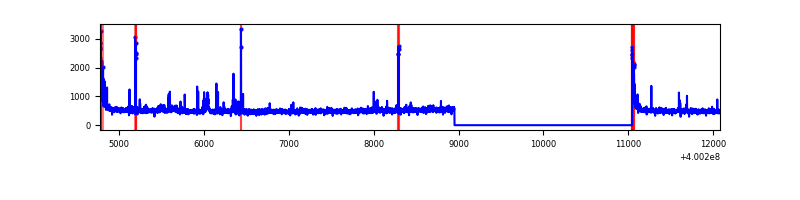 |
| D | 7306 | 5213 | 324 | 324 | 4.43% | 6.22% | 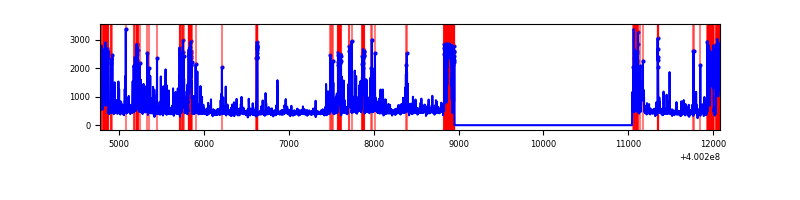 |
Top three noisy pixels from each quadrant. If the there are fewer than three noisy pixels in the level2.evt file, extra rows are filled as -1
| Pixel properties | Quadrant properties | ||||||
|---|---|---|---|---|---|---|---|
| Quadrant | DetID | PixID | Counts | Sigma | Mean | Median | Sigma |
| A | 10 | 83 | 280758 | 2306.23 | 606 | 595 | 121.5 |
| A | 15 | 222 | 138497 | 1135.17 | 606 | 595 | 121.5 |
| A | 13 | 248 | 114567 | 938.19 | 606 | 595 | 121.5 |
| B | 5 | 172 | 212108 | 1839.11 | 606 | 590 | 115.0 |
| B | 0 | 245 | 70382 | 606.83 | 606 | 590 | 115.0 |
| B | 0 | 230 | 29012 | 247.12 | 606 | 590 | 115.0 |
| C | 15 | 214 | 224095 | 1637.07 | 592 | 595 | 136.5 |
| C | 14 | 254 | 115162 | 839.17 | 592 | 595 | 136.5 |
| C | 0 | 10 | 108162 | 787.89 | 592 | 595 | 136.5 |
| D | 2 | 249 | 597998 | 4222.31 | 574 | 559 | 141.5 |
| D | 13 | 249 | 318457 | 2246.7 | 574 | 559 | 141.5 |
| D | 12 | 233 | 208143 | 1467.07 | 574 | 559 | 141.5 |
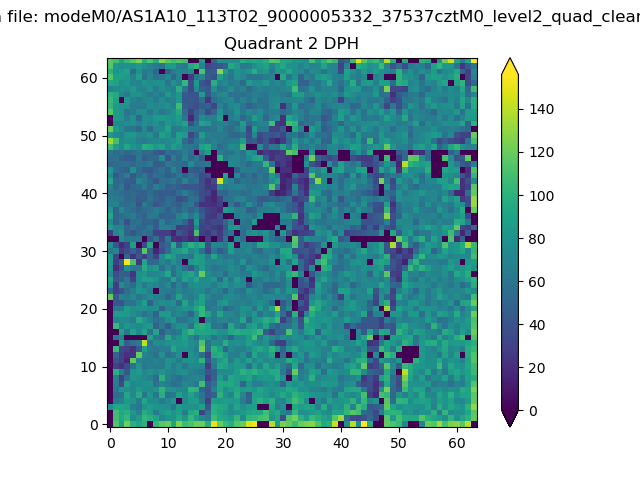
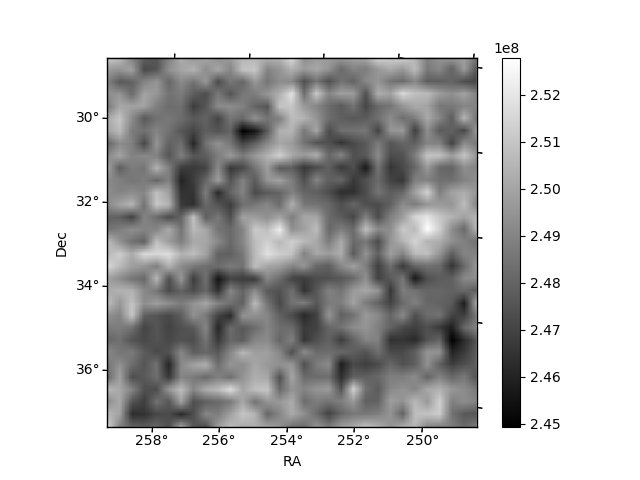
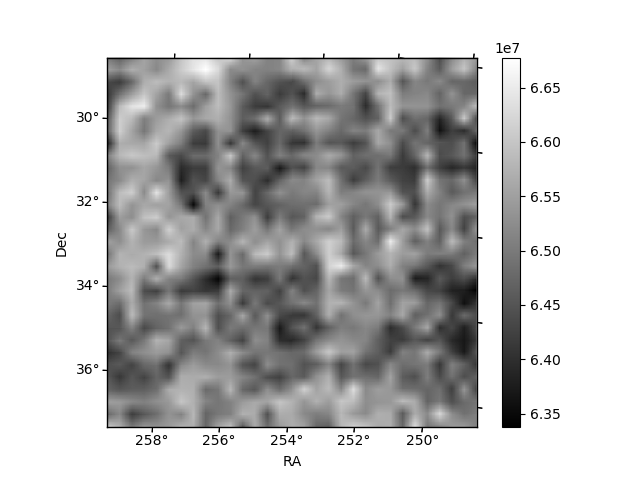
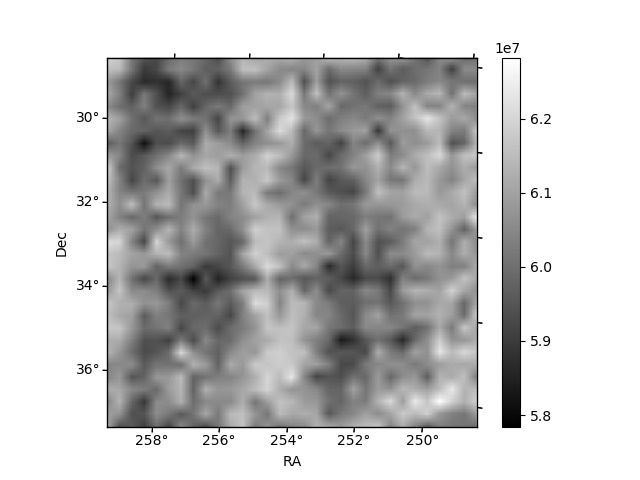
Histogram calculated using DETX and DETY for each event in the final _common_clean file
| Quadrant A | 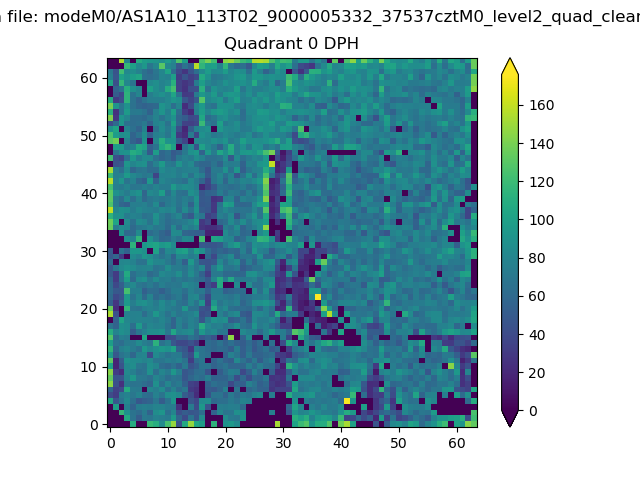 |
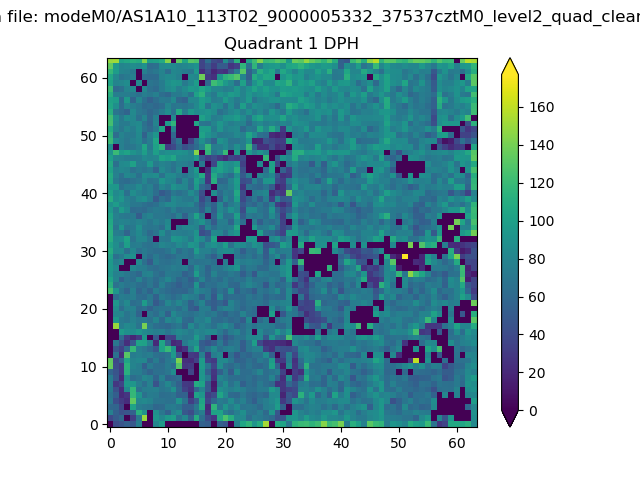 |
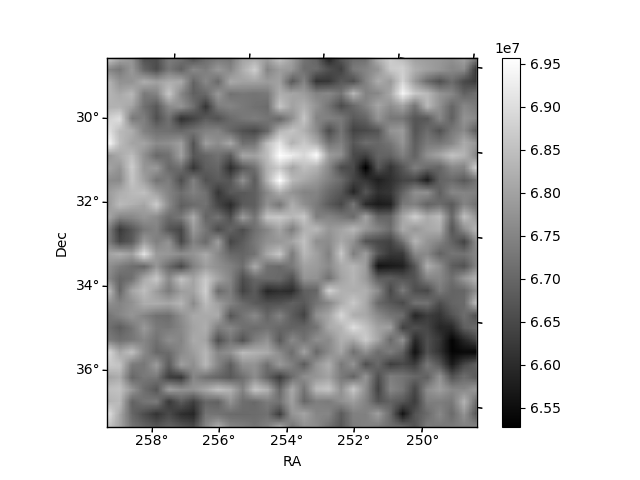
Quadrant B |
|---|---|---|---|
| Quadrant D | 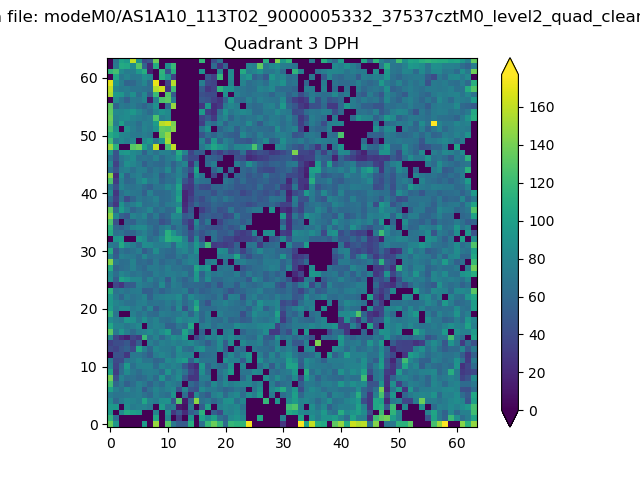 |
 |
Quadrant C |
| Plot type | Count rate plots | Images |
|---|---|---|
| Comparison with Poisson distribution Blue bars denote a histogram of data divided into 1 sec bins. Red curve is a Poisson curve with rate = median count rate of data. |
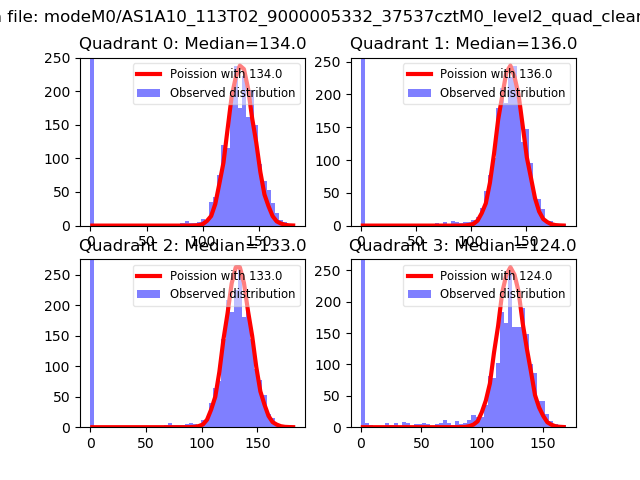 |
 |
| Quadrant-wise count rates Data is divided into 100 sec bins |
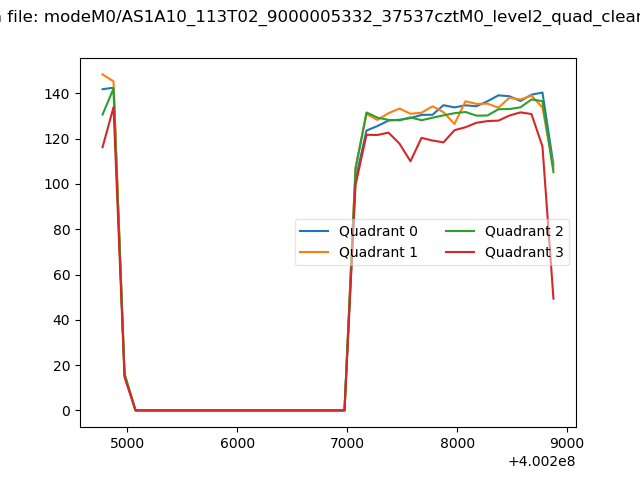 |
|
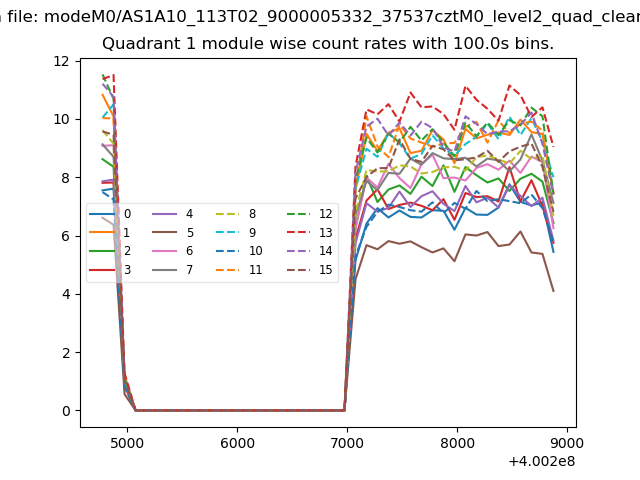
| Module-wise count rates for Quadrant A Data is divided into 100 sec bins |
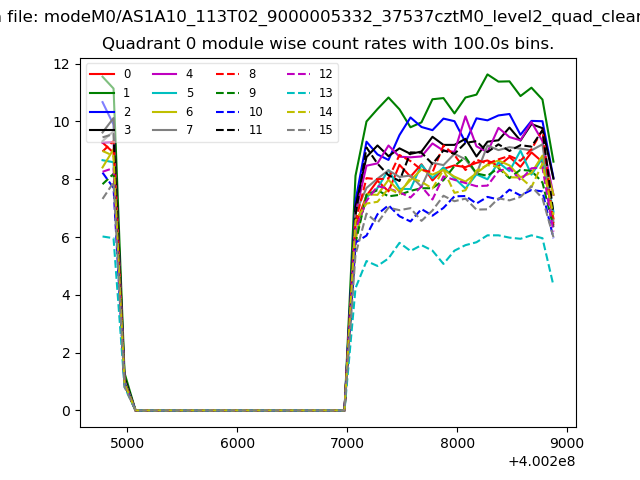 |
 |
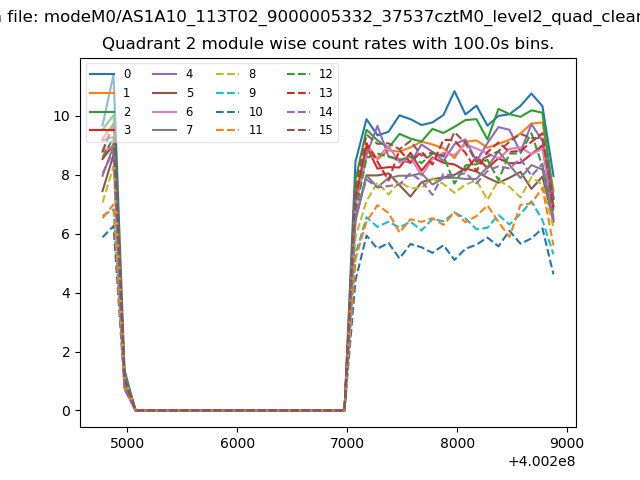
| Module-wise count rates for Quadrant B Data is divided into 100 sec bins |
 |
 |
| Module-wise count rates for Quadrant C Data is divided into 100 sec bins |
 |
 |
| Module-wise count rates for Quadrant D Data is divided into 100 sec bins |
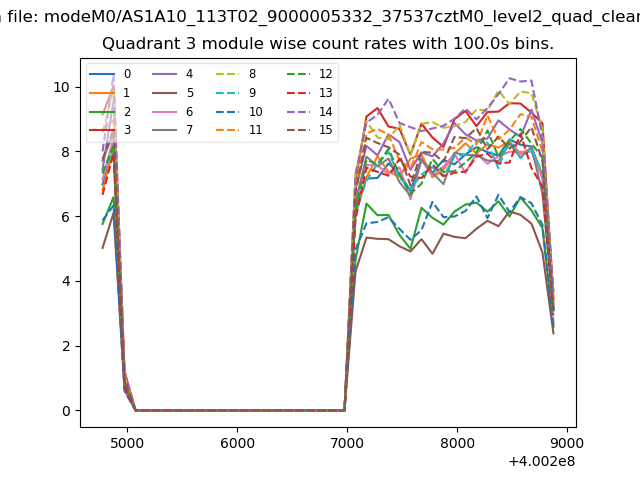 |
 |
| Parameter | Plot |
|---|---|
| CZT HV Monitor | 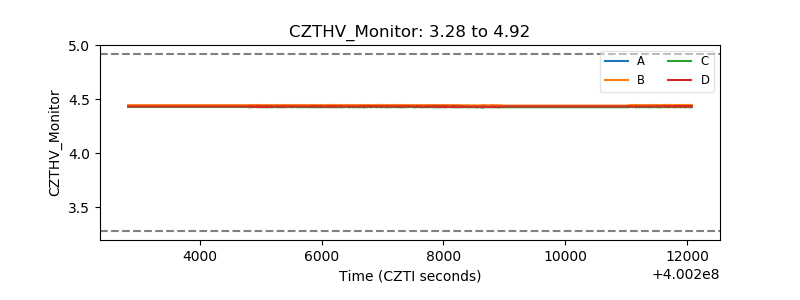 |
| D_VDD | 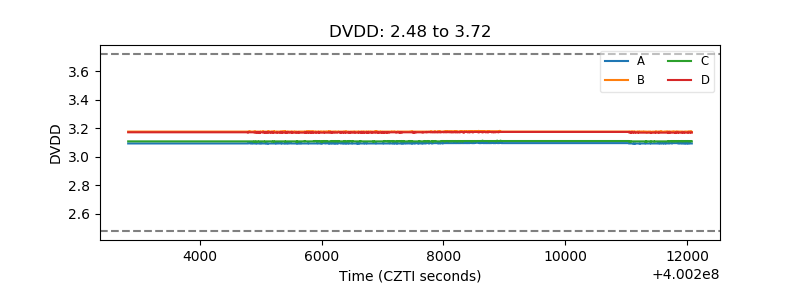 |
| Temperature 1 | 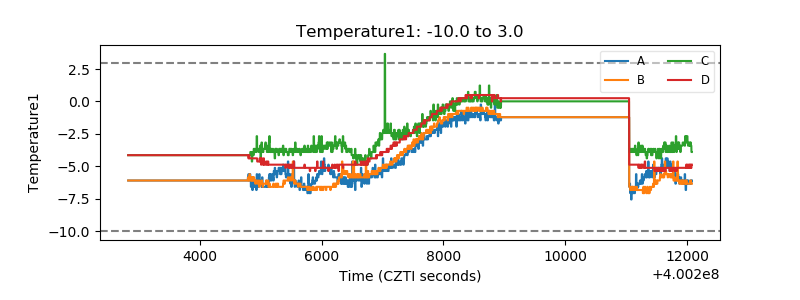 |
| Veto HV Monitor | 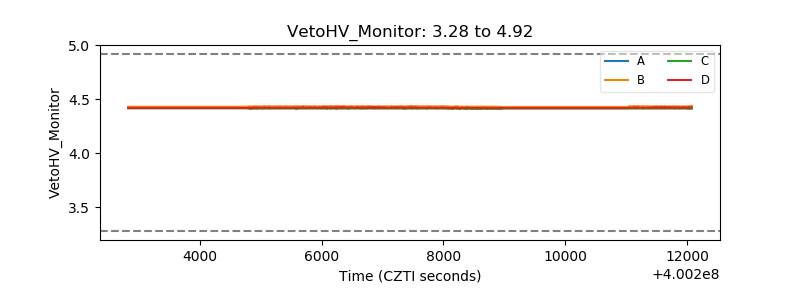 |
| Veto LLD | 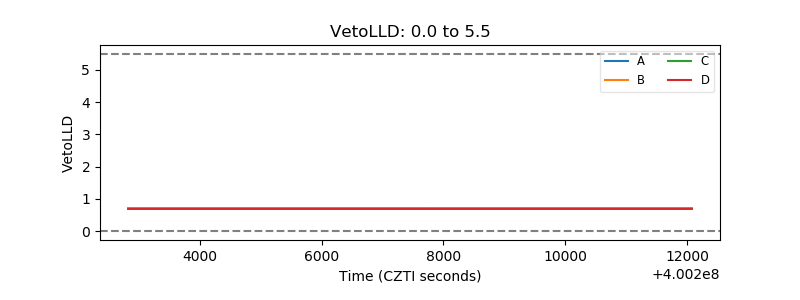 |
| Alpha Counter | 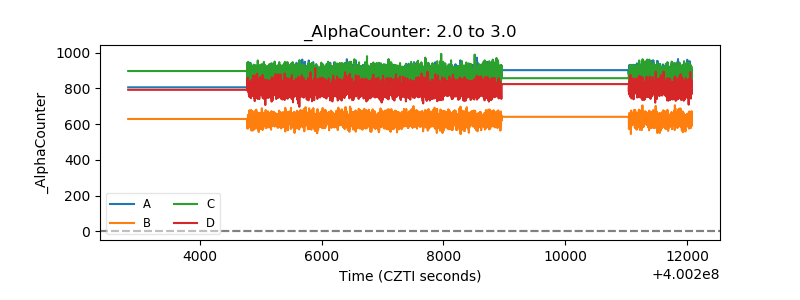 |
| _CPM_Rate | 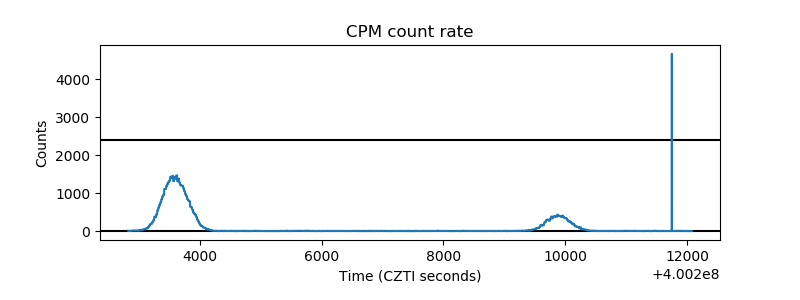 |
| CZT Counter | 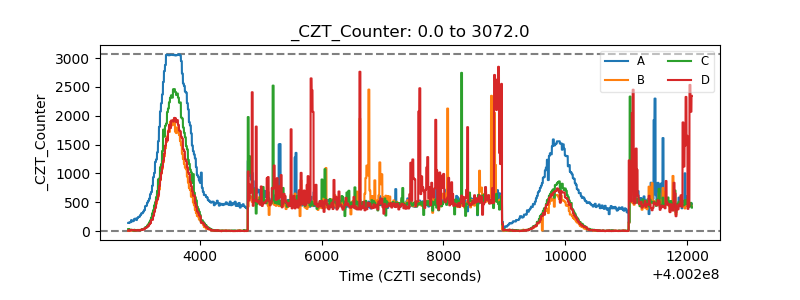 |
| +2.5 Volts monitor | 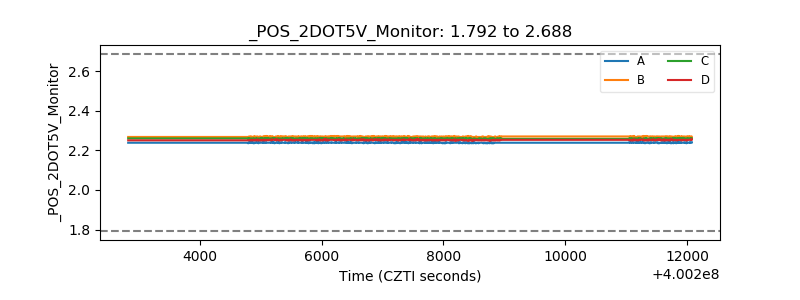 |
| +5 Volts monitor | 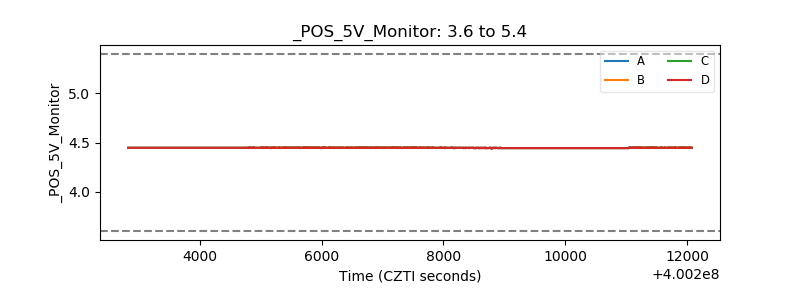 |
| _ROLL_ROT | 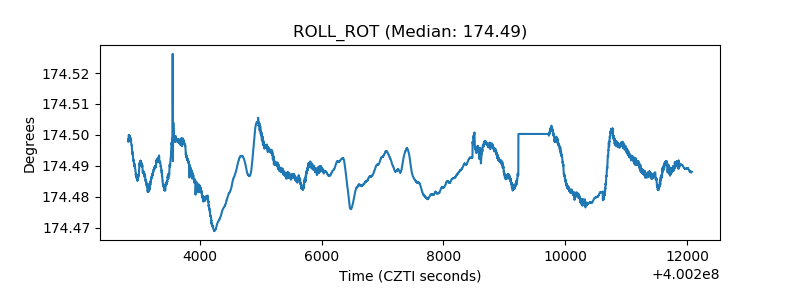 |
| _Roll_DEC | 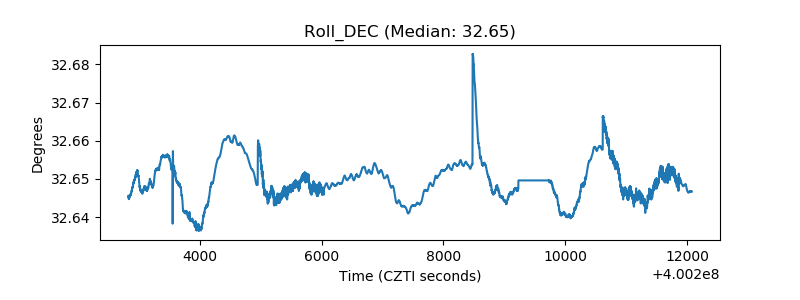 |
| _Roll_RA | 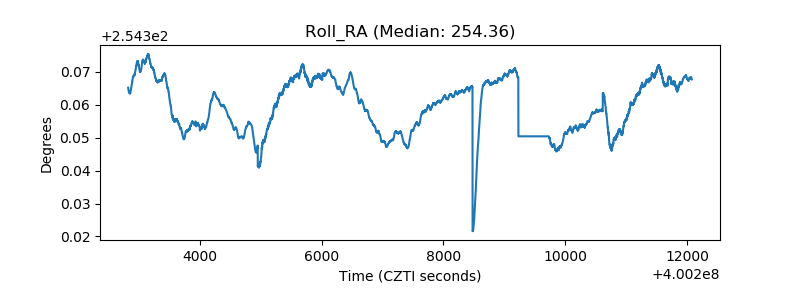 |
| Veto Counter | 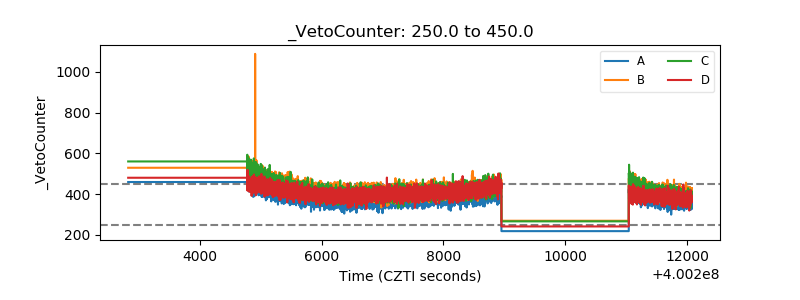 |