| Param | Original file | Final file |
|---|---|---|
| Filename | modeM0/AS1A10_113T02_9000005332_37538cztM0_level2.evt | modeM0/AS1A10_113T02_9000005332_37538cztM0_level2_quad_clean.evt |
| Size (bytes) | 405,495,360 | 54,008,640 |
| Size | 386.7 MB | 51.5 MB |
| Events in quadrant A | 2,929,513 | 322,078 |
| Events in quadrant B | 2,822,595 | 320,697 |
| Events in quadrant C | 2,648,526 | 319,414 |
| Events in quadrant D | 3,522,407 | 304,623 |
| Mode SS | |||
|---|---|---|---|
| Quadrant | BADHDUFLAG | Total packets | Discarded packets |
| A | 0 | 108 | 0 |
| B | 0 | 108 | 0 |
| C | 0 | 108 | 0 |
| D | 0 | 108 | 0 |
| Mode M9 | |||
|---|---|---|---|
| Quadrant | BADHDUFLAG | Total packets | Discarded packets |
| A | 0 | 30 | 0 |
| B | 0 | 30 | 0 |
| C | 0 | 30 | 0 |
| D | 0 | 31 | 0 |
| Mode M0 | |||
|---|---|---|---|
| Quadrant | BADHDUFLAG | Total packets | Discarded packets |
| A | 0 | 11922 | 3 |
| B | 0 | 11778 | 2 |
| C | 0 | 10924 | 2 |
| D | 0 | 13974 | 2 |
| Quadrant | Total seconds | Saturated seconds | Saturation percentage |
|---|---|---|---|
| A | 5254 | 44 | 0.837457% |
| B | 5254 | 54 | 1.027788% |
| C | 5254 | 16 | 0.304530% |
| D | 5254 | 251 | 4.777313% |
Noise dominated data is calculated using 1-second bins in cleaned event files. If a bin has >2000 counts, and if more than 50% of those come from <1% of pixels, then it is considered to be noise-dominated and hence unusable.
| Quadrant | # 1 sec bins | Bins with >0 counts | Bins with >2000 counts | High rate bins dominated by noise | Noise dominated (total time) | Noise dominated (detector-on time) | Marked lightcurve |
|---|---|---|---|---|---|---|---|
| A | 7137 | 5255 | 35 | 35 | 0.49% | 0.67% | 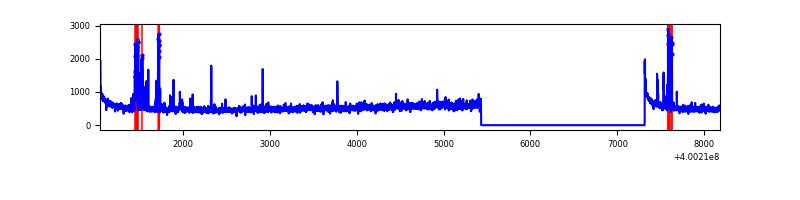 |
| B | 7137 | 5255 | 36 | 36 | 0.50% | 0.69% | 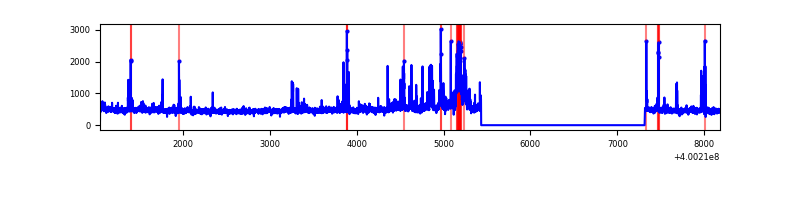 |
| C | 7137 | 5255 | 14 | 14 | 0.20% | 0.27% | 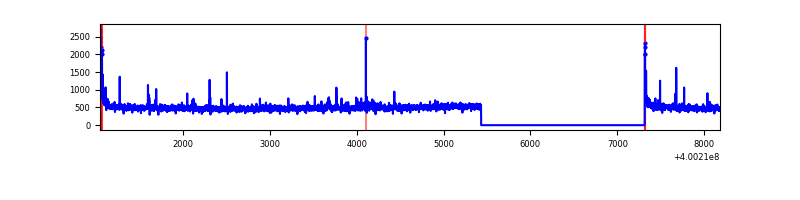 |
| D | 7137 | 5255 | 248 | 248 | 3.47% | 4.72% | 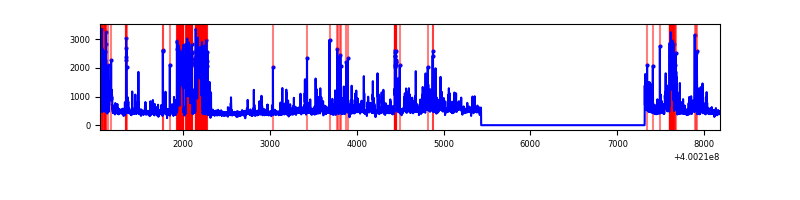 |
Top three noisy pixels from each quadrant. If the there are fewer than three noisy pixels in the level2.evt file, extra rows are filled as -1
| Pixel properties | Quadrant properties | ||||||
|---|---|---|---|---|---|---|---|
| Quadrant | DetID | PixID | Counts | Sigma | Mean | Median | Sigma |
| A | 10 | 83 | 299875 | 2478.15 | 599 | 586 | 120.8 |
| A | 13 | 248 | 111278 | 916.55 | 599 | 586 | 120.8 |
| A | 15 | 222 | 101053 | 831.88 | 599 | 586 | 120.8 |
| B | 5 | 255 | 276972 | 2437.06 | 597 | 581 | 113.4 |
| B | 5 | 172 | 76634 | 670.59 | 597 | 581 | 113.4 |
| B | 0 | 155 | 27296 | 235.56 | 597 | 581 | 113.4 |
| C | 15 | 214 | 231162 | 1683.89 | 587 | 592 | 136.9 |
| C | 0 | 10 | 69524 | 503.42 | 587 | 592 | 136.9 |
| C | 14 | 254 | 37547 | 269.89 | 587 | 592 | 136.9 |
| D | 2 | 249 | 871989 | 6228.84 | 574 | 557 | 139.9 |
| D | 13 | 249 | 82073 | 582.66 | 574 | 557 | 139.9 |
| D | 7 | 38 | 73029 | 518.02 | 574 | 557 | 139.9 |
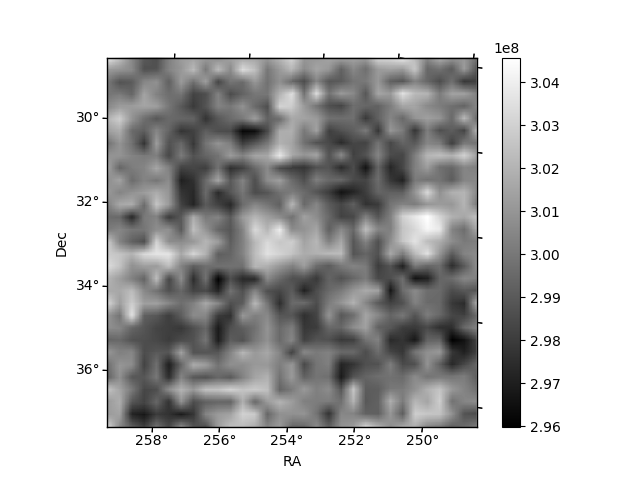
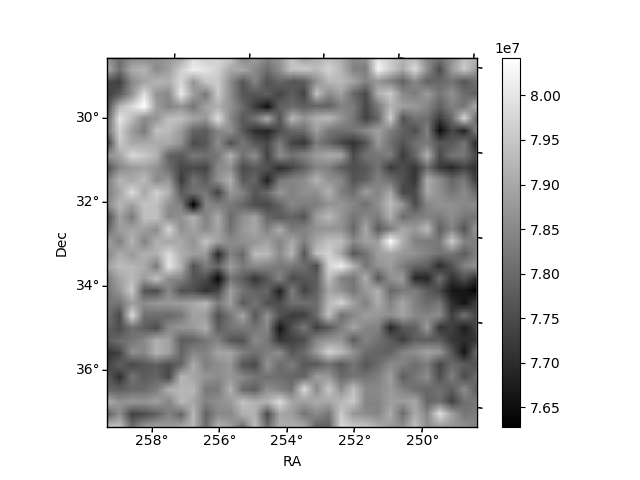
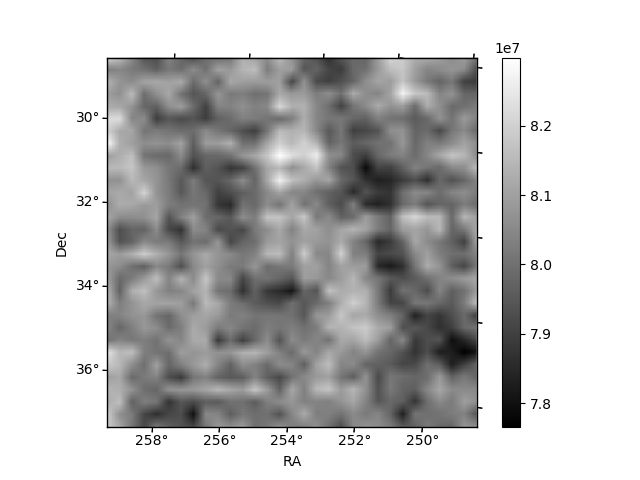
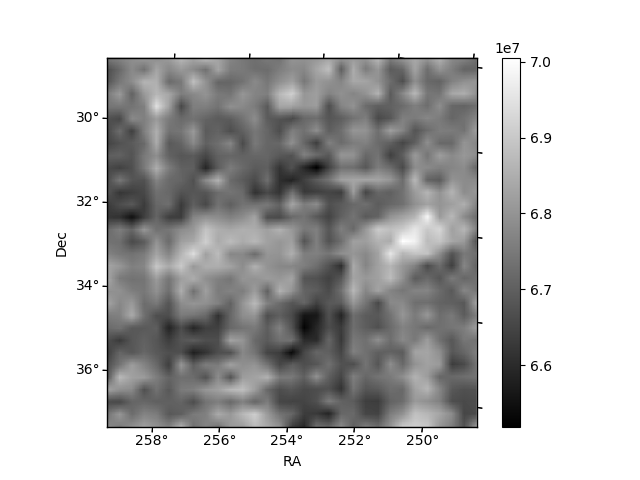
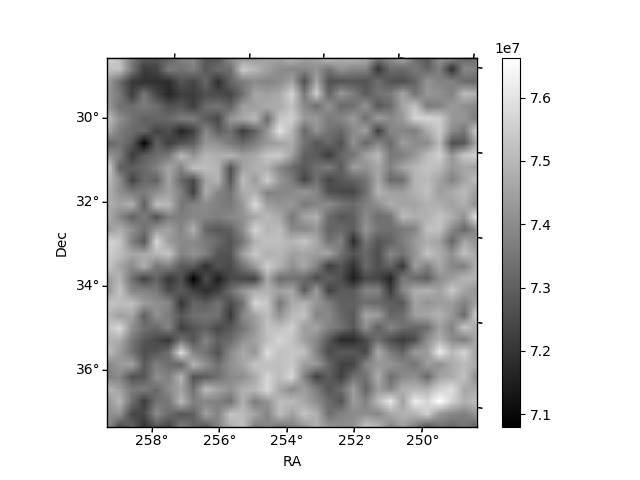
Histogram calculated using DETX and DETY for each event in the final _common_clean file
| Quadrant A | 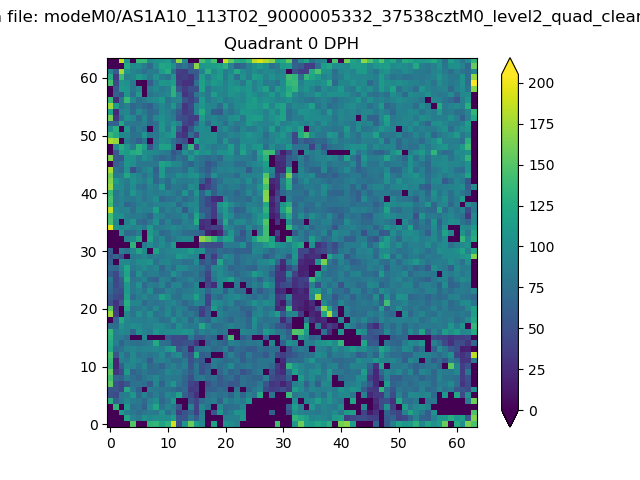 |
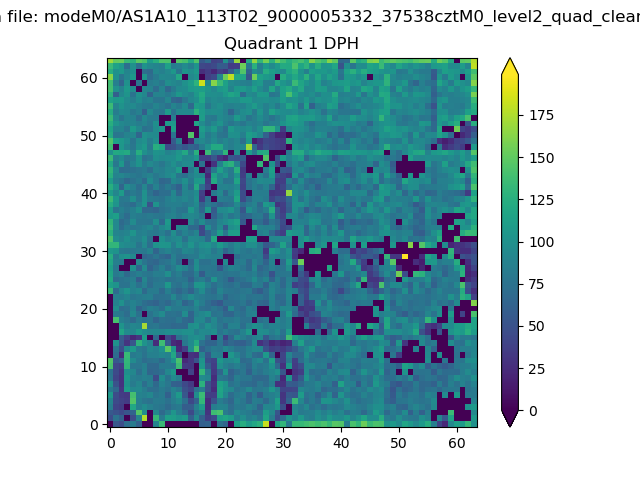 |
Quadrant B |
|---|---|---|---|
| Quadrant D | 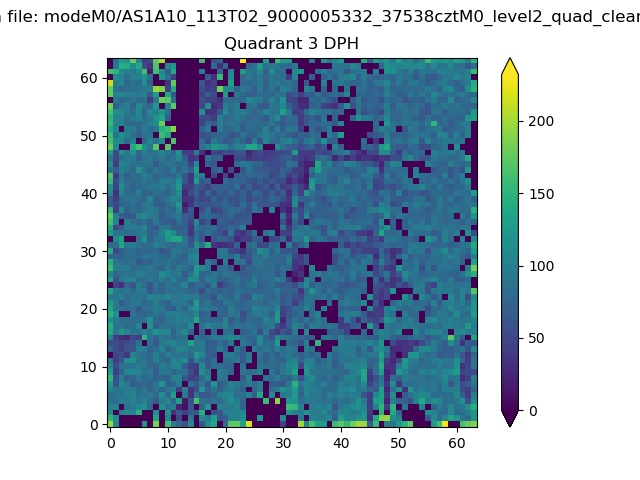 |
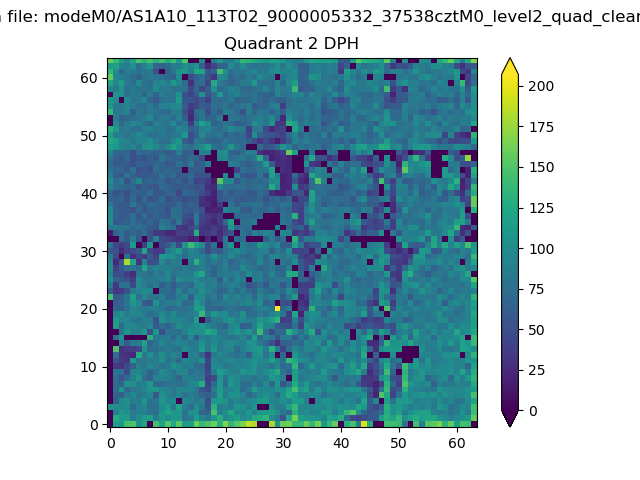 |
Quadrant C |
| Plot type | Count rate plots | Images |
|---|---|---|
| Comparison with Poisson distribution Blue bars denote a histogram of data divided into 1 sec bins. Red curve is a Poisson curve with rate = median count rate of data. |
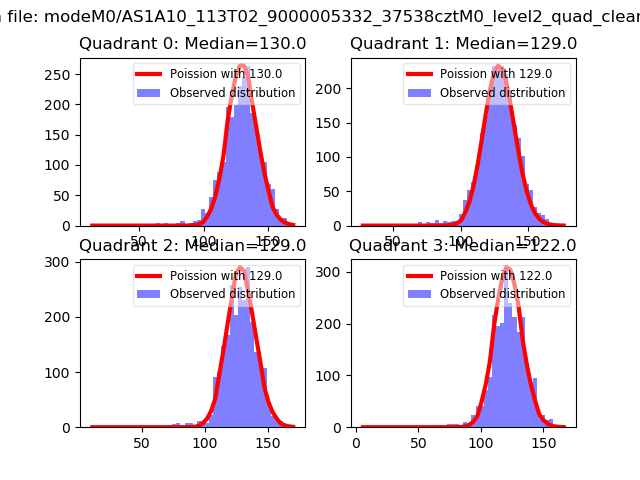 |
 |
| Quadrant-wise count rates Data is divided into 100 sec bins |
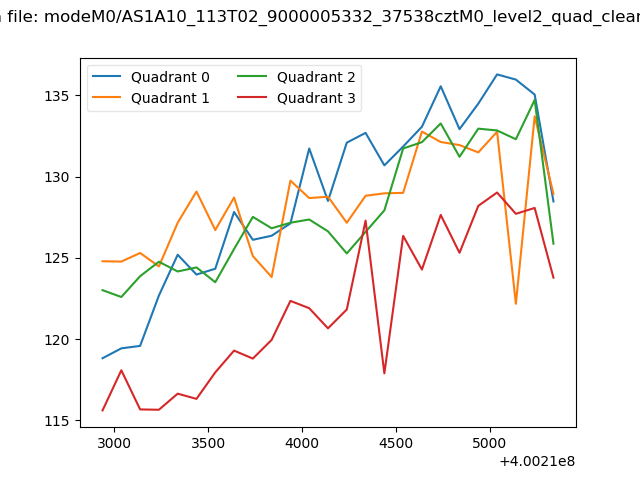 |
|
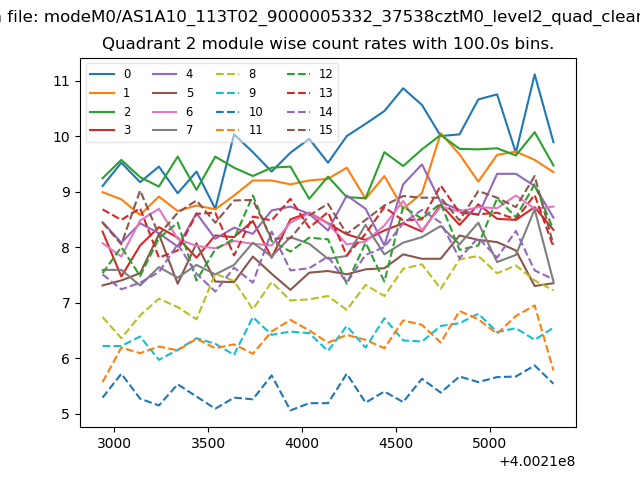
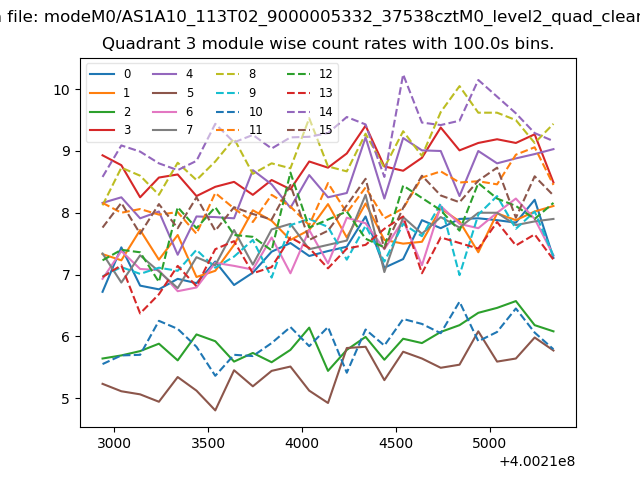
| Module-wise count rates for Quadrant A Data is divided into 100 sec bins |
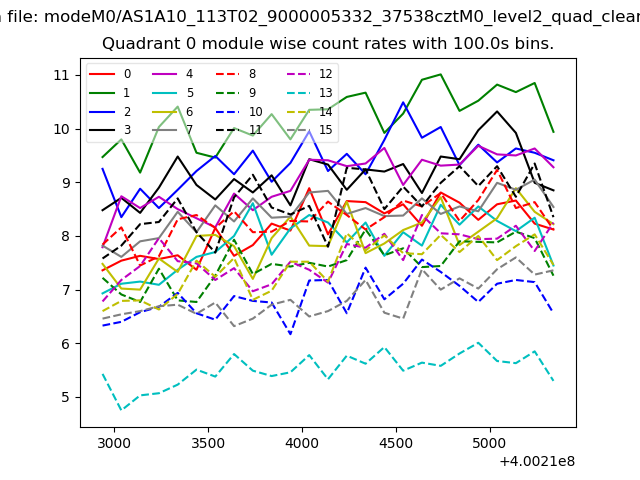 |
 |
| Module-wise count rates for Quadrant B Data is divided into 100 sec bins |
 |
 |
| Module-wise count rates for Quadrant C Data is divided into 100 sec bins |
 |
 |
| Module-wise count rates for Quadrant D Data is divided into 100 sec bins |
 |
 |
| Parameter | Plot |
|---|---|
| CZT HV Monitor | 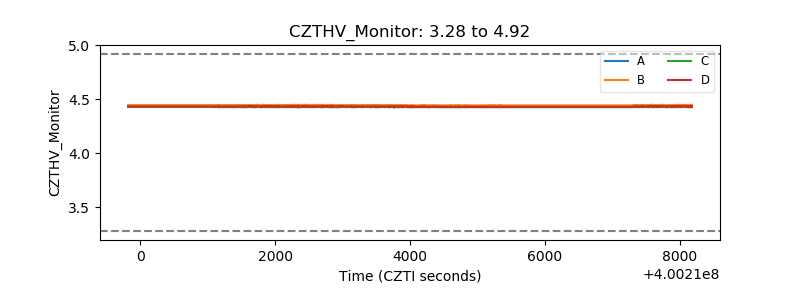 |
| D_VDD | 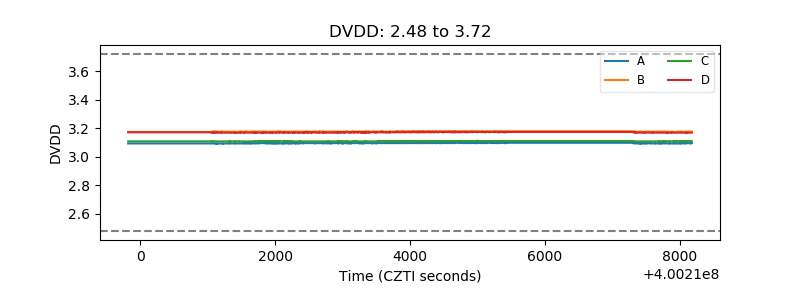 |
| Temperature 1 | 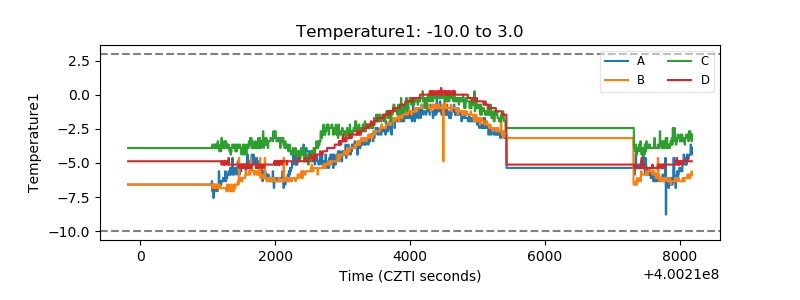 |
| Veto HV Monitor | 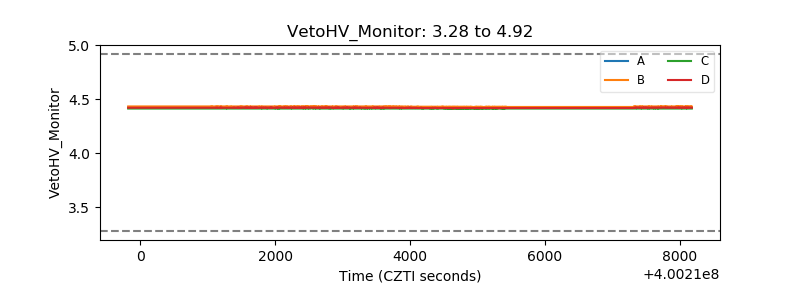 |
| Veto LLD | 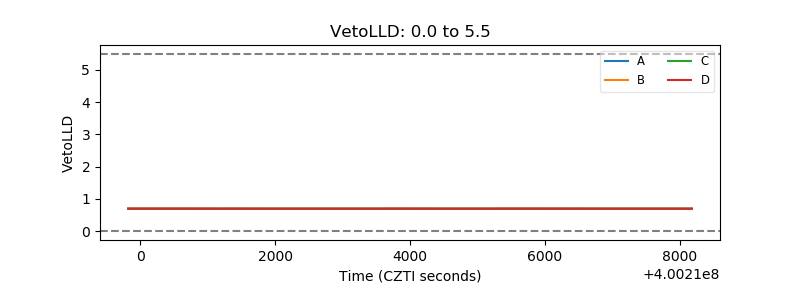 |
| Alpha Counter | 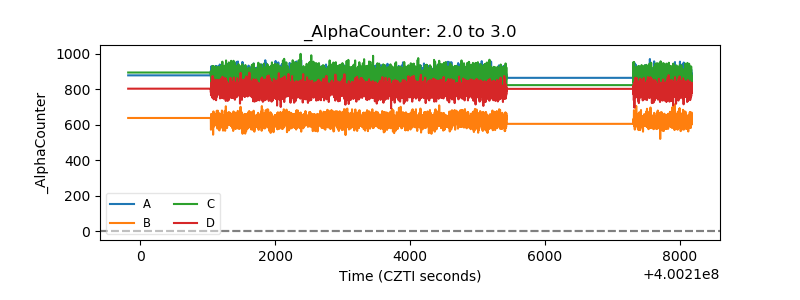 |
| _CPM_Rate | 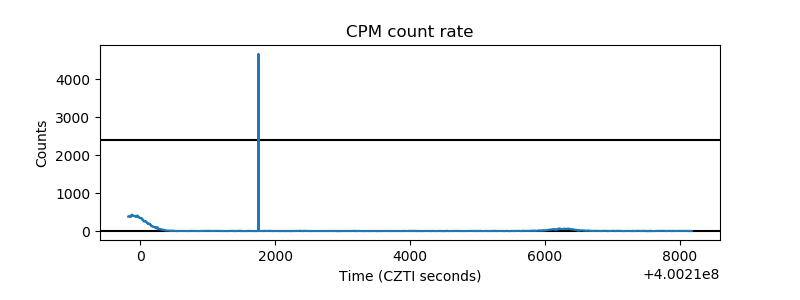 |
| CZT Counter | 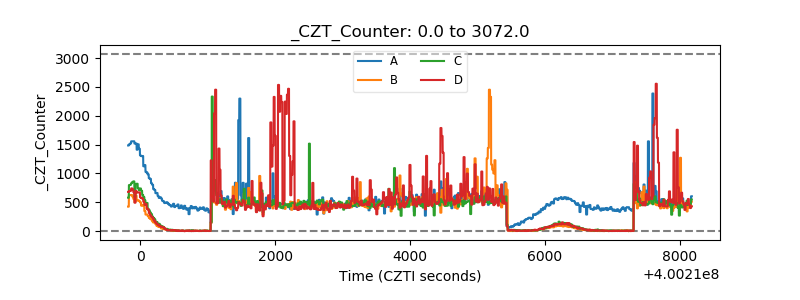 |
| +2.5 Volts monitor | 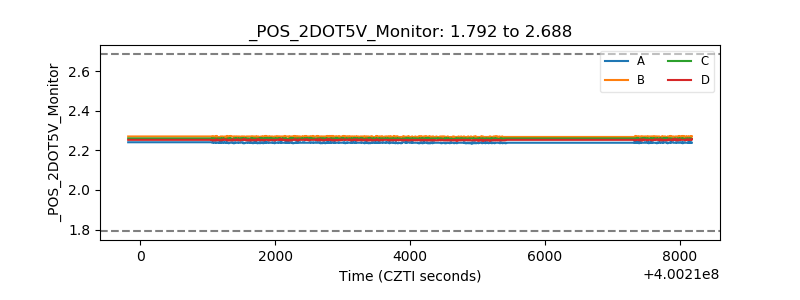 |
| +5 Volts monitor | 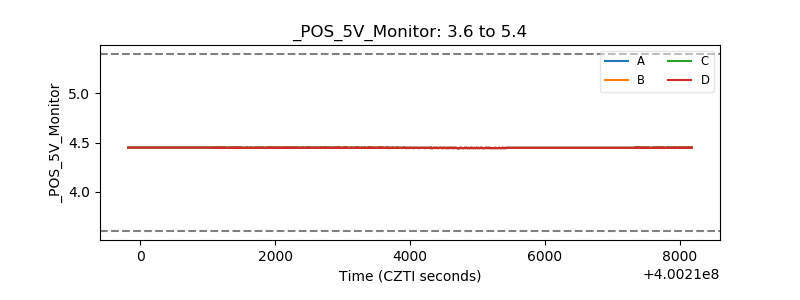 |
| _ROLL_ROT | 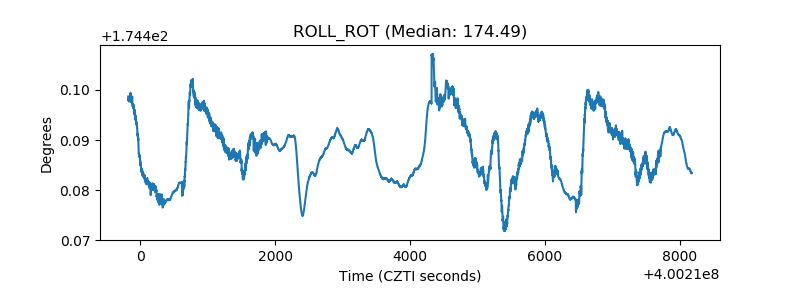 |
| _Roll_DEC | 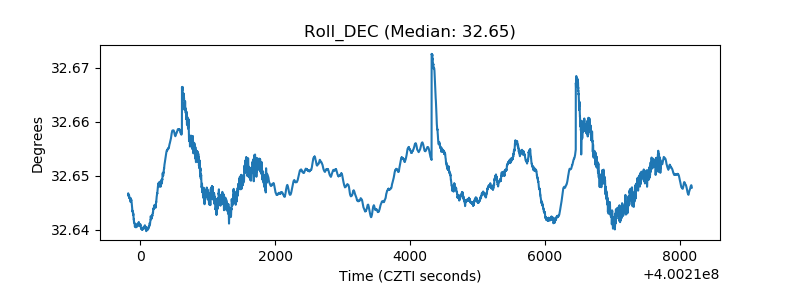 |
| _Roll_RA | 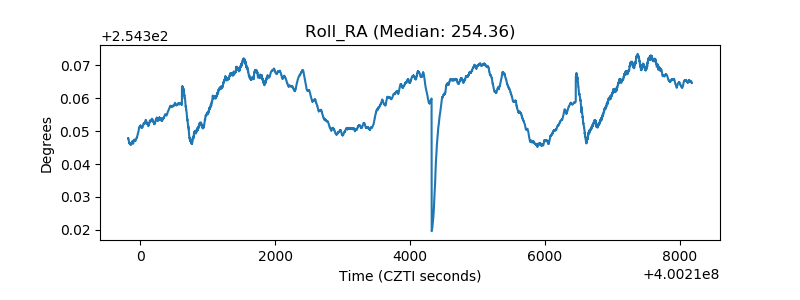 |
| Veto Counter | 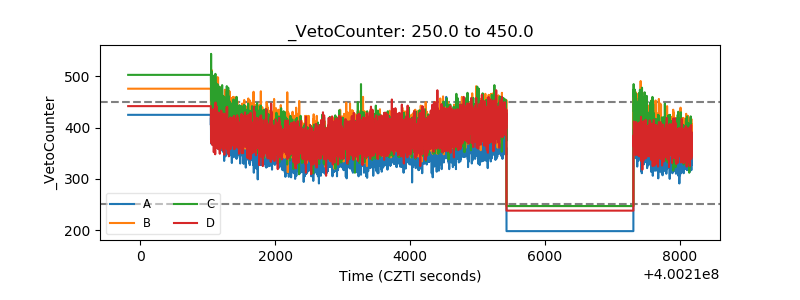 |