| Param | Original file | Final file |
|---|---|---|
| Filename | modeM0/AS1A10_113T02_9000005332_37539cztM0_level2.evt | modeM0/AS1A10_113T02_9000005332_37539cztM0_level2_quad_clean.evt |
| Size (bytes) | 435,614,400 | 67,564,800 |
| Size | 415.4 MB | 64.4 MB |
| Events in quadrant A | 3,428,088 | 420,196 |
| Events in quadrant B | 2,835,794 | 421,389 |
| Events in quadrant C | 2,788,797 | 415,158 |
| Events in quadrant D | 3,754,486 | 392,190 |
| Mode SS | |||
|---|---|---|---|
| Quadrant | BADHDUFLAG | Total packets | Discarded packets |
| A | 0 | 120 | 0 |
| B | 0 | 120 | 0 |
| C | 0 | 120 | 0 |
| D | 0 | 120 | 0 |
| Mode M9 | |||
|---|---|---|---|
| Quadrant | BADHDUFLAG | Total packets | Discarded packets |
| A | 0 | 33 | 0 |
| B | 0 | 33 | 0 |
| C | 0 | 33 | 0 |
| D | 0 | 33 | 0 |
| Mode M0 | |||
|---|---|---|---|
| Quadrant | BADHDUFLAG | Total packets | Discarded packets |
| A | 0 | 13618 | 3 |
| B | 0 | 12002 | 2 |
| C | 0 | 11645 | 2 |
| D | 0 | 15050 | 2 |
| Quadrant | Total seconds | Saturated seconds | Saturation percentage |
|---|---|---|---|
| A | 5664 | 43 | 0.759181% |
| B | 5664 | 38 | 0.670904% |
| C | 5664 | 14 | 0.247175% |
| D | 5664 | 249 | 4.396186% |
Noise dominated data is calculated using 1-second bins in cleaned event files. If a bin has >2000 counts, and if more than 50% of those come from <1% of pixels, then it is considered to be noise-dominated and hence unusable.
| Quadrant | # 1 sec bins | Bins with >0 counts | Bins with >2000 counts | High rate bins dominated by noise | Noise dominated (total time) | Noise dominated (detector-on time) | Marked lightcurve |
|---|---|---|---|---|---|---|---|
| A | 9070 | 5666 | 16 | 16 | 0.18% | 0.28% | 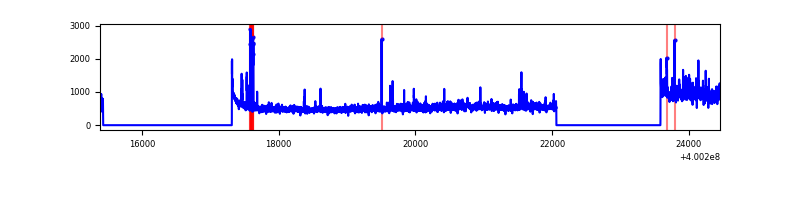 |
| B | 9070 | 5666 | 27 | 27 | 0.30% | 0.48% | 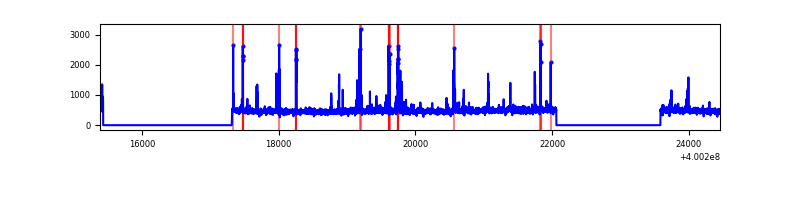 |
| C | 9070 | 5666 | 8 | 8 | 0.09% | 0.14% | 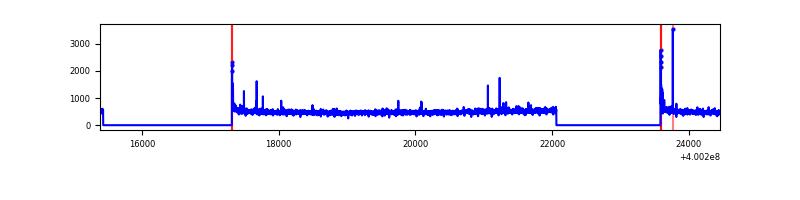 |
| D | 9070 | 5666 | 243 | 243 | 2.68% | 4.29% | 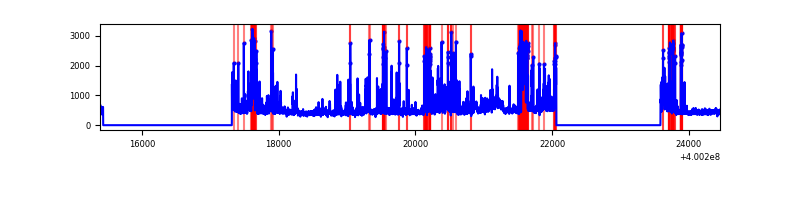 |
Top three noisy pixels from each quadrant. If the there are fewer than three noisy pixels in the level2.evt file, extra rows are filled as -1
| Pixel properties | Quadrant properties | ||||||
|---|---|---|---|---|---|---|---|
| Quadrant | DetID | PixID | Counts | Sigma | Mean | Median | Sigma |
| A | 15 | 222 | 471157 | 3625.86 | 644 | 631 | 129.8 |
| A | 10 | 83 | 319884 | 2460.15 | 644 | 631 | 129.8 |
| A | 12 | 189 | 39388 | 298.66 | 644 | 631 | 129.8 |
| B | 5 | 172 | 93062 | 743.13 | 642 | 625 | 124.4 |
| B | 5 | 255 | 61537 | 489.69 | 642 | 625 | 124.4 |
| B | 0 | 219 | 33587 | 264.99 | 642 | 625 | 124.4 |
| C | 15 | 214 | 245929 | 1651.15 | 630 | 633 | 148.6 |
| C | 0 | 10 | 48730 | 323.75 | 630 | 633 | 148.6 |
| C | 14 | 254 | 16609 | 107.54 | 630 | 633 | 148.6 |
| D | 2 | 249 | 314558 | 2072.19 | 619 | 602 | 151.5 |
| D | 12 | 233 | 268288 | 1766.8 | 619 | 602 | 151.5 |
| D | 10 | 253 | 194515 | 1279.88 | 619 | 602 | 151.5 |
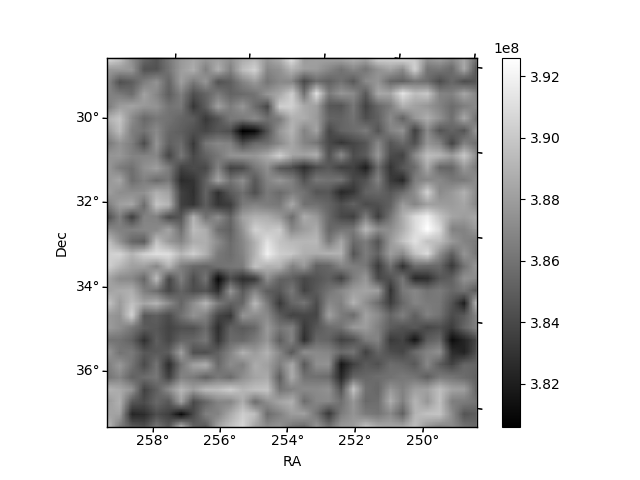
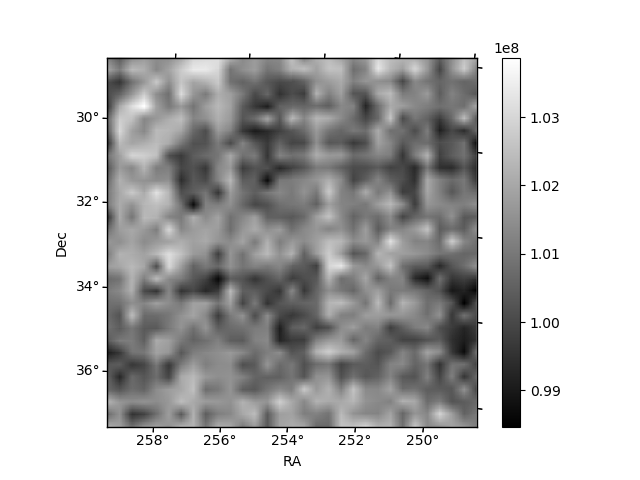
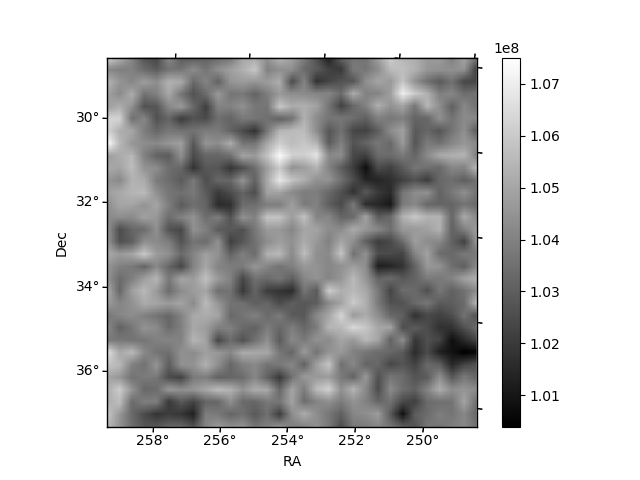
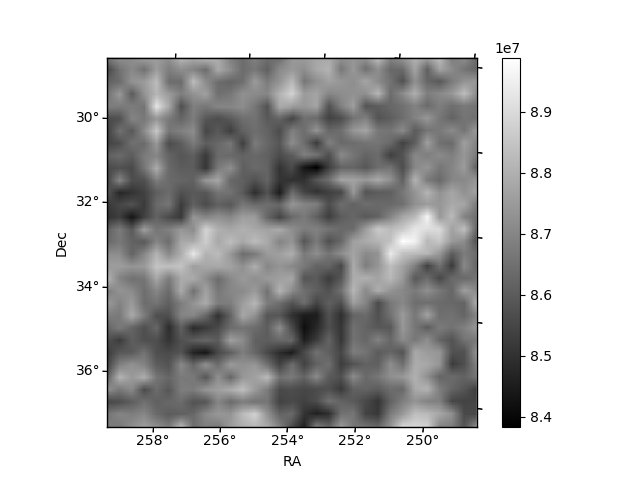
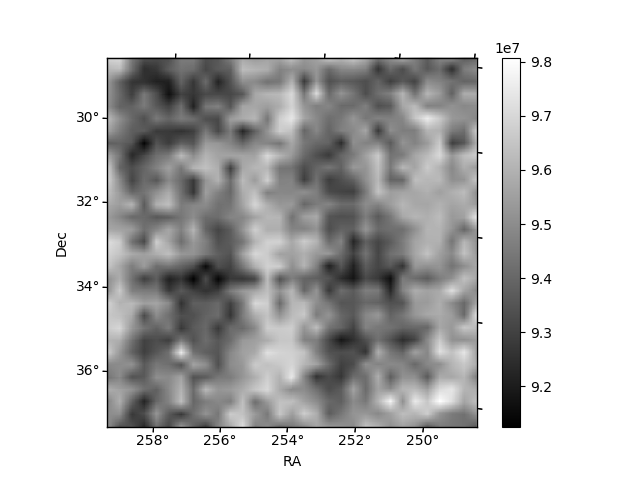
Histogram calculated using DETX and DETY for each event in the final _common_clean file
| Quadrant A | 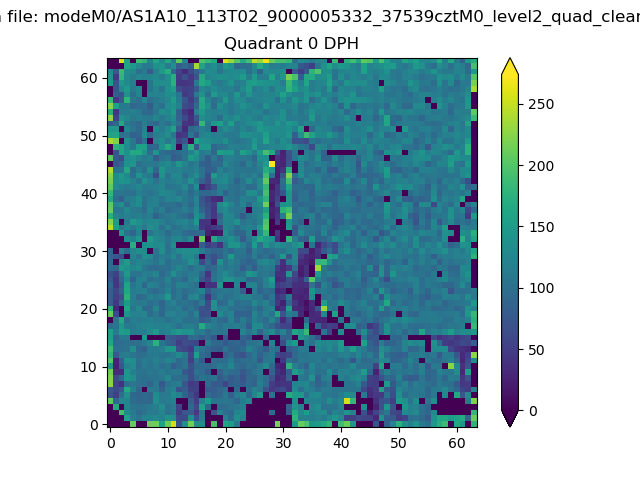 |
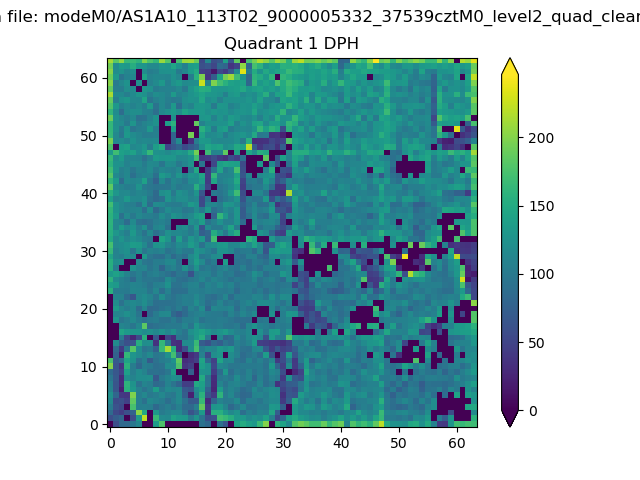 |
Quadrant B |
|---|---|---|---|
| Quadrant D | 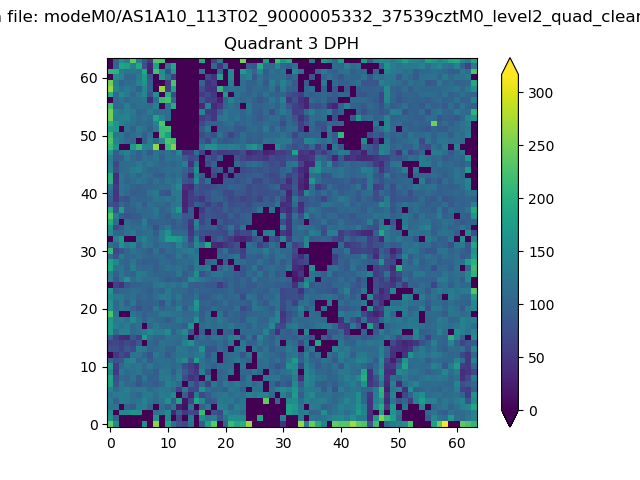 |
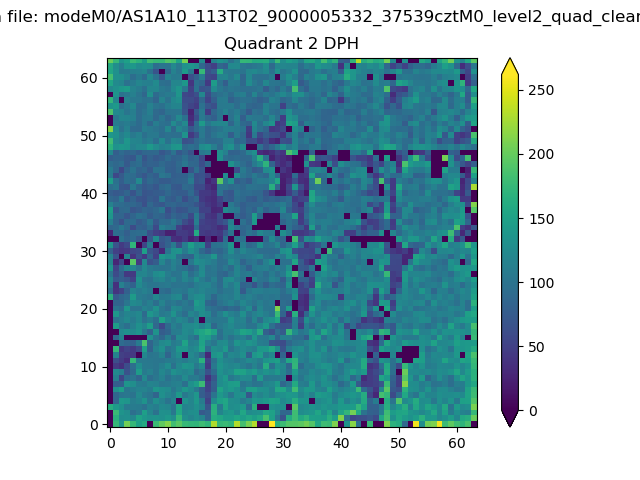 |
Quadrant C |
| Plot type | Count rate plots | Images |
|---|---|---|
| Comparison with Poisson distribution Blue bars denote a histogram of data divided into 1 sec bins. Red curve is a Poisson curve with rate = median count rate of data. |
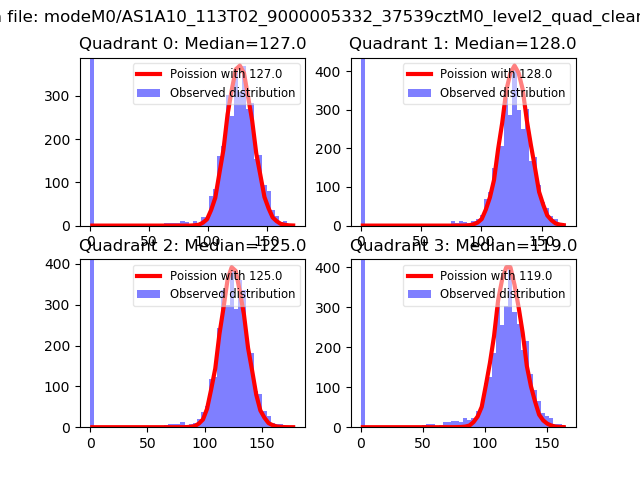 |
 |
| Quadrant-wise count rates Data is divided into 100 sec bins |
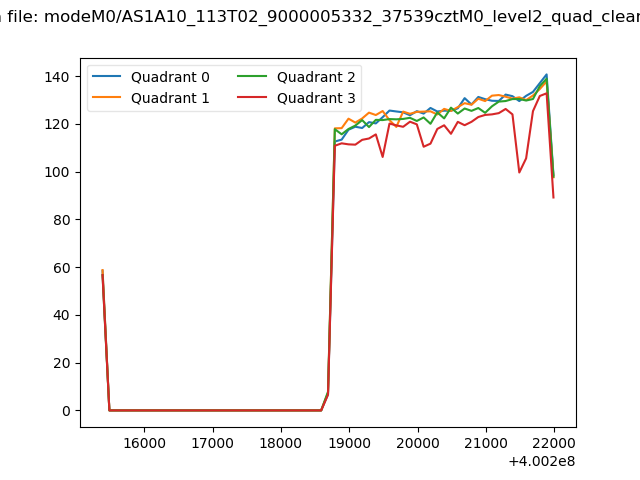 |
|
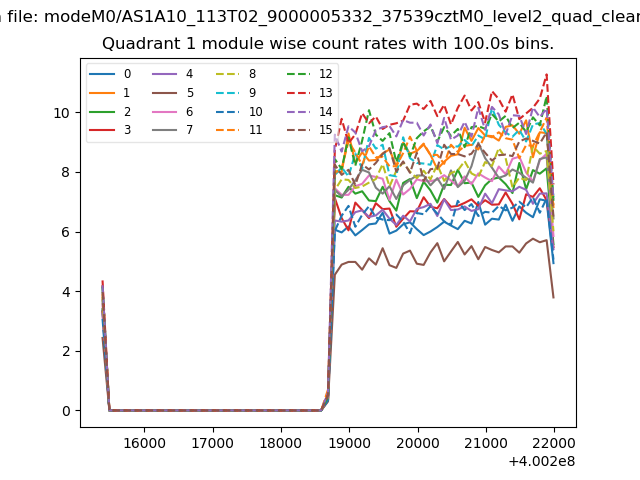
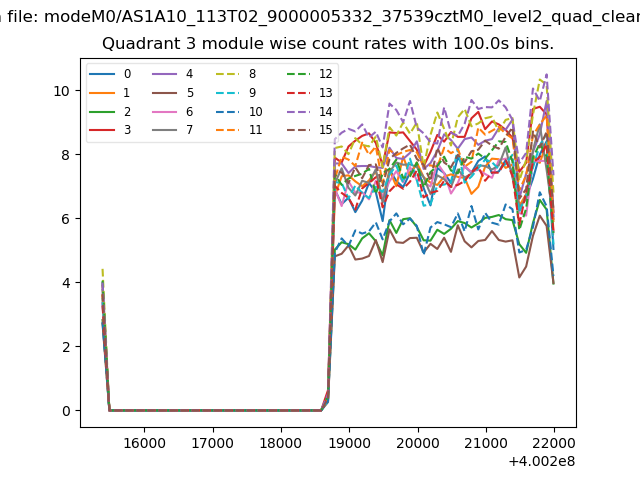
| Module-wise count rates for Quadrant A Data is divided into 100 sec bins |
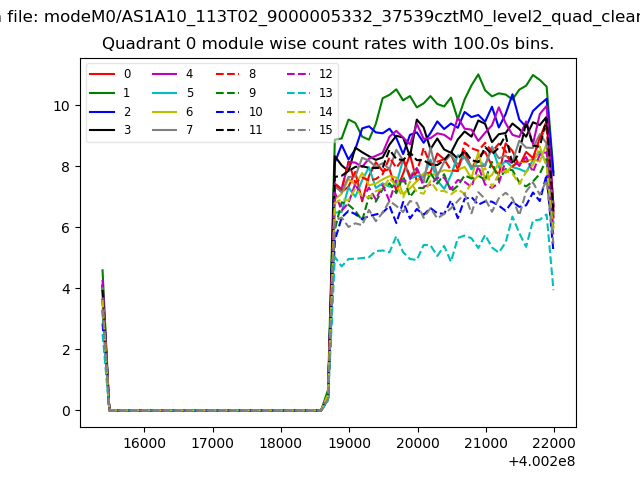 |
 |
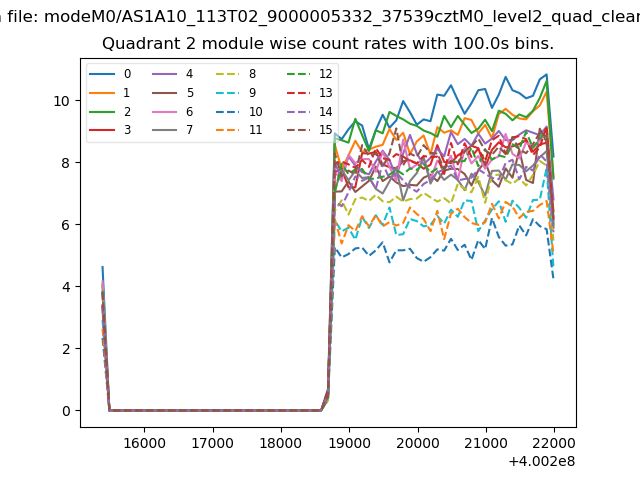
| Module-wise count rates for Quadrant B Data is divided into 100 sec bins |
 |
 |
| Module-wise count rates for Quadrant C Data is divided into 100 sec bins |
 |
 |
| Module-wise count rates for Quadrant D Data is divided into 100 sec bins |
 |
 |
| Parameter | Plot |
|---|---|
| CZT HV Monitor | 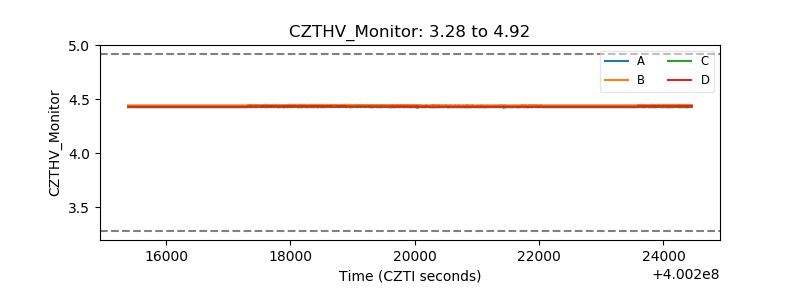 |
| D_VDD | 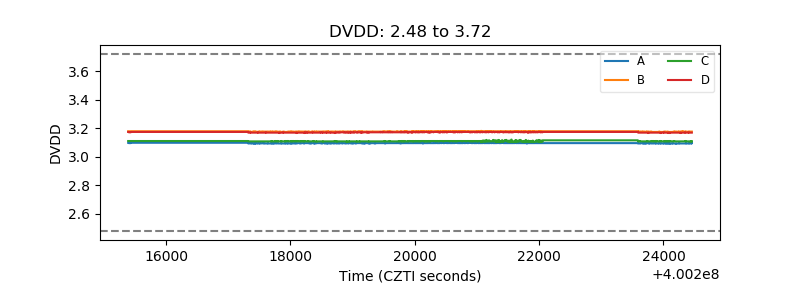 |
| Temperature 1 | 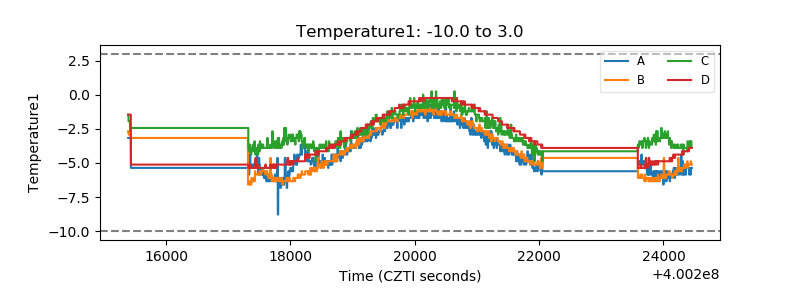 |
| Veto HV Monitor | 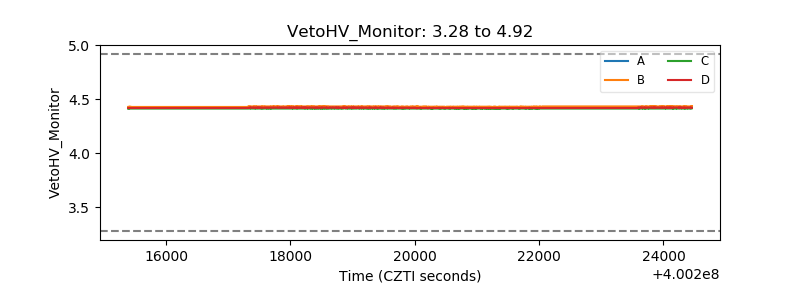 |
| Veto LLD | 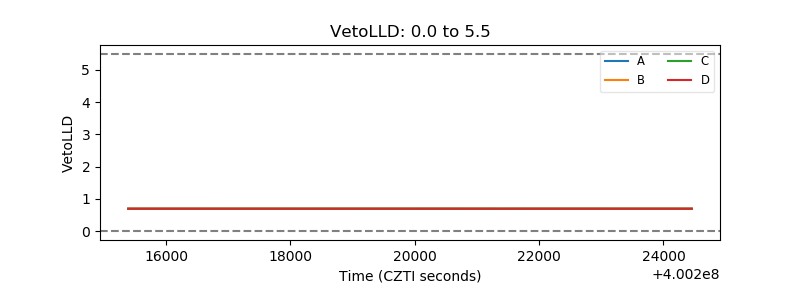 |
| Alpha Counter | 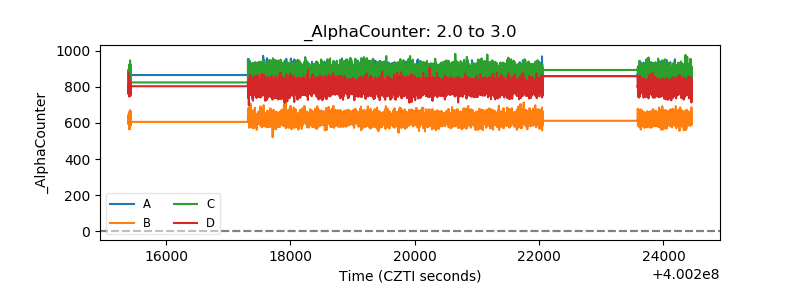 |
| _CPM_Rate | 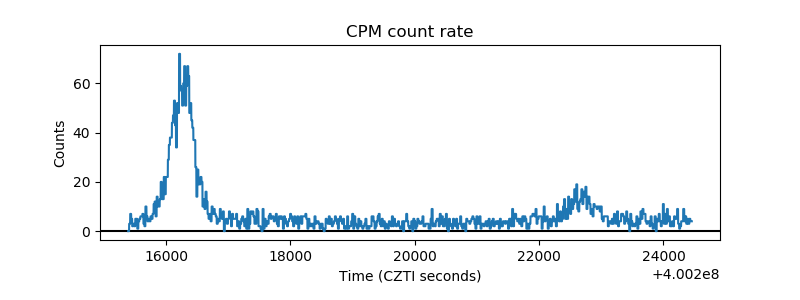 |
| CZT Counter | 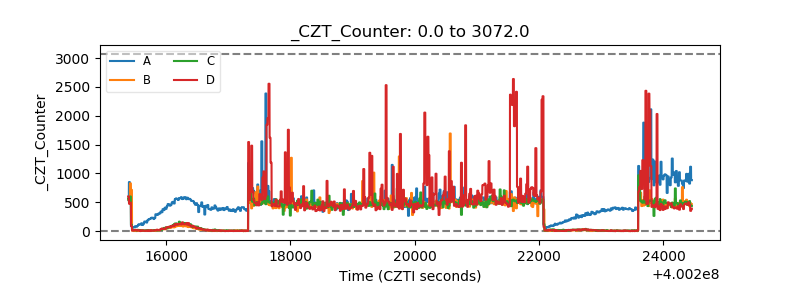 |
| +2.5 Volts monitor | 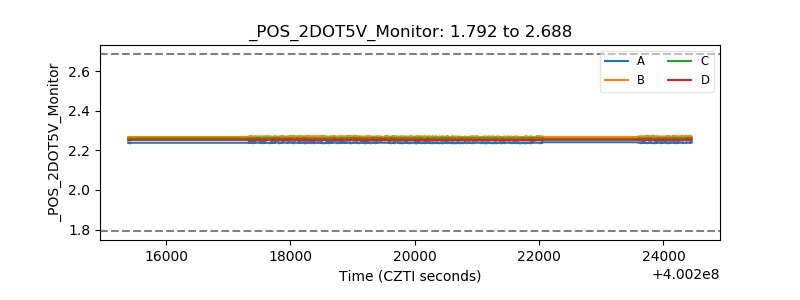 |
| +5 Volts monitor | 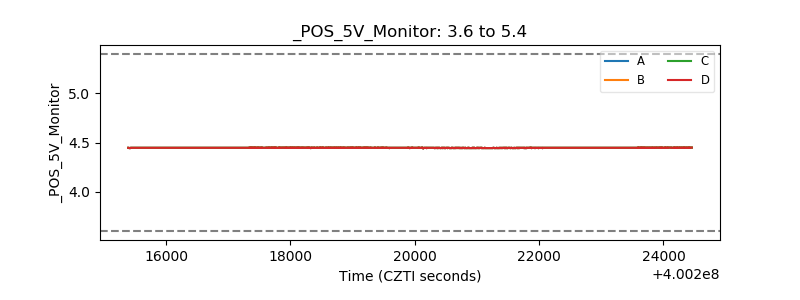 |
| _ROLL_ROT | 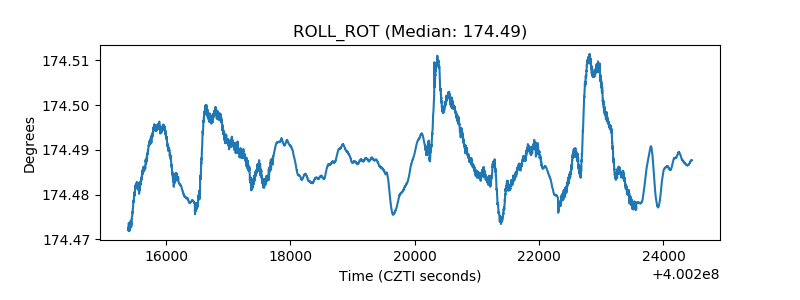 |
| _Roll_DEC | 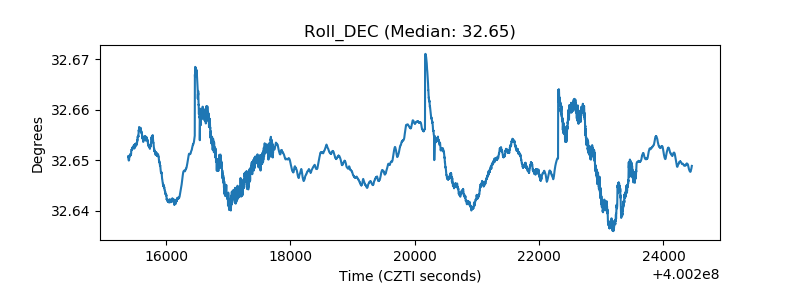 |
| _Roll_RA |  |
| Veto Counter | 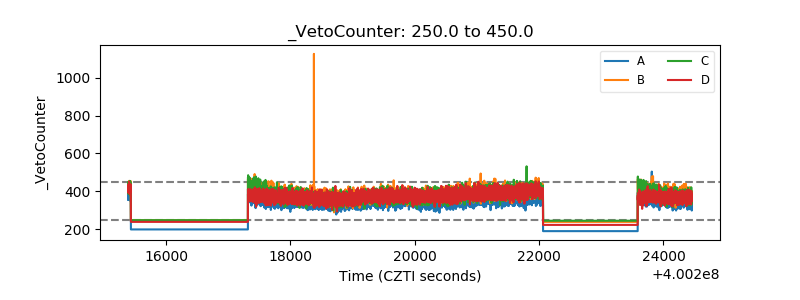 |