| Param | Original file | Final file |
|---|---|---|
| Filename | modeM0/AS1A10_113T02_9000005332_37540cztM0_level2.evt | modeM0/AS1A10_113T02_9000005332_37540cztM0_level2_quad_clean.evt |
| Size (bytes) | 690,315,840 | 83,986,560 |
| Size | 658.3 MB | 80.1 MB |
| Events in quadrant A | 5,706,697 | 560,858 |
| Events in quadrant B | 3,509,193 | 563,809 |
| Events in quadrant C | 3,176,193 | 568,247 |
| Events in quadrant D | 8,083,679 | 404,730 |
| Mode SS | |||
|---|---|---|---|
| Quadrant | BADHDUFLAG | Total packets | Discarded packets |
| A | 0 | 130 | 0 |
| B | 0 | 130 | 0 |
| C | 0 | 130 | 0 |
| D | 0 | 130 | 0 |
| Mode M9 | |||
|---|---|---|---|
| Quadrant | BADHDUFLAG | Total packets | Discarded packets |
| A | 0 | 29 | 0 |
| B | 0 | 29 | 0 |
| C | 0 | 29 | 0 |
| D | 0 | 29 | 0 |
| Mode M0 | |||
|---|---|---|---|
| Quadrant | BADHDUFLAG | Total packets | Discarded packets |
| A | 0 | 21332 | 3 |
| B | 0 | 14419 | 2 |
| C | 0 | 13167 | 2 |
| D | 0 | 28244 | 2 |
| Quadrant | Total seconds | Saturated seconds | Saturation percentage |
|---|---|---|---|
| A | 6378 | 115 | 1.803073% |
| B | 6378 | 153 | 2.398871% |
| C | 6378 | 14 | 0.219505% |
| D | 6378 | 1756 | 27.532142% |
Noise dominated data is calculated using 1-second bins in cleaned event files. If a bin has >2000 counts, and if more than 50% of those come from <1% of pixels, then it is considered to be noise-dominated and hence unusable.
| Quadrant | # 1 sec bins | Bins with >0 counts | Bins with >2000 counts | High rate bins dominated by noise | Noise dominated (total time) | Noise dominated (detector-on time) | Marked lightcurve |
|---|---|---|---|---|---|---|---|
| A | 9245 | 6380 | 67 | 67 | 0.72% | 1.05% | 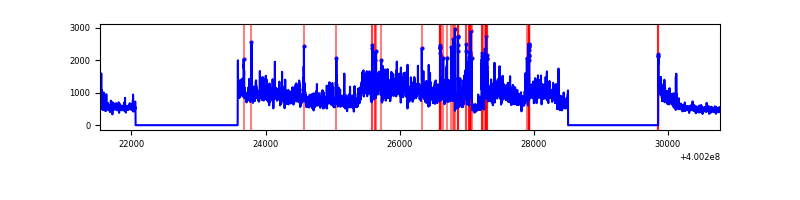 |
| B | 9245 | 6380 | 120 | 120 | 1.30% | 1.88% | 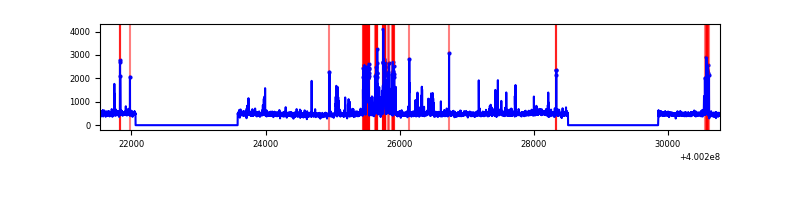 |
| C | 9245 | 6380 | 10 | 10 | 0.11% | 0.16% | 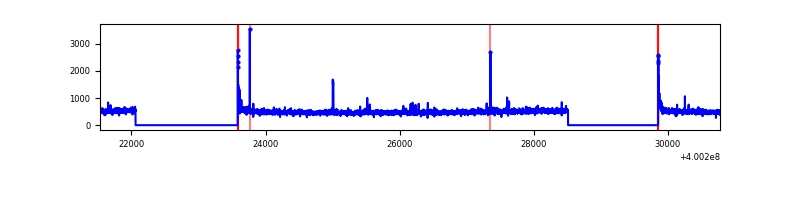 |
| D | 9245 | 6380 | 1800 | 1800 | 19.47% | 28.21% | 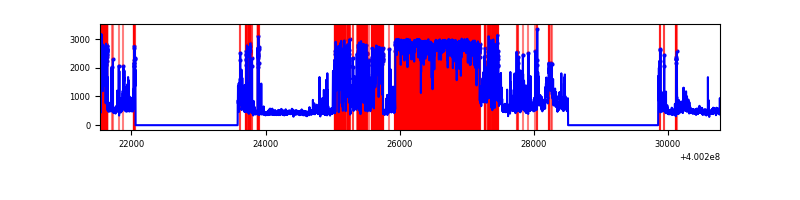 |
Top three noisy pixels from each quadrant. If the there are fewer than three noisy pixels in the level2.evt file, extra rows are filled as -1
| Pixel properties | Quadrant properties | ||||||
|---|---|---|---|---|---|---|---|
| Quadrant | DetID | PixID | Counts | Sigma | Mean | Median | Sigma |
| A | 15 | 222 | 2486359 | 16811.86 | 728 | 714 | 147.9 |
| A | 10 | 83 | 341291 | 2303.52 | 728 | 714 | 147.9 |
| A | 12 | 189 | 20526 | 134.0 | 728 | 714 | 147.9 |
| B | 5 | 172 | 266346 | 1912.24 | 720 | 700 | 138.9 |
| B | 5 | 255 | 119043 | 851.89 | 720 | 700 | 138.9 |
| B | 5 | 184 | 103950 | 743.24 | 720 | 700 | 138.9 |
| C | 15 | 214 | 275174 | 1626.9 | 715 | 721 | 168.7 |
| C | 0 | 10 | 54426 | 318.35 | 715 | 721 | 168.7 |
| C | 14 | 254 | 18441 | 105.04 | 715 | 721 | 168.7 |
| D | 12 | 227 | 4619505 | 31075.21 | 603 | 588 | 148.6 |
| D | 12 | 233 | 353479 | 2374.18 | 603 | 588 | 148.6 |
| D | 10 | 199 | 176037 | 1180.39 | 603 | 588 | 148.6 |
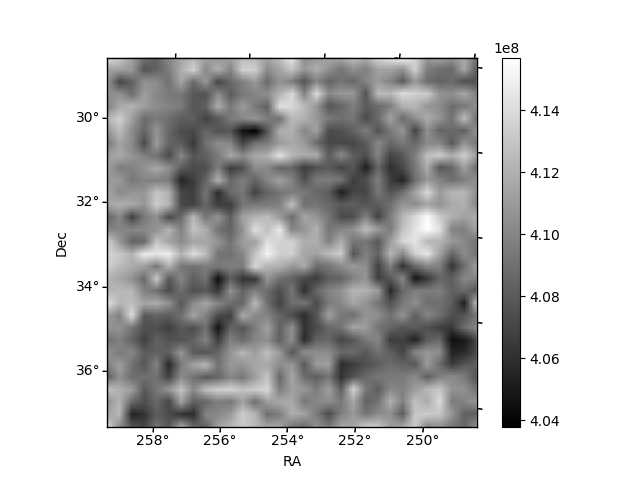
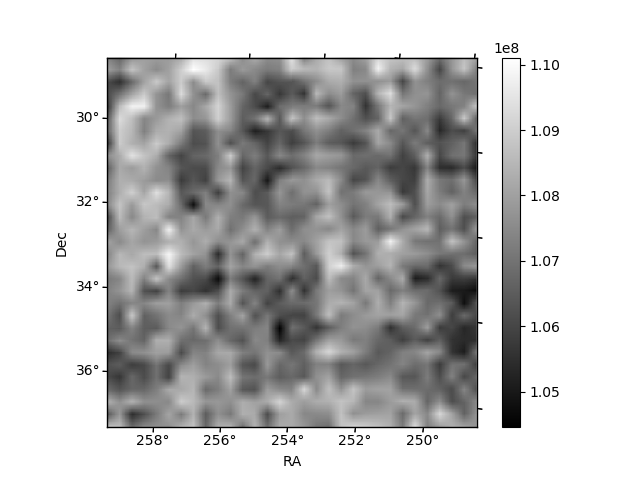
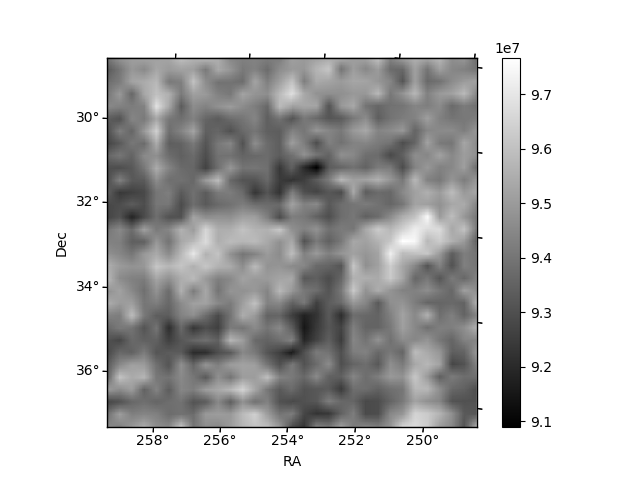
Histogram calculated using DETX and DETY for each event in the final _common_clean file
| Quadrant A | 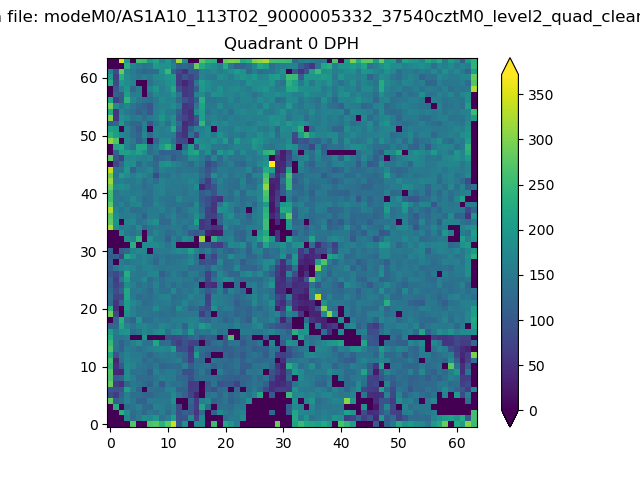 |
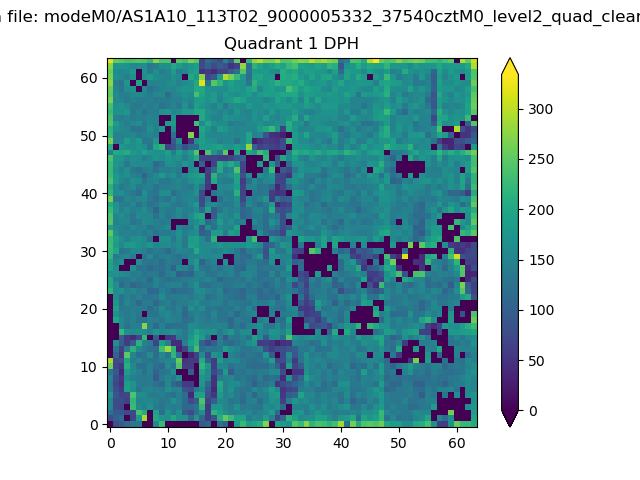 |
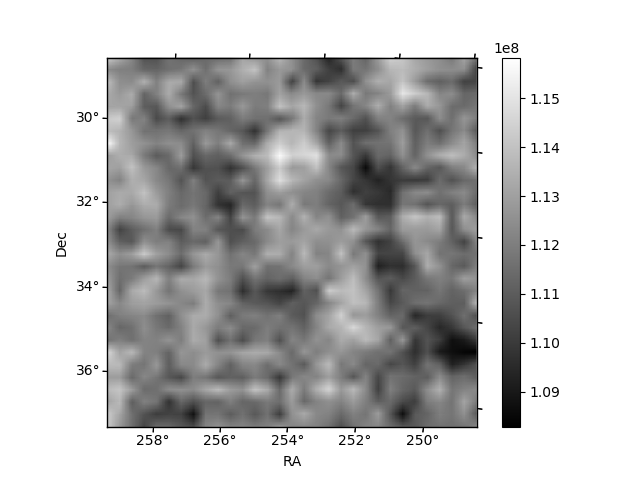
Quadrant B |
|---|---|---|---|
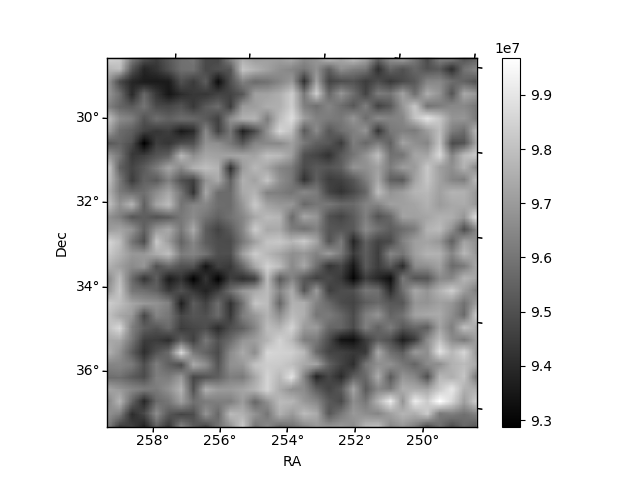
| Quadrant D | 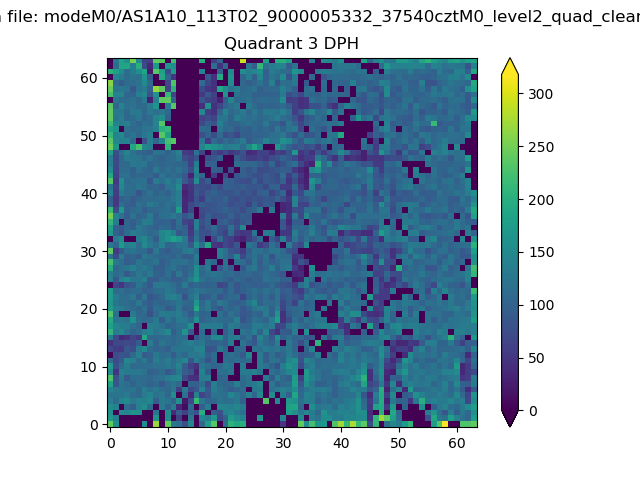 |
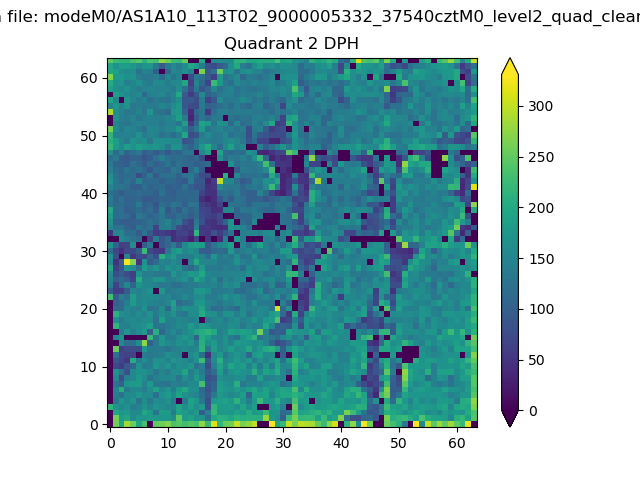 |
Quadrant C |
| Plot type | Count rate plots | Images |
|---|---|---|
| Comparison with Poisson distribution Blue bars denote a histogram of data divided into 1 sec bins. Red curve is a Poisson curve with rate = median count rate of data. |
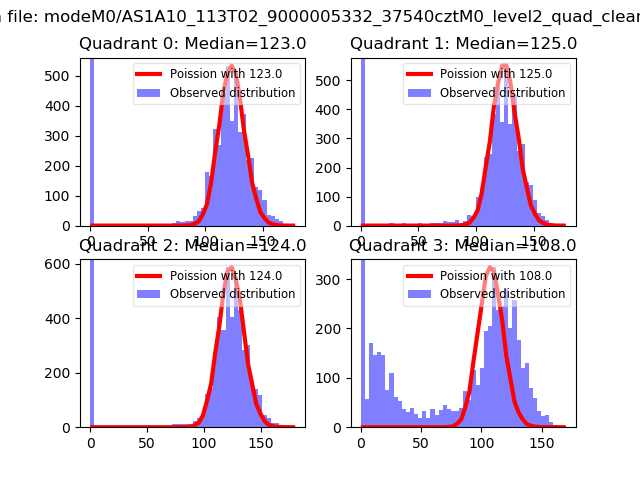 |
 |
| Quadrant-wise count rates Data is divided into 100 sec bins |
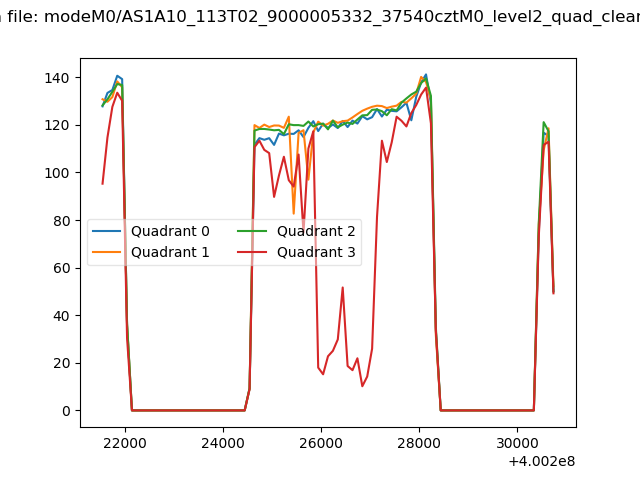 |
|
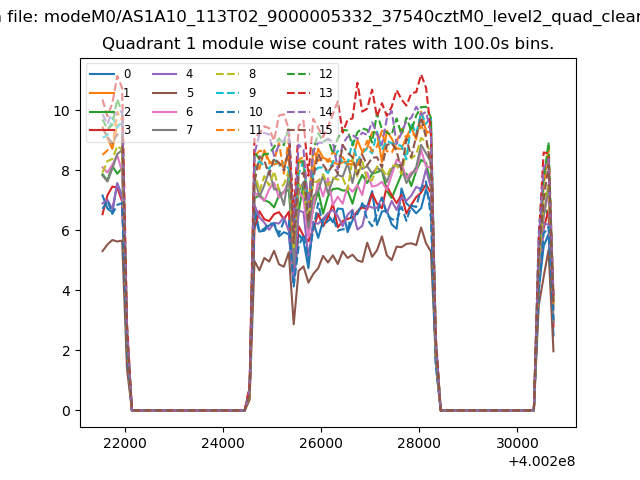
| Module-wise count rates for Quadrant A Data is divided into 100 sec bins |
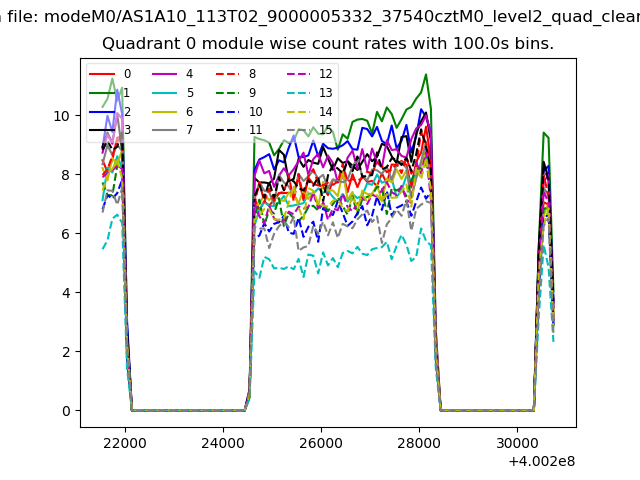 |
 |
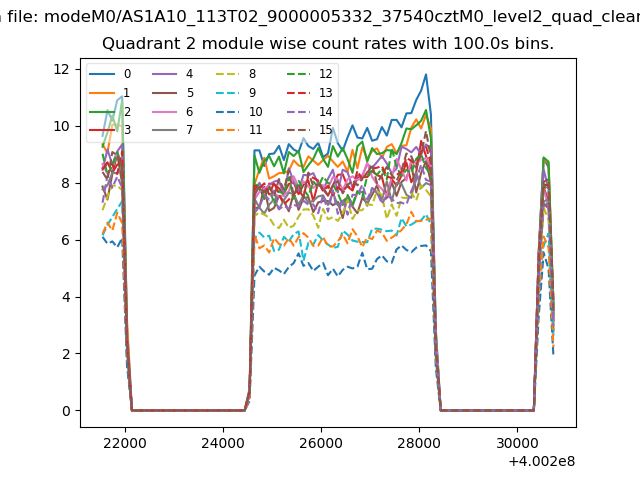
| Module-wise count rates for Quadrant B Data is divided into 100 sec bins |
 |
 |
| Module-wise count rates for Quadrant C Data is divided into 100 sec bins |
 |
 |
| Module-wise count rates for Quadrant D Data is divided into 100 sec bins |
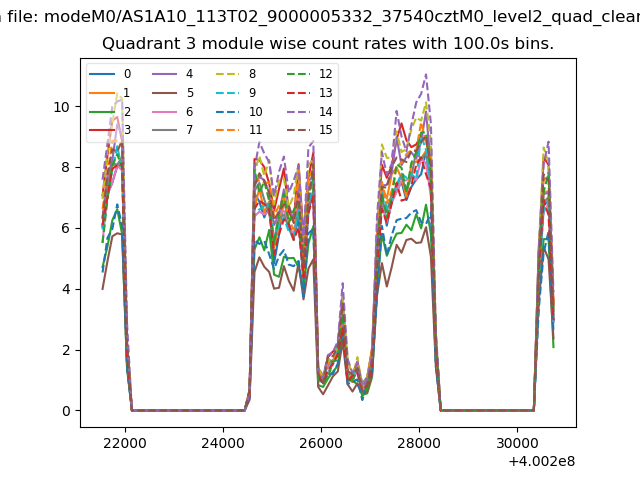 |
 |
| Parameter | Plot |
|---|---|
| CZT HV Monitor | 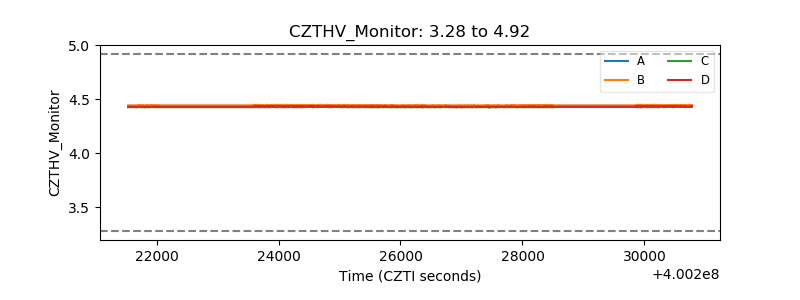 |
| D_VDD | 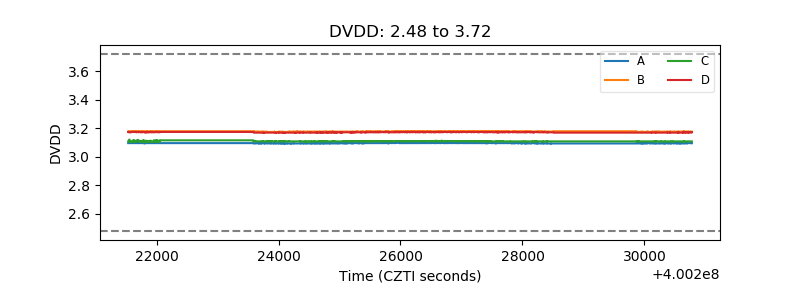 |
| Temperature 1 | 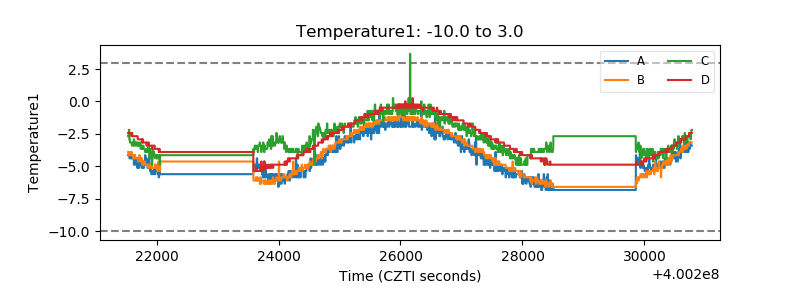 |
| Veto HV Monitor | 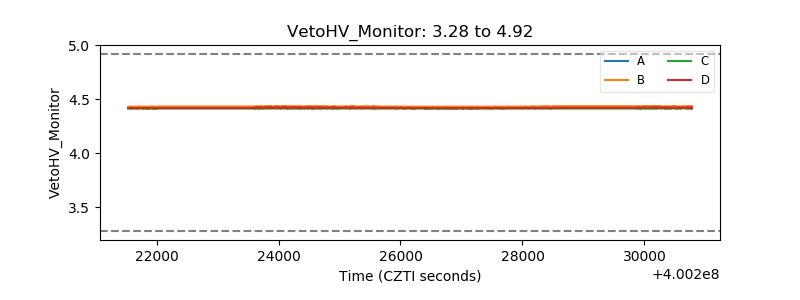 |
| Veto LLD | 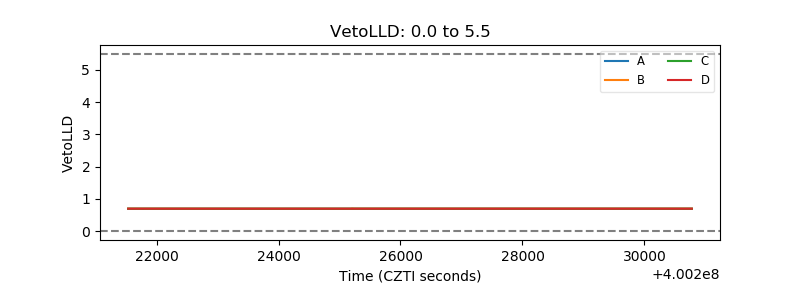 |
| Alpha Counter | 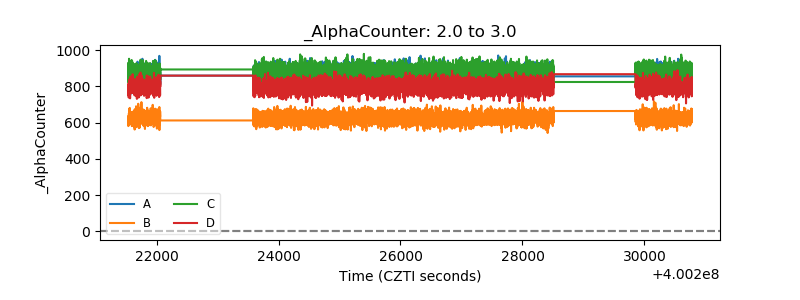 |
| _CPM_Rate | 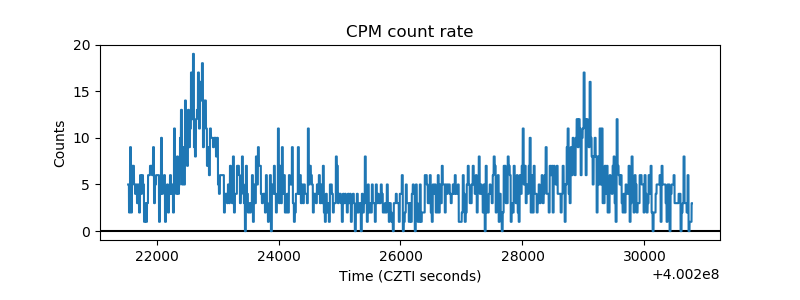 |
| CZT Counter | 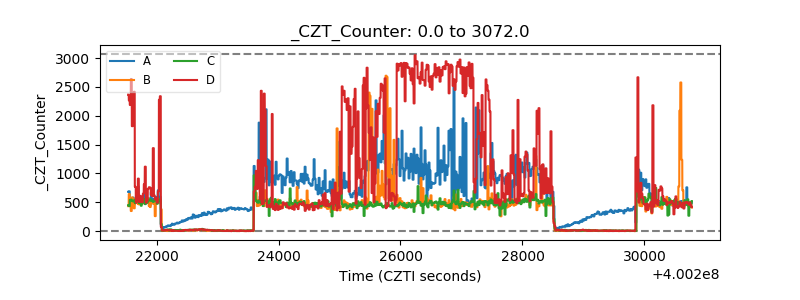 |
| +2.5 Volts monitor | 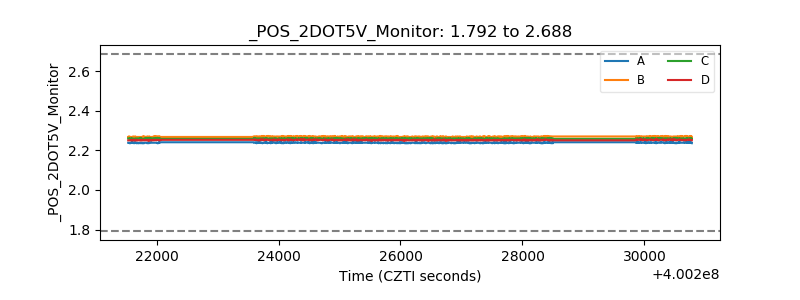 |
| +5 Volts monitor | 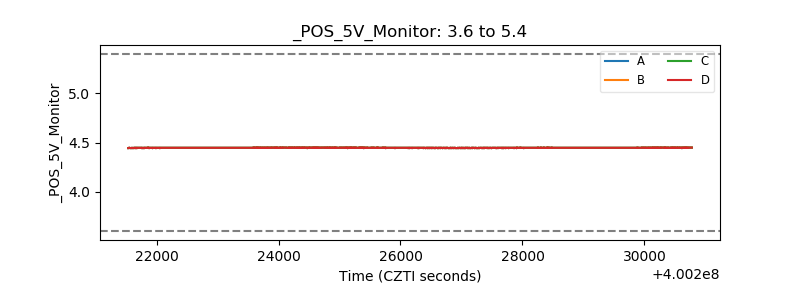 |
| _ROLL_ROT | 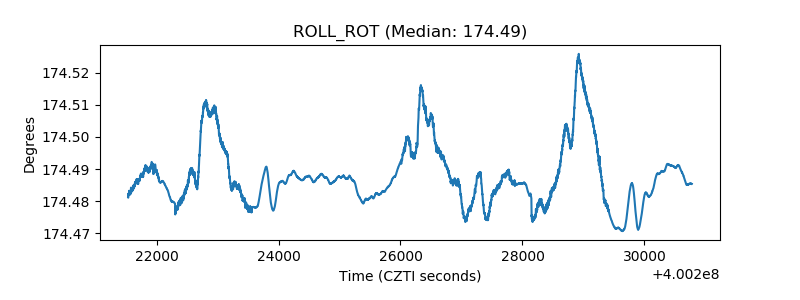 |
| _Roll_DEC | 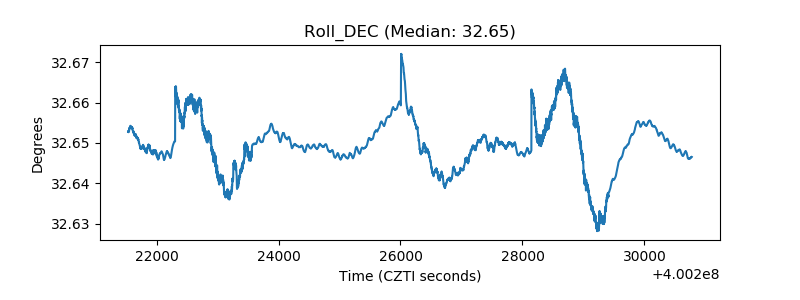 |
| _Roll_RA | 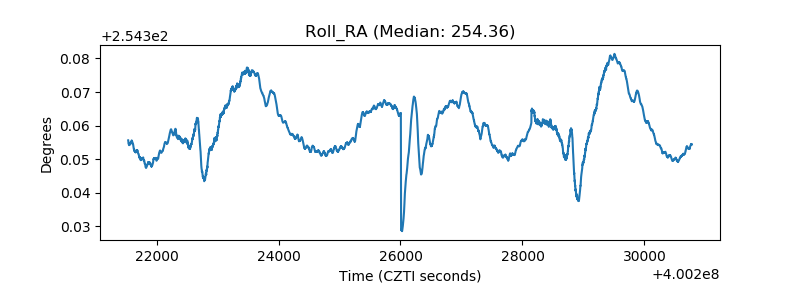 |
| Veto Counter | 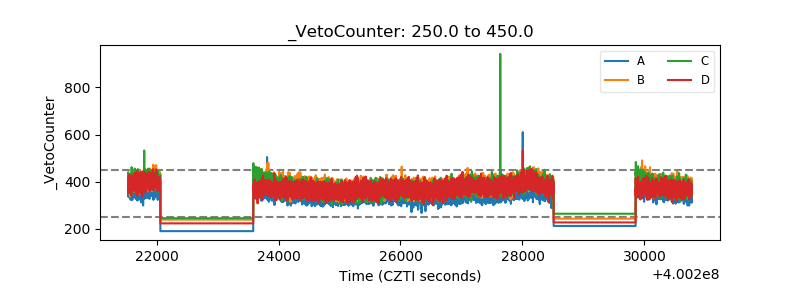 |