| Param | Original file | Final file |
|---|---|---|
| Filename | modeM0/AS1A10_113T02_9000005332_37541cztM0_level2.evt | modeM0/AS1A10_113T02_9000005332_37541cztM0_level2_quad_clean.evt |
| Size (bytes) | 371,350,080 | 54,391,680 |
| Size | 354.1 MB | 51.9 MB |
| Events in quadrant A | 2,863,227 | 358,800 |
| Events in quadrant B | 1,956,222 | 357,872 |
| Events in quadrant C | 1,917,044 | 357,816 |
| Events in quadrant D | 4,256,336 | 308,552 |
| Mode SS | |||
|---|---|---|---|
| Quadrant | BADHDUFLAG | Total packets | Discarded packets |
| A | 0 | 74 | 0 |
| B | 0 | 74 | 0 |
| C | 0 | 74 | 0 |
| D | 0 | 74 | 0 |
| Mode M9 | |||
|---|---|---|---|
| Quadrant | BADHDUFLAG | Total packets | Discarded packets |
| A | 0 | 14 | 0 |
| B | 0 | 14 | 0 |
| C | 0 | 14 | 0 |
| D | 0 | 14 | 0 |
| Mode M0 | |||
|---|---|---|---|
| Quadrant | BADHDUFLAG | Total packets | Discarded packets |
| A | 0 | 11075 | 1 |
| B | 0 | 8162 | 1 |
| C | 0 | 7978 | 1 |
| D | 0 | 15181 | 1 |
| Quadrant | Total seconds | Saturated seconds | Saturation percentage |
|---|---|---|---|
| A | 3736 | 25 | 0.669165% |
| B | 3736 | 56 | 1.498929% |
| C | 3736 | 33 | 0.883298% |
| D | 3736 | 637 | 17.050321% |
Noise dominated data is calculated using 1-second bins in cleaned event files. If a bin has >2000 counts, and if more than 50% of those come from <1% of pixels, then it is considered to be noise-dominated and hence unusable.
| Quadrant | # 1 sec bins | Bins with >0 counts | Bins with >2000 counts | High rate bins dominated by noise | Noise dominated (total time) | Noise dominated (detector-on time) | Marked lightcurve |
|---|---|---|---|---|---|---|---|
| A | 5080 | 3737 | 4 | 4 | 0.08% | 0.11% | 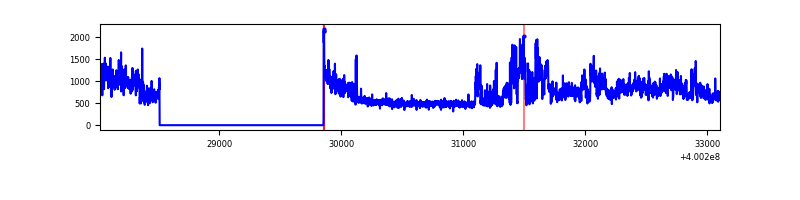 |
| B | 5080 | 3737 | 43 | 43 | 0.85% | 1.15% | 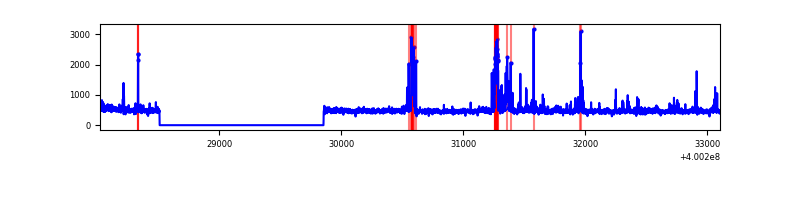 |
| C | 5080 | 3737 | 30 | 30 | 0.59% | 0.80% | 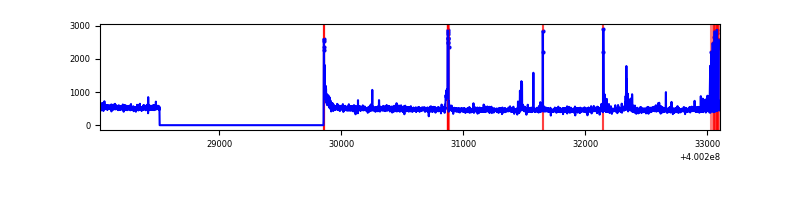 |
| D | 5079 | 3736 | 681 | 681 | 13.41% | 18.23% | 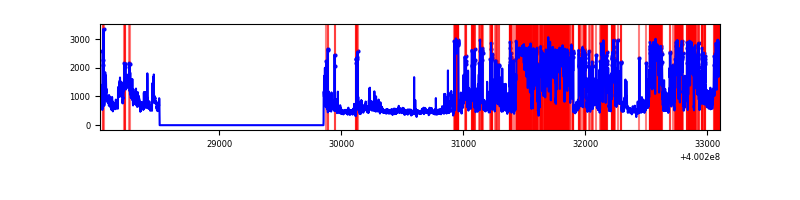 |
Top three noisy pixels from each quadrant. If the there are fewer than three noisy pixels in the level2.evt file, extra rows are filled as -1
| Pixel properties | Quadrant properties | ||||||
|---|---|---|---|---|---|---|---|
| Quadrant | DetID | PixID | Counts | Sigma | Mean | Median | Sigma |
| A | 15 | 222 | 985495 | 11431.46 | 422 | 413 | 86.2 |
| A | 10 | 83 | 194346 | 2250.51 | 422 | 413 | 86.2 |
| A | 12 | 189 | 38380 | 440.59 | 422 | 413 | 86.2 |
| B | 5 | 172 | 148816 | 1817.38 | 415 | 403 | 81.7 |
| B | 5 | 255 | 40500 | 491.01 | 415 | 403 | 81.7 |
| B | 4 | 80 | 27795 | 335.43 | 415 | 403 | 81.7 |
| C | 15 | 214 | 159210 | 1653.89 | 407 | 409 | 96.0 |
| C | 14 | 254 | 126119 | 1309.25 | 407 | 409 | 96.0 |
| C | 0 | 10 | 30074 | 308.95 | 407 | 409 | 96.0 |
| D | 12 | 227 | 2015954 | 21002.2 | 389 | 379 | 96.0 |
| D | 12 | 233 | 362605 | 3774.38 | 389 | 379 | 96.0 |
| D | 1 | 52 | 89089 | 924.35 | 389 | 379 | 96.0 |
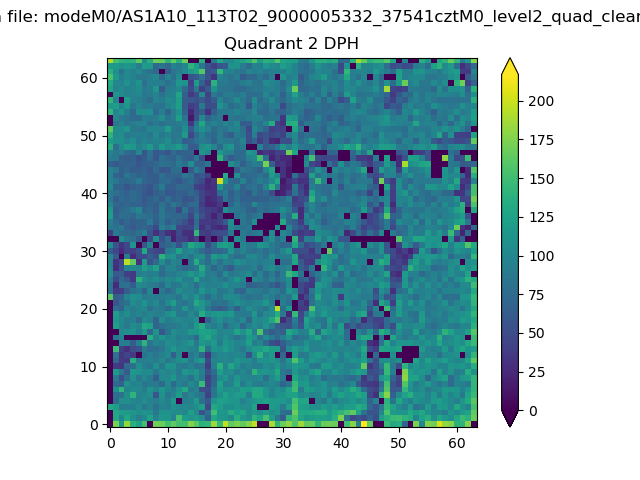
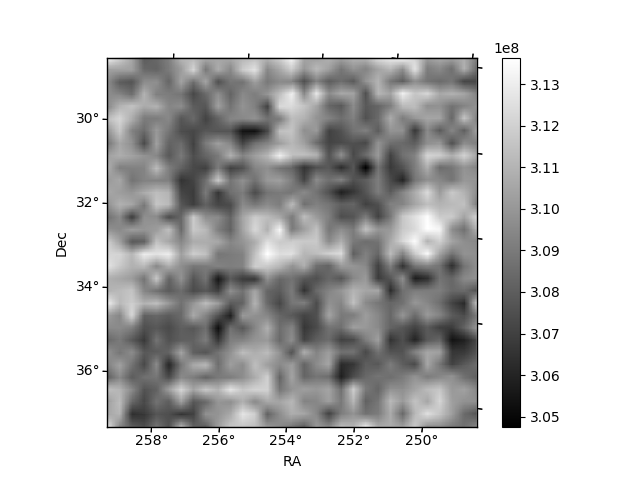
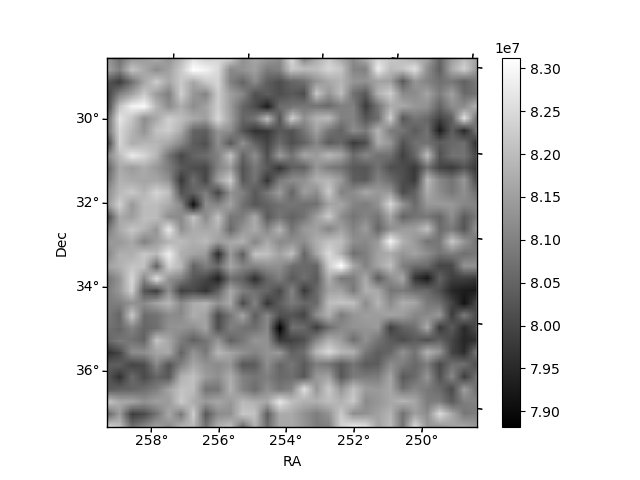
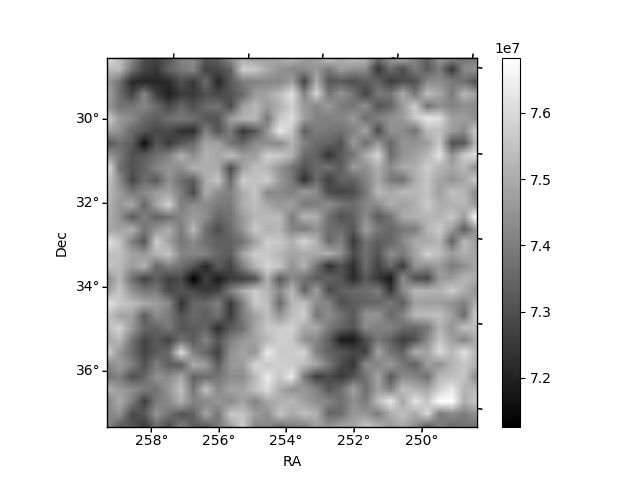
Histogram calculated using DETX and DETY for each event in the final _common_clean file
| Quadrant A | 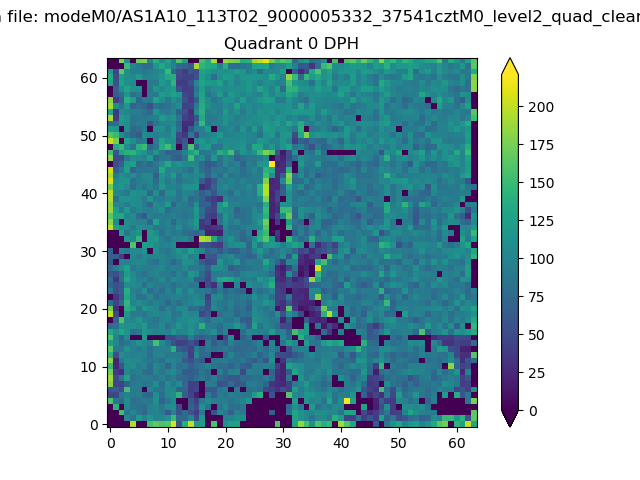 |
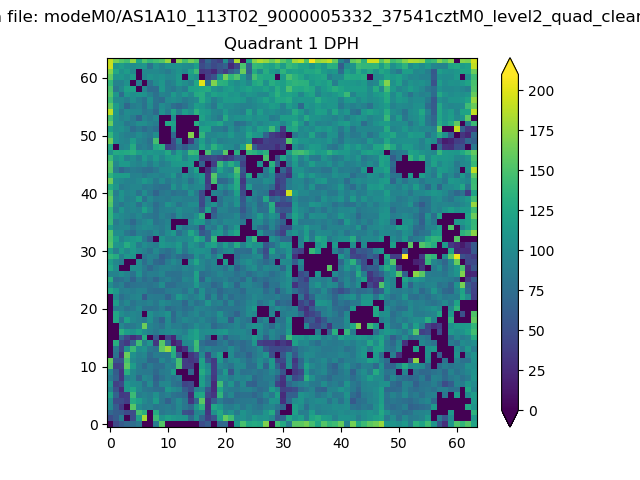 |
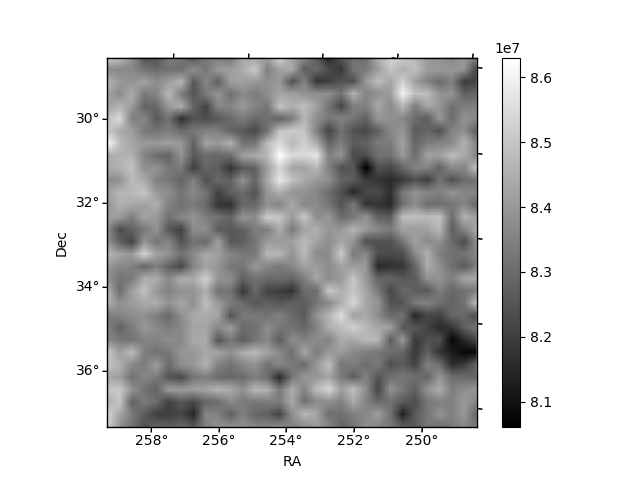
Quadrant B |
|---|---|---|---|
| Quadrant D | 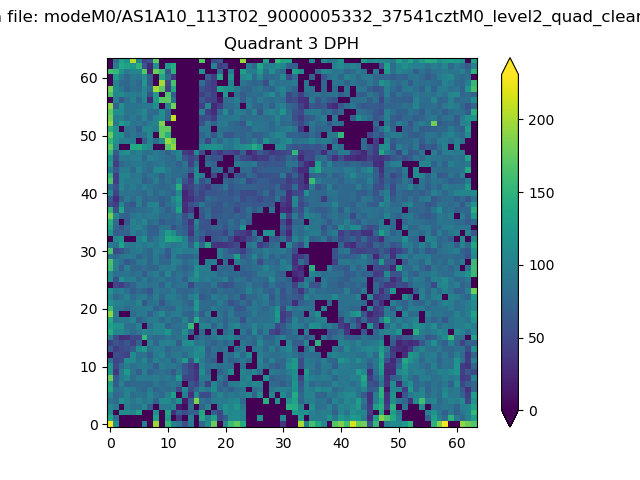 |
 |
Quadrant C |
| Plot type | Count rate plots | Images |
|---|---|---|
| Comparison with Poisson distribution Blue bars denote a histogram of data divided into 1 sec bins. Red curve is a Poisson curve with rate = median count rate of data. |
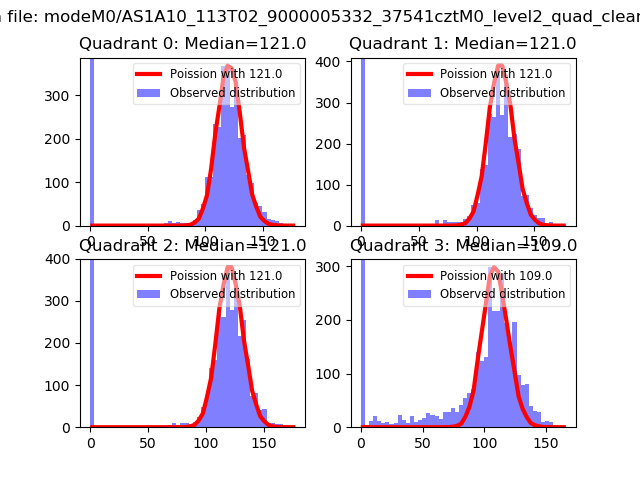 |
 |
| Quadrant-wise count rates Data is divided into 100 sec bins |
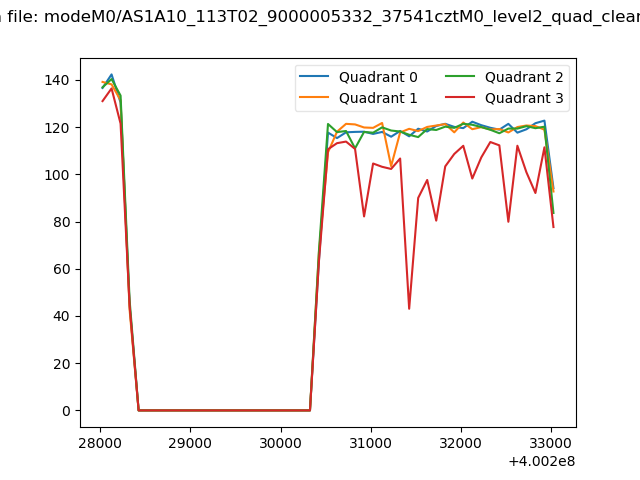 |
|
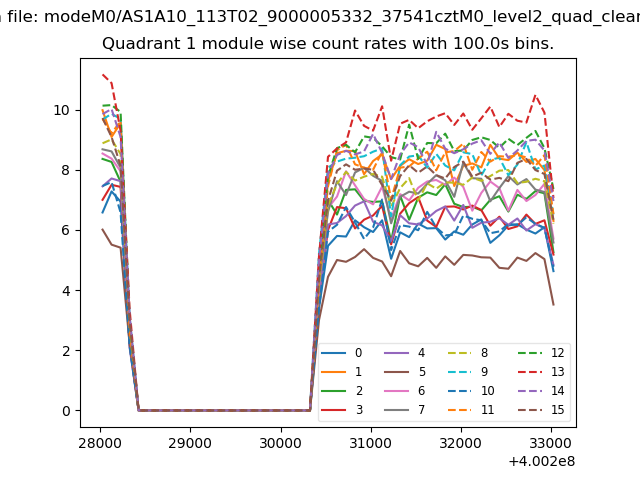
| Module-wise count rates for Quadrant A Data is divided into 100 sec bins |
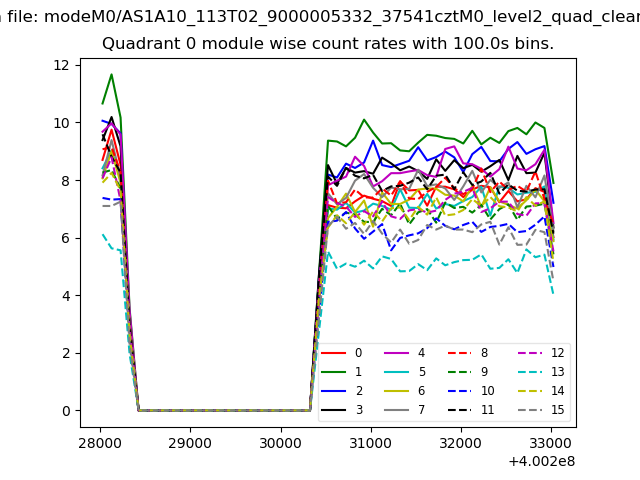 |
 |
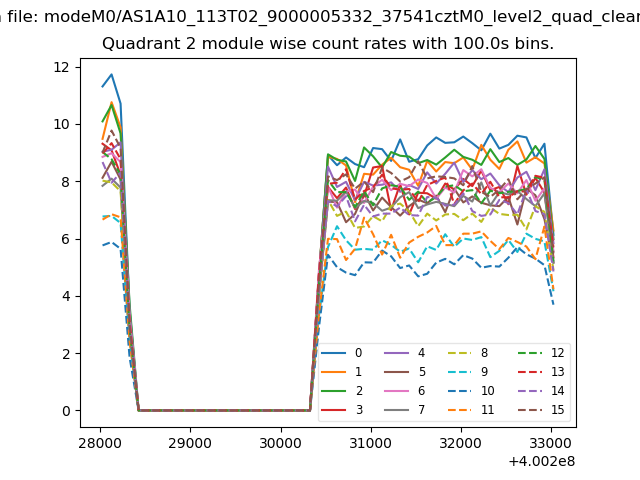
| Module-wise count rates for Quadrant B Data is divided into 100 sec bins |
 |
 |
| Module-wise count rates for Quadrant C Data is divided into 100 sec bins |
 |
 |
| Module-wise count rates for Quadrant D Data is divided into 100 sec bins |
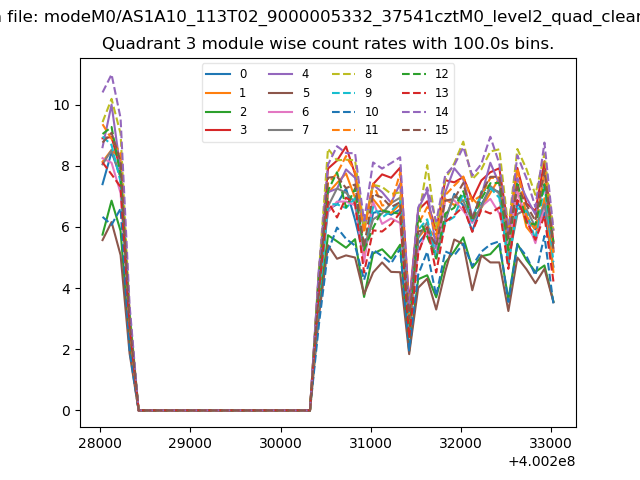 |
 |
| Parameter | Plot |
|---|---|
| CZT HV Monitor | 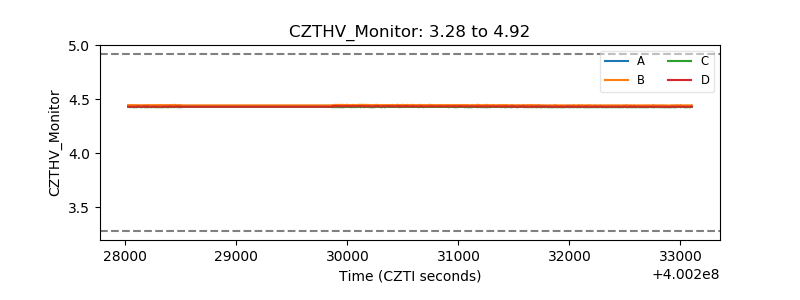 |
| D_VDD | 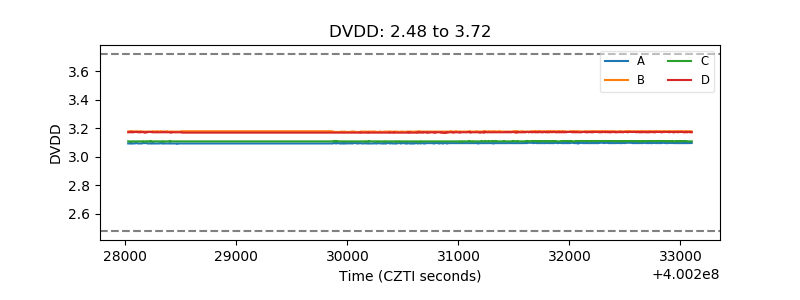 |
| Temperature 1 | 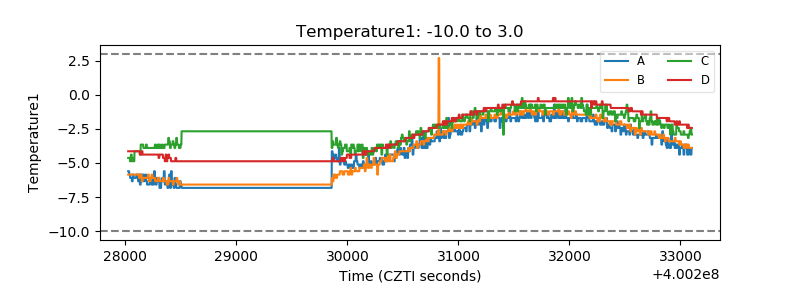 |
| Veto HV Monitor | 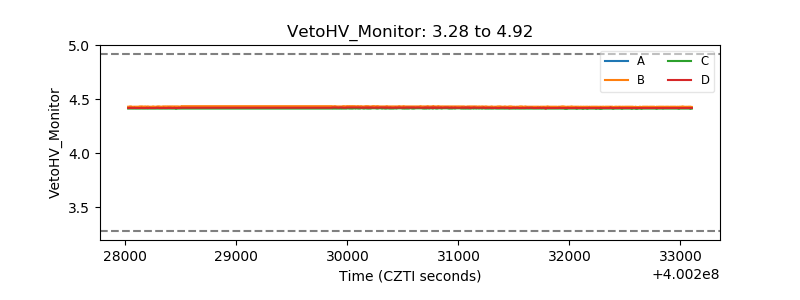 |
| Veto LLD | 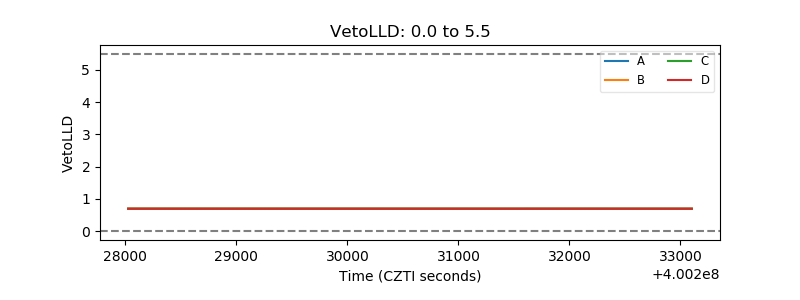 |
| Alpha Counter | 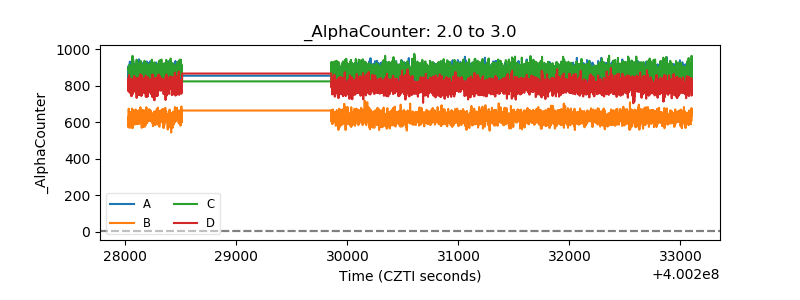 |
| _CPM_Rate | 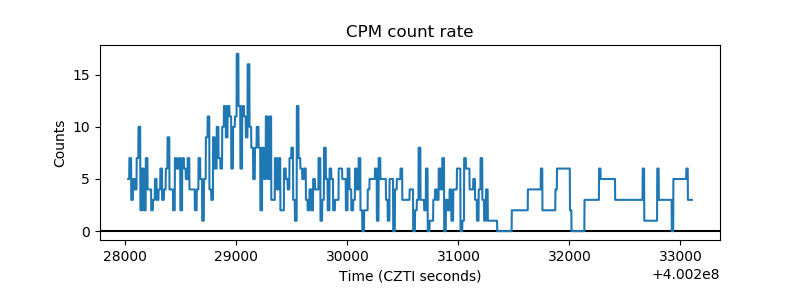 |
| CZT Counter | 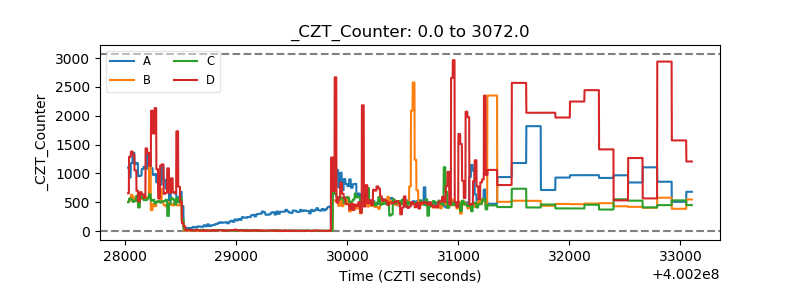 |
| +2.5 Volts monitor |  |
| +5 Volts monitor | 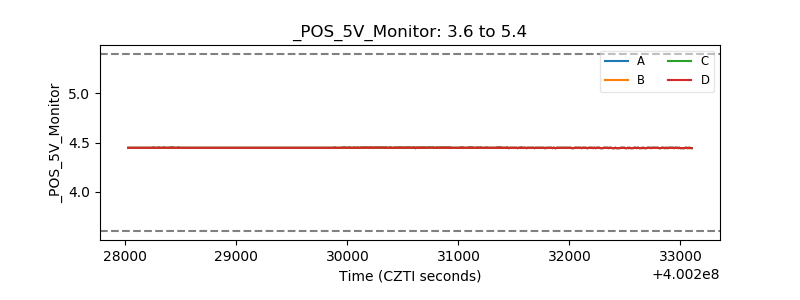 |
| _ROLL_ROT | 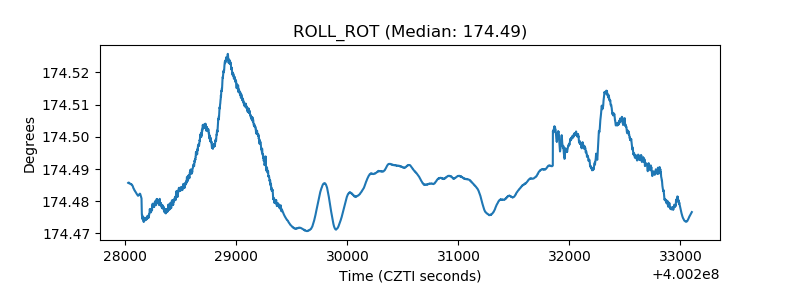 |
| _Roll_DEC | 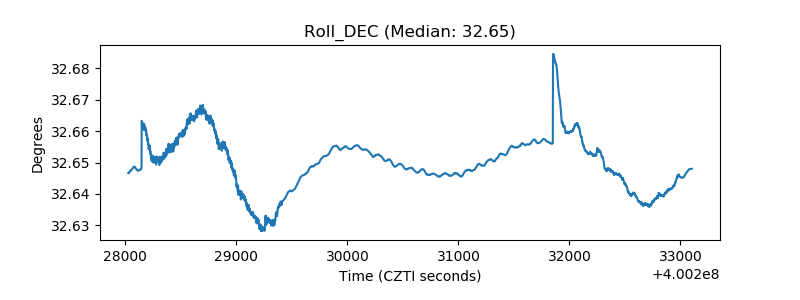 |
| _Roll_RA | 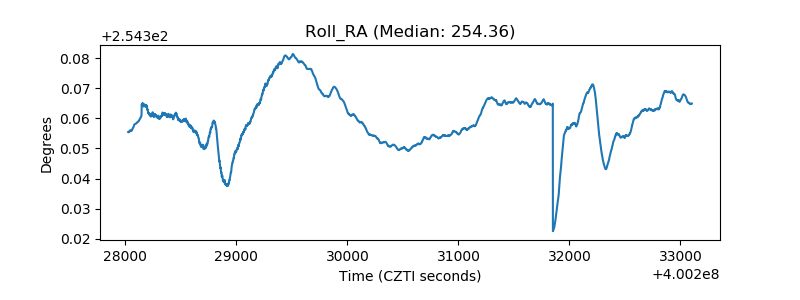 |
| Veto Counter | 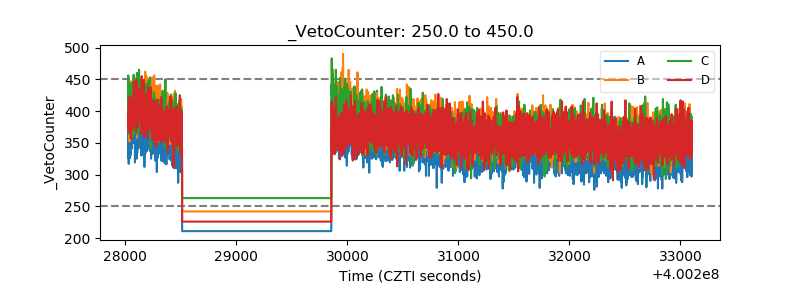 |