| Param | Original file | Final file |
|---|---|---|
| Filename | modeM0/AS1T05_051T01_9000005334cztM0_level2.fits | modeM0/AS1T05_051T01_9000005334cztM0_level2_quad_clean.evt |
| Size (bytes) | 598,438,080 | 636,140,160 |
| Size | 570.7 MB | 606.7 MB |
| Events in quadrant A | 3,603,230 | 3,823,919 |
| Events in quadrant B | 3,472,594 | 3,856,413 |
| Events in quadrant C | 3,550,988 | 3,775,328 |
| Events in quadrant D | 3,030,265 | 3,345,407 |
| Mode M9 | |||
|---|---|---|---|
| Quadrant | BADHDUFLAG | Total packets | Discarded packets |
| A | 0 | 249 | 0 |
| B | 0 | 247 | 0 |
| C | 0 | 250 | 0 |
| D | 0 | 249 | 0 |
| Mode M0 | |||
|---|---|---|---|
| Quadrant | BADHDUFLAG | Total packets | Discarded packets |
| A | 0 | 156845 | 0 |
| B | 0 | 148495 | 0 |
| C | 0 | 145728 | 0 |
| D | 0 | 174356 | 0 |
| Mode SS | |||
|---|---|---|---|
| Quadrant | BADHDUFLAG | Total packets | Discarded packets |
| A | 0 | 1334 | 0 |
| B | 0 | 1333 | 0 |
| C | 0 | 1334 | 0 |
| D | 0 | 1338 | 0 |
| Quadrant | Total seconds | Saturated seconds | Saturation percentage |
|---|---|---|---|
| A | 64899 | 999 | 1.539315% |
| B | 65183 | 1038 | 1.592440% |
| C | 65184 | 994 | 1.524914% |
| D | 65055 | 2588 | 3.978172% |
Noise dominated data is calculated using 1-second bins in cleaned event files. If a bin has >2000 counts, and if more than 50% of those come from <1% of pixels, then it is considered to be noise-dominated and hence unusable.
| Quadrant | # 1 sec bins | Bins with >0 counts | Bins with >2000 counts | High rate bins dominated by noise | Noise dominated (total time) | Noise dominated (detector-on time) | Marked lightcurve |
|---|---|---|---|---|---|---|---|
| A | 91455 | 65300 | 0 | 0 | 0.00% | 0.00% |  |
| B | 91455 | 65573 | 0 | 0 | 0.00% | 0.00% |  |
| C | 91455 | 65586 | 0 | 0 | 0.00% | 0.00% |  |
| D | 91455 | 65445 | 0 | 0 | 0.00% | 0.00% |  |
Top three noisy pixels from each quadrant. If the there are fewer than three noisy pixels in the level2.evt file, extra rows are filled as -1
| Pixel properties | Quadrant properties | ||||||
|---|---|---|---|---|---|---|---|
| Quadrant | DetID | PixID | Counts | Sigma | Mean | Median | Sigma |
| A | 0 | 29 | 2970 | 8.85 | 941 | 882 | 235.9 |
| A | 9 | 19 | 2903 | 8.57 | 941 | 882 | 235.9 |
| A | 7 | 110 | 2868 | 8.42 | 941 | 882 | 235.9 |
| B | 2 | 9 | 2966 | 11.56 | 922 | 882 | 180.3 |
| B | 3 | 80 | 2697 | 10.06 | 922 | 882 | 180.3 |
| B | 5 | 128 | 2417 | 8.51 | 922 | 882 | 180.3 |
| C | 1 | 81 | 3017 | 8.87 | 939 | 882 | 240.8 |
| C | 1 | 80 | 2977 | 8.7 | 939 | 882 | 240.8 |
| C | 3 | 203 | 2874 | 8.27 | 939 | 882 | 240.8 |
| D | 10 | 189 | 2224 | 6.15 | 867 | 789 | 233.1 |
| D | 10 | 113 | 2215 | 6.12 | 867 | 789 | 233.1 |
| D | 7 | 3 | 2209 | 6.09 | 867 | 789 | 233.1 |
Histogram calculated using DETX and DETY for each event in the final _common_clean file
| Quadrant A |  |
 |
Quadrant B |
|---|---|---|---|
| Quadrant D | 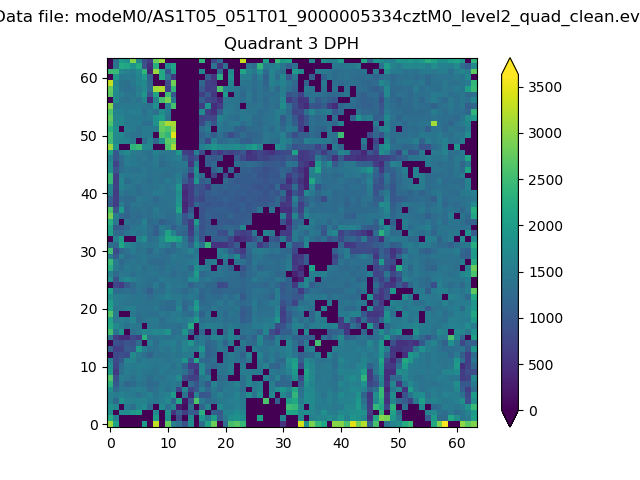 |
 |
Quadrant C |
| Plot type | Count rate plots | Images |
|---|---|---|
| Comparison with Poisson distribution Blue bars denote a histogram of data divided into 1 sec bins. Red curve is a Poisson curve with rate = median count rate of data. |
 |
 |
| Quadrant-wise count rates Data is divided into 100 sec bins |
 |
|
| Module-wise count rates for Quadrant A Data is divided into 100 sec bins |
 |
 |
| Module-wise count rates for Quadrant B Data is divided into 100 sec bins |
 |
 |
| Module-wise count rates for Quadrant C Data is divided into 100 sec bins |
 |
 |
| Module-wise count rates for Quadrant D Data is divided into 100 sec bins |
 |
 |
| Parameter | Plot |
|---|---|
| CZT HV Monitor |  |
| D_VDD |  |
| Temperature 1 |  |
| Veto HV Monitor |  |
| Veto LLD |  |
| Alpha Counter |  |
| _CPM_Rate |  |
| CZT Counter |  |
| +2.5 Volts monitor |  |
| +5 Volts monitor |  |
| _ROLL_ROT |  |
| _Roll_DEC | 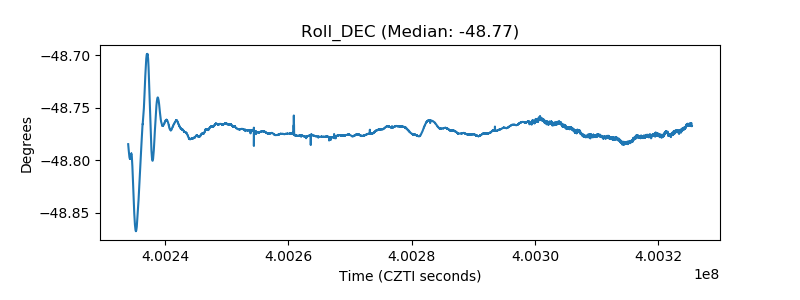 |
| _Roll_RA |  |
| Veto Counter |  |