| Param | Original file | Final file |
|---|---|---|
| Filename | modeM0/AS1T05_051T01_9000005334_37541cztM0_level2.evt | modeM0/AS1T05_051T01_9000005334_37541cztM0_level2_quad_clean.evt |
| Size (bytes) | 157,104,000 | 23,158,080 |
| Size | 149.8 MB | 22.1 MB |
| Events in quadrant A | 1,104,202 | 141,026 |
| Events in quadrant B | 934,004 | 146,387 |
| Events in quadrant C | 1,048,284 | 145,959 |
| Events in quadrant D | 1,542,676 | 131,547 |
| Mode M9 | |||
|---|---|---|---|
| Quadrant | BADHDUFLAG | Total packets | Discarded packets |
| A | 0 | 14 | 0 |
| B | 0 | 14 | 0 |
| C | 0 | 14 | 0 |
| D | 0 | 14 | 0 |
| Mode M0 | |||
|---|---|---|---|
| Quadrant | BADHDUFLAG | Total packets | Discarded packets |
| A | 0 | 4395 | 2 |
| B | 0 | 3871 | 1 |
| C | 0 | 4150 | 1 |
| D | 0 | 5823 | 1 |
| Mode SS | |||
|---|---|---|---|
| Quadrant | BADHDUFLAG | Total packets | Discarded packets |
| A | 0 | 38 | 0 |
| B | 0 | 38 | 0 |
| C | 0 | 38 | 0 |
| D | 0 | 38 | 0 |
| Quadrant | Total seconds | Saturated seconds | Saturation percentage |
|---|---|---|---|
| A | 1862 | 10 | 0.537057% |
| B | 1862 | 5 | 0.268528% |
| C | 1862 | 7 | 0.375940% |
| D | 1862 | 149 | 8.002148% |
Noise dominated data is calculated using 1-second bins in cleaned event files. If a bin has >2000 counts, and if more than 50% of those come from <1% of pixels, then it is considered to be noise-dominated and hence unusable.
| Quadrant | # 1 sec bins | Bins with >0 counts | Bins with >2000 counts | High rate bins dominated by noise | Noise dominated (total time) | Noise dominated (detector-on time) | Marked lightcurve |
|---|---|---|---|---|---|---|---|
| A | 3176 | 1863 | 5 | 5 | 0.16% | 0.27% | 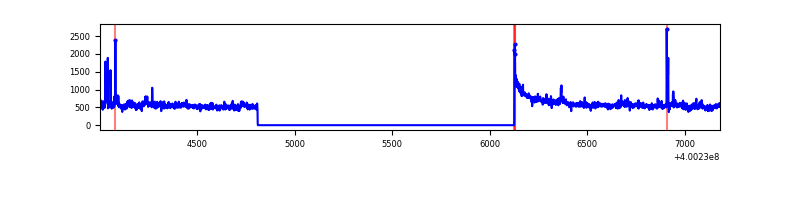 |
| B | 3176 | 1863 | 1 | 1 | 0.03% | 0.05% | 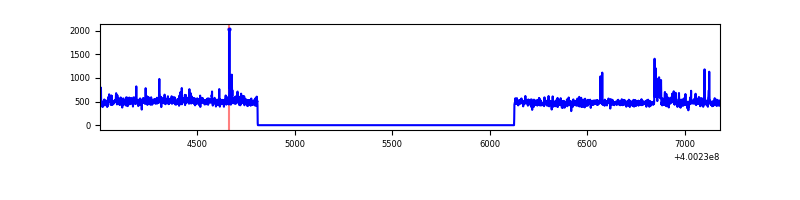 |
| C | 3176 | 1863 | 6 | 6 | 0.19% | 0.32% | 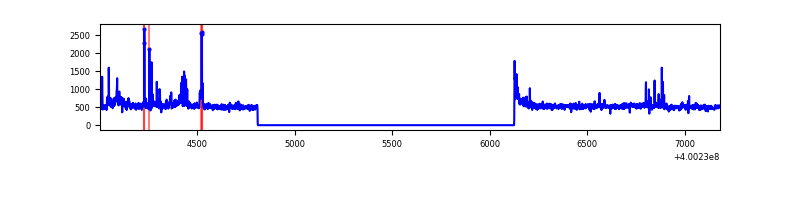 |
| D | 3176 | 1863 | 126 | 126 | 3.97% | 6.76% | 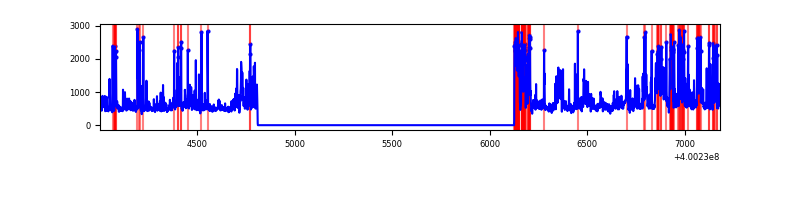 |
Top three noisy pixels from each quadrant. If the there are fewer than three noisy pixels in the level2.evt file, extra rows are filled as -1
| Pixel properties | Quadrant properties | ||||||
|---|---|---|---|---|---|---|---|
| Quadrant | DetID | PixID | Counts | Sigma | Mean | Median | Sigma |
| A | 10 | 83 | 122502 | 2646.86 | 222 | 217 | 46.2 |
| A | 15 | 222 | 80946 | 1747.38 | 222 | 217 | 46.2 |
| A | 6 | 10 | 14020 | 298.77 | 222 | 217 | 46.2 |
| B | 5 | 172 | 20836 | 460.66 | 223 | 217 | 44.8 |
| B | 4 | 80 | 10520 | 230.19 | 223 | 217 | 44.8 |
| B | 4 | 81 | 6113 | 131.73 | 223 | 217 | 44.8 |
| C | 14 | 254 | 89412 | 1674.26 | 220 | 221 | 53.3 |
| C | 15 | 214 | 81200 | 1520.1 | 220 | 221 | 53.3 |
| C | 0 | 10 | 15823 | 292.87 | 220 | 221 | 53.3 |
| D | 2 | 249 | 462465 | 8568.89 | 213 | 207 | 53.9 |
| D | 13 | 249 | 76902 | 1421.7 | 213 | 207 | 53.9 |
| D | 12 | 233 | 34123 | 628.7 | 213 | 207 | 53.9 |
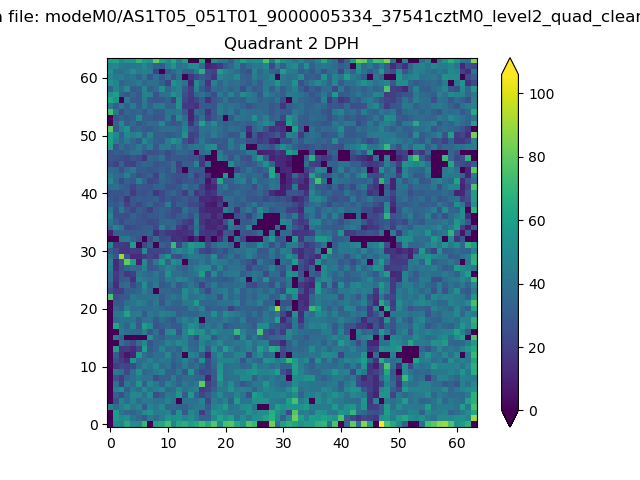
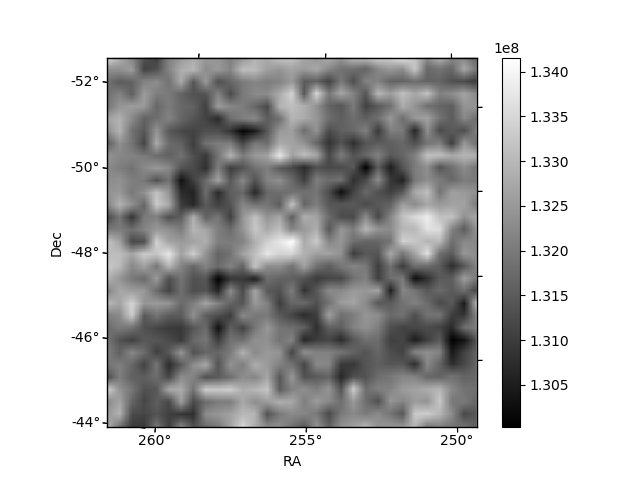
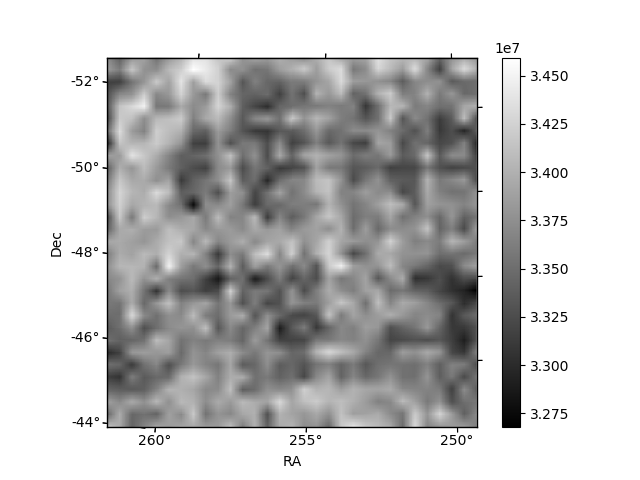
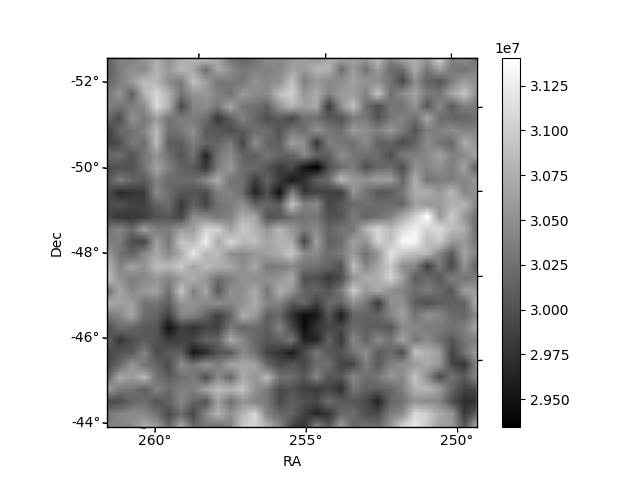
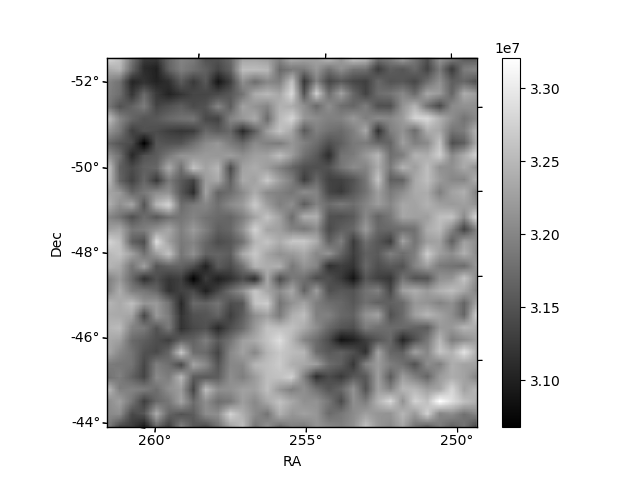
Histogram calculated using DETX and DETY for each event in the final _common_clean file
| Quadrant A | 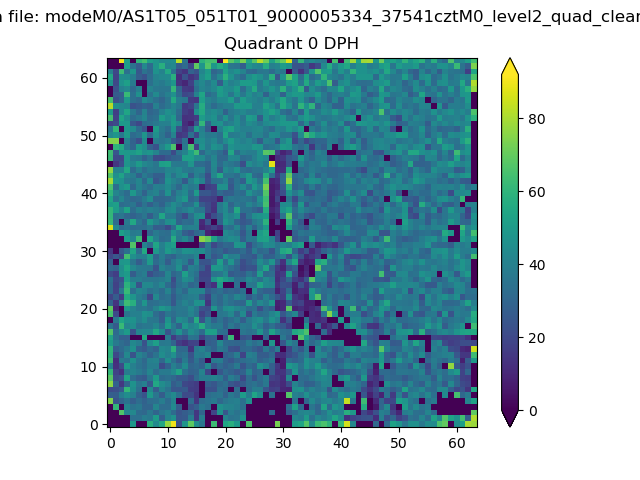 |
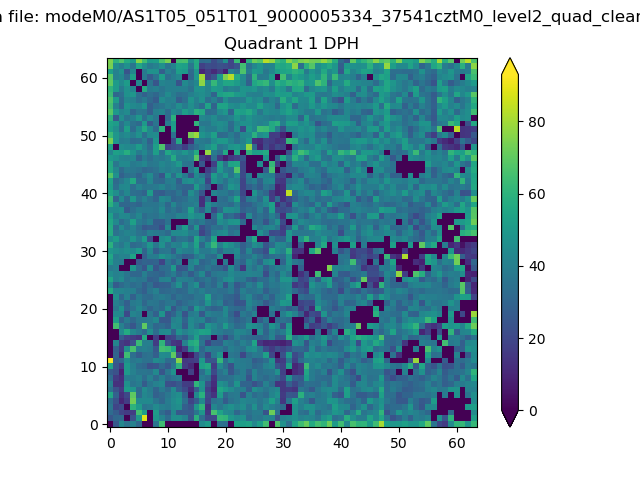 |
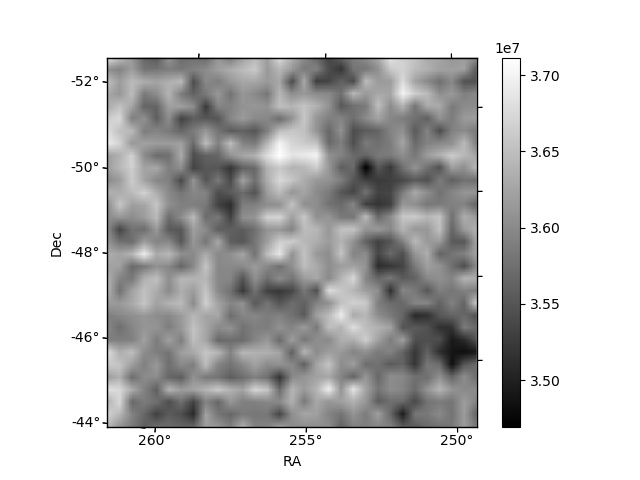
Quadrant B |
|---|---|---|---|
| Quadrant D | 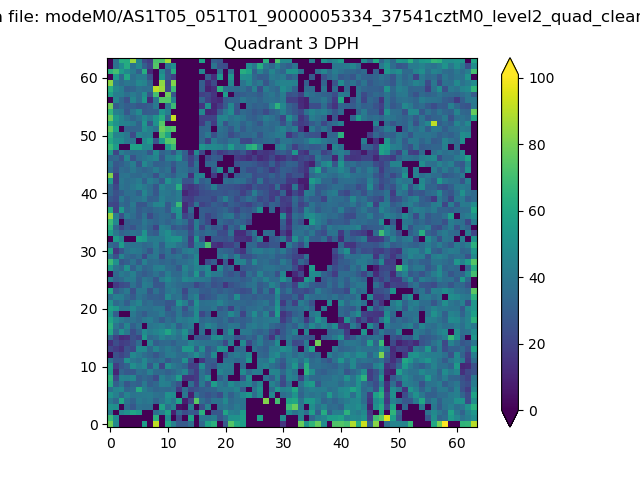 |
 |
Quadrant C |
| Plot type | Count rate plots | Images |
|---|---|---|
| Comparison with Poisson distribution Blue bars denote a histogram of data divided into 1 sec bins. Red curve is a Poisson curve with rate = median count rate of data. |
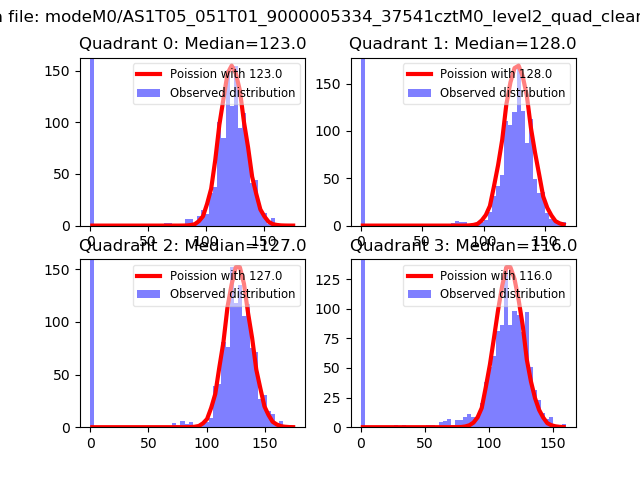 |
 |
| Quadrant-wise count rates Data is divided into 100 sec bins |
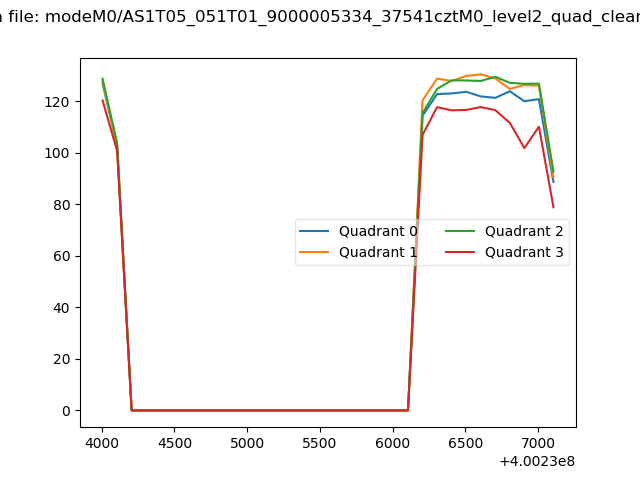 |
|
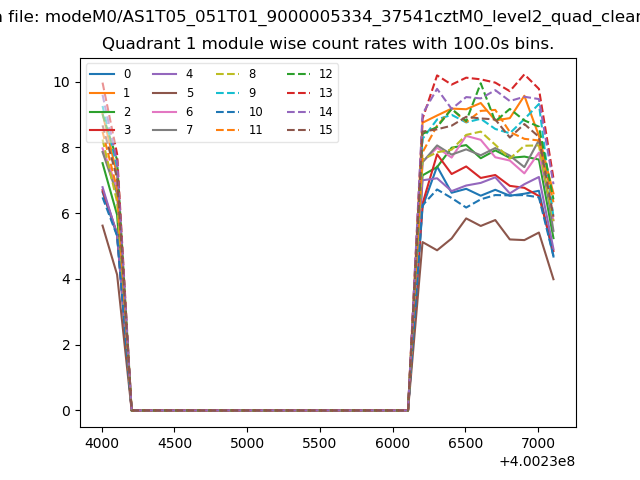
| Module-wise count rates for Quadrant A Data is divided into 100 sec bins |
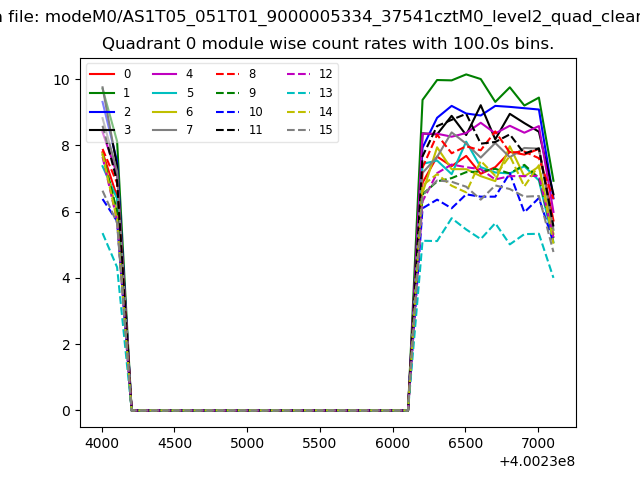 |
 |
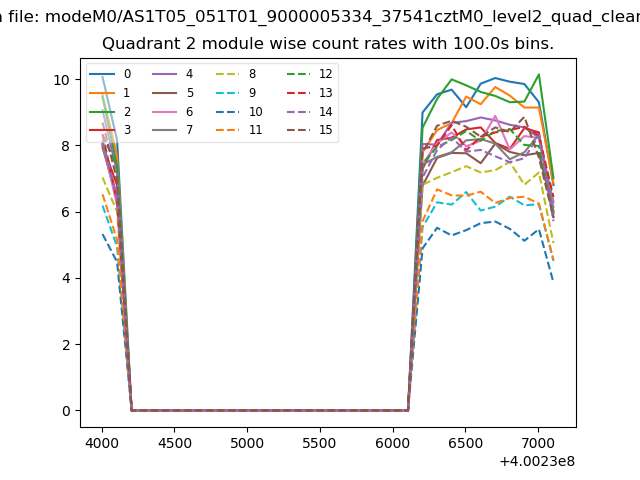
| Module-wise count rates for Quadrant B Data is divided into 100 sec bins |
 |
 |
| Module-wise count rates for Quadrant C Data is divided into 100 sec bins |
 |
 |
| Module-wise count rates for Quadrant D Data is divided into 100 sec bins |
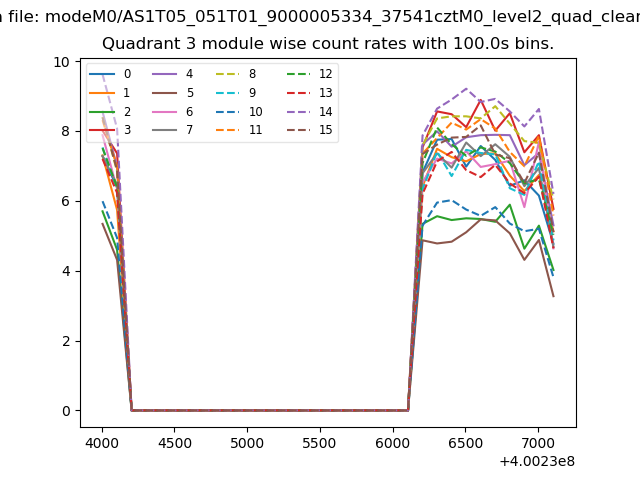 |
 |
| Parameter | Plot |
|---|---|
| CZT HV Monitor |  |
| D_VDD | 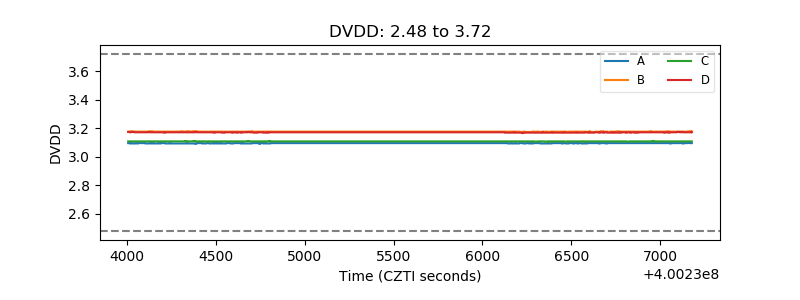 |
| Temperature 1 | 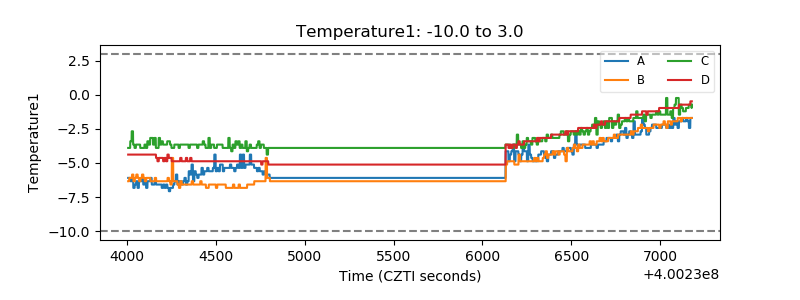 |
| Veto HV Monitor | 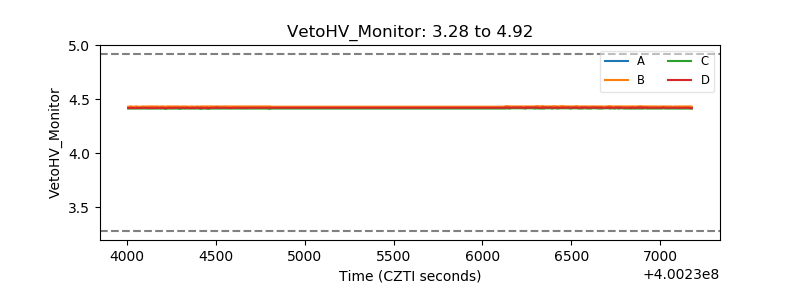 |
| Veto LLD | 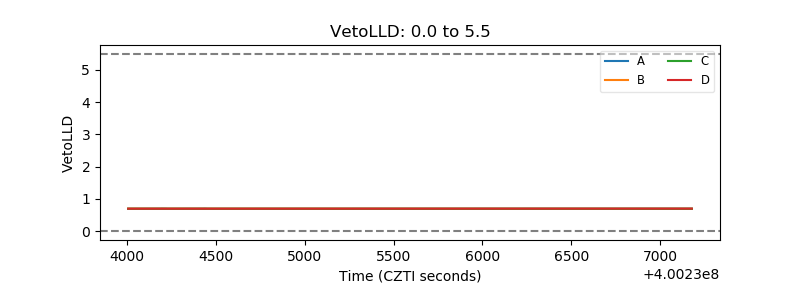 |
| Alpha Counter | 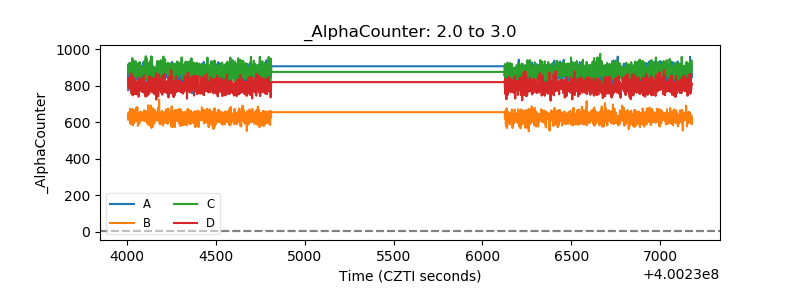 |
| _CPM_Rate | 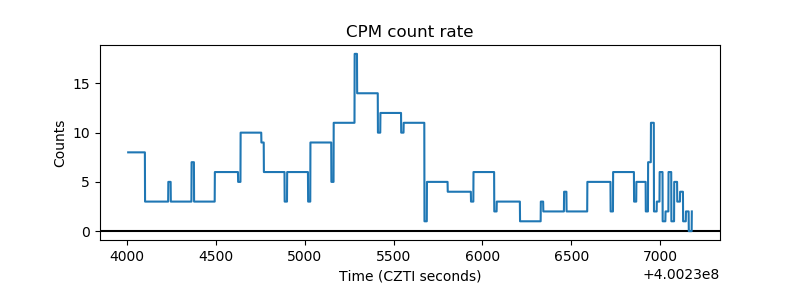 |
| CZT Counter | 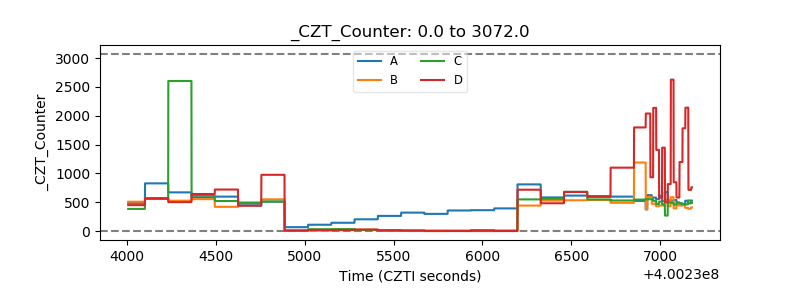 |
| +2.5 Volts monitor | 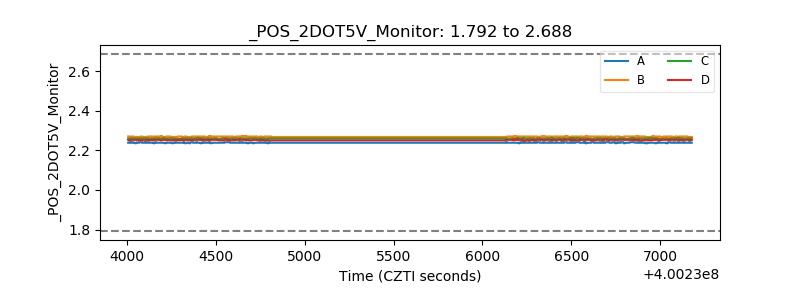 |
| +5 Volts monitor | 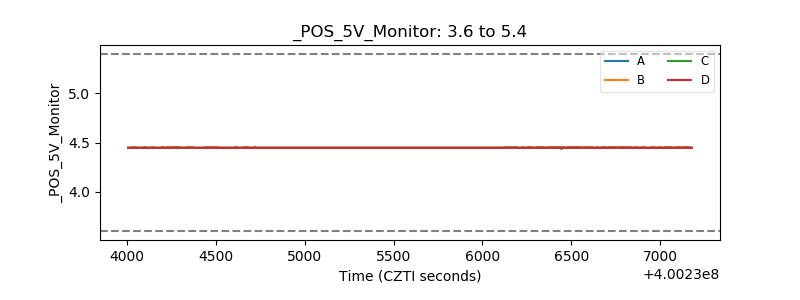 |
| _ROLL_ROT | 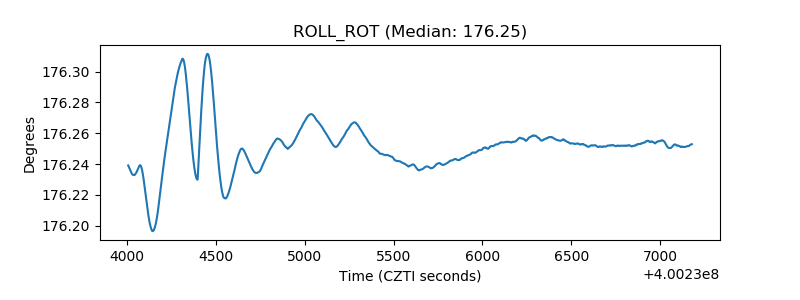 |
| _Roll_DEC | 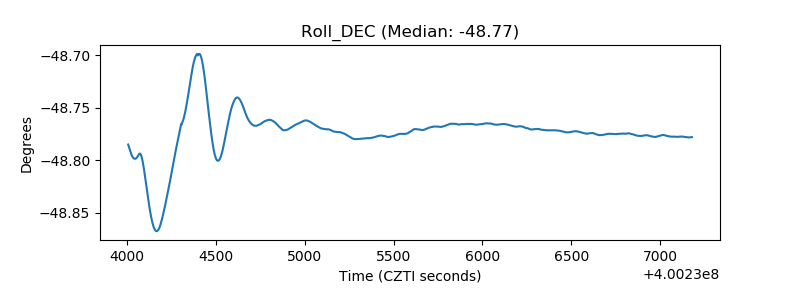 |
| _Roll_RA | 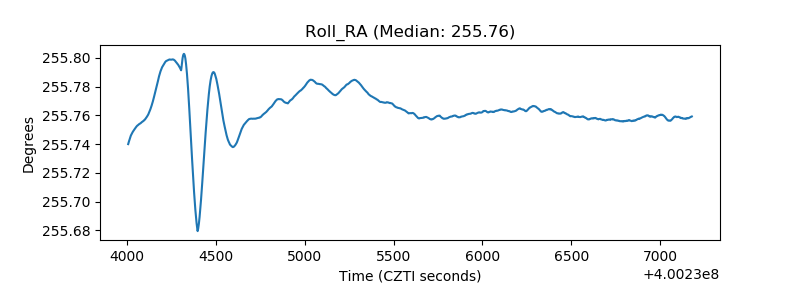 |
| Veto Counter | 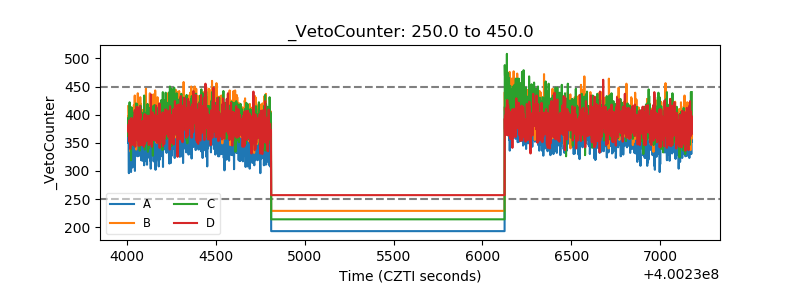 |