| Param | Original file | Final file |
|---|---|---|
| Filename | modeM0/AS1T05_051T01_9000005334_37543cztM0_level2.evt | modeM0/AS1T05_051T01_9000005334_37543cztM0_level2_quad_clean.evt |
| Size (bytes) | 734,863,680 | 119,900,160 |
| Size | 700.8 MB | 114.3 MB |
| Events in quadrant A | 6,883,899 | 758,929 |
| Events in quadrant B | 4,556,081 | 788,990 |
| Events in quadrant C | 4,081,991 | 797,060 |
| Events in quadrant D | 6,188,465 | 726,255 |
| Mode M9 | |||
|---|---|---|---|
| Quadrant | BADHDUFLAG | Total packets | Discarded packets |
| A | 0 | 28 | 3 |
| B | 0 | 27 | 4 |
| C | 0 | 28 | 3 |
| D | 0 | 28 | 3 |
| Mode M0 | |||
|---|---|---|---|
| Quadrant | BADHDUFLAG | Total packets | Discarded packets |
| A | 0 | 33168 | 7437 |
| B | 0 | 22418 | 3644 |
| C | 0 | 20828 | 3608 |
| D | 0 | 29487 | 5723 |
| Mode SS | |||
|---|---|---|---|
| Quadrant | BADHDUFLAG | Total packets | Discarded packets |
| A | 0 | 201 | 29 |
| B | 0 | 201 | 32 |
| C | 0 | 202 | 36 |
| D | 0 | 201 | 27 |
| Quadrant | Total seconds | Saturated seconds | Saturation percentage |
|---|---|---|---|
| A | 7865 | 513 | 6.522568% |
| B | 8154 | 193 | 2.366936% |
| C | 8118 | 32 | 0.394186% |
| D | 7952 | 478 | 6.011066% |
Noise dominated data is calculated using 1-second bins in cleaned event files. If a bin has >2000 counts, and if more than 50% of those come from <1% of pixels, then it is considered to be noise-dominated and hence unusable.
| Quadrant | # 1 sec bins | Bins with >0 counts | Bins with >2000 counts | High rate bins dominated by noise | Noise dominated (total time) | Noise dominated (detector-on time) | Marked lightcurve |
|---|---|---|---|---|---|---|---|
| A | 12665 | 8412 | 391 | 391 | 3.09% | 4.65% | 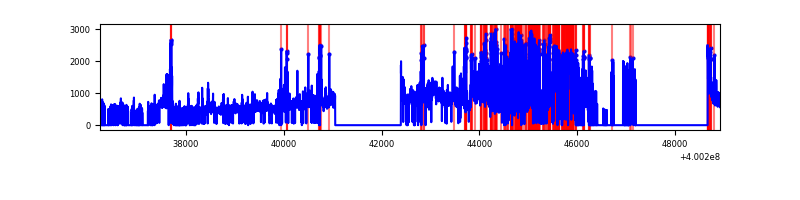 |
| B | 12672 | 8709 | 130 | 130 | 1.03% | 1.49% | 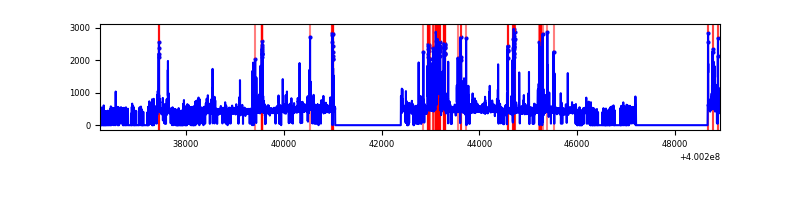 |
| C | 12671 | 8693 | 26 | 26 | 0.21% | 0.30% | 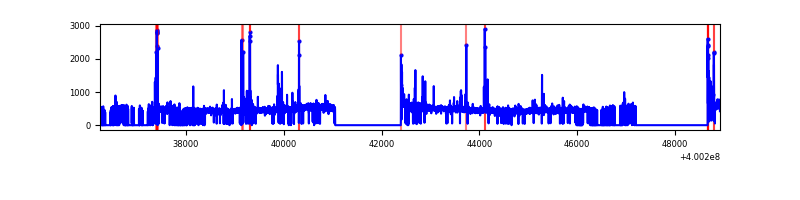 |
| D | 12669 | 8543 | 451 | 451 | 3.56% | 5.28% | 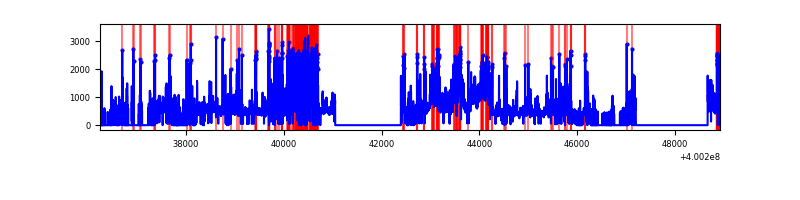 |
Top three noisy pixels from each quadrant. If the there are fewer than three noisy pixels in the level2.evt file, extra rows are filled as -1
| Pixel properties | Quadrant properties | ||||||
|---|---|---|---|---|---|---|---|
| Quadrant | DetID | PixID | Counts | Sigma | Mean | Median | Sigma |
| A | 15 | 222 | 2881925 | 16192.2 | 874 | 857 | 177.9 |
| A | 10 | 83 | 392294 | 2199.96 | 874 | 857 | 177.9 |
| A | 6 | 10 | 124178 | 693.09 | 874 | 857 | 177.9 |
| B | 5 | 172 | 365733 | 2088.81 | 910 | 887 | 174.7 |
| B | 4 | 81 | 151358 | 861.47 | 910 | 887 | 174.7 |
| B | 0 | 245 | 137067 | 779.66 | 910 | 887 | 174.7 |
| C | 15 | 214 | 346941 | 1676.84 | 887 | 894 | 206.4 |
| C | 14 | 254 | 137534 | 662.12 | 887 | 894 | 206.4 |
| C | 0 | 10 | 59668 | 284.8 | 887 | 894 | 206.4 |
| D | 2 | 249 | 1178800 | 5709.19 | 844 | 822 | 206.3 |
| D | 12 | 235 | 889640 | 4307.75 | 844 | 822 | 206.3 |
| D | 12 | 233 | 183226 | 884.04 | 844 | 822 | 206.3 |
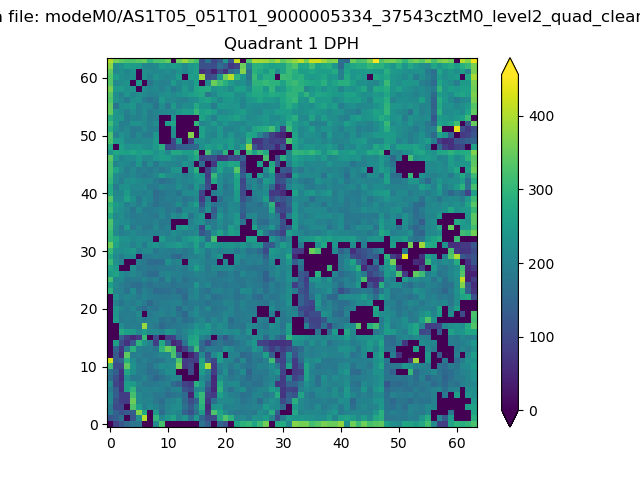
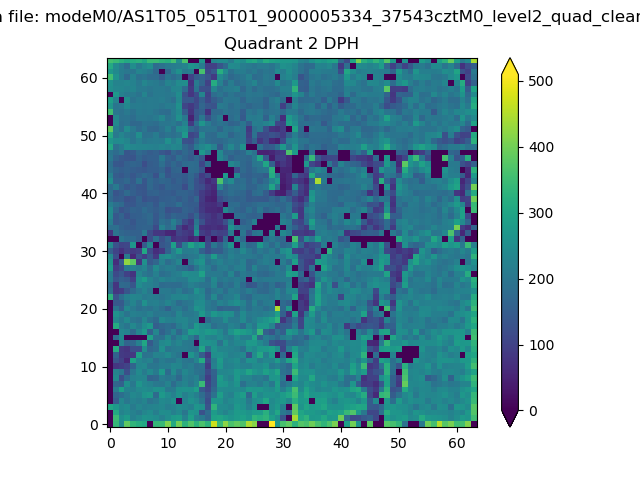
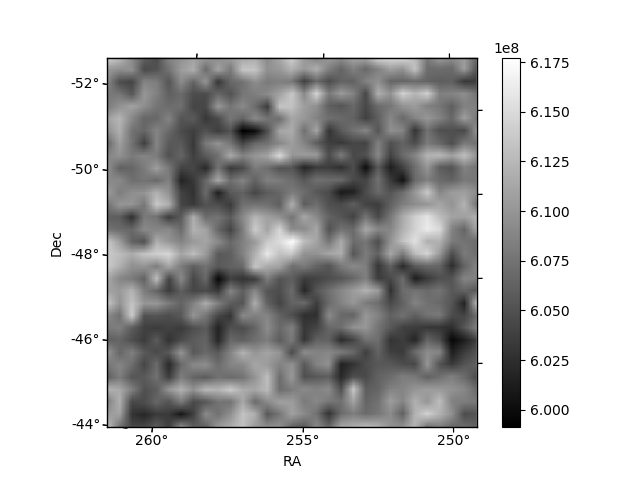
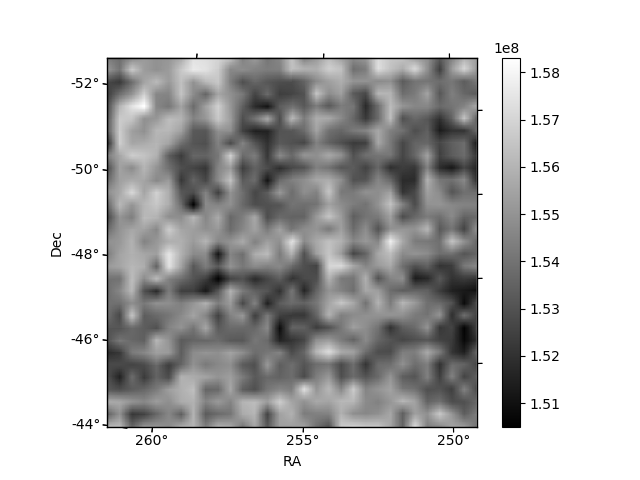
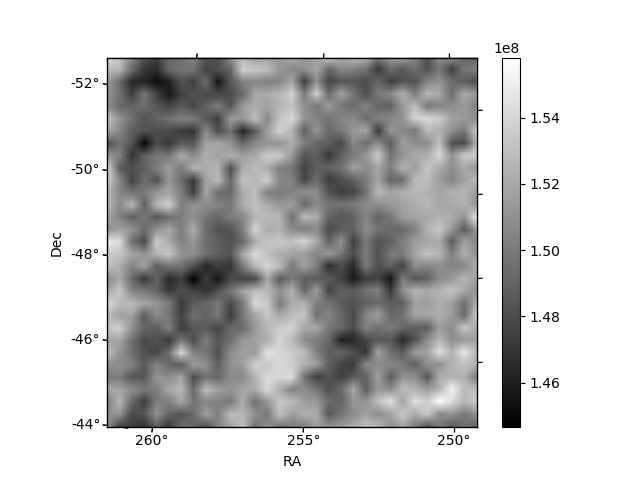
Histogram calculated using DETX and DETY for each event in the final _common_clean file
| Quadrant A |  |
 |
Quadrant B |
|---|---|---|---|
| Quadrant D | 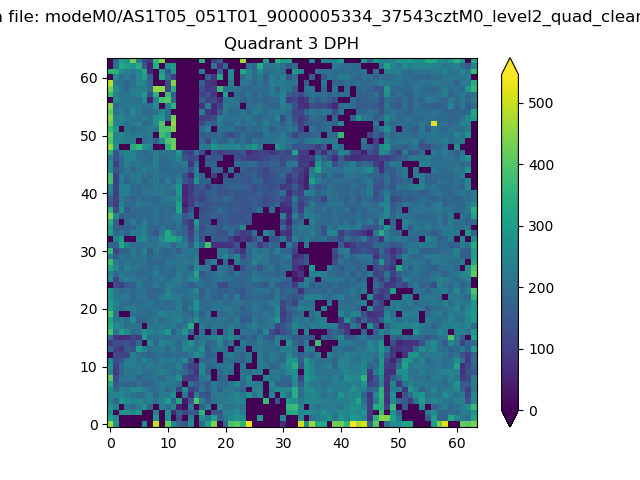 |
 |
Quadrant C |
| Plot type | Count rate plots | Images |
|---|---|---|
| Comparison with Poisson distribution Blue bars denote a histogram of data divided into 1 sec bins. Red curve is a Poisson curve with rate = median count rate of data. |
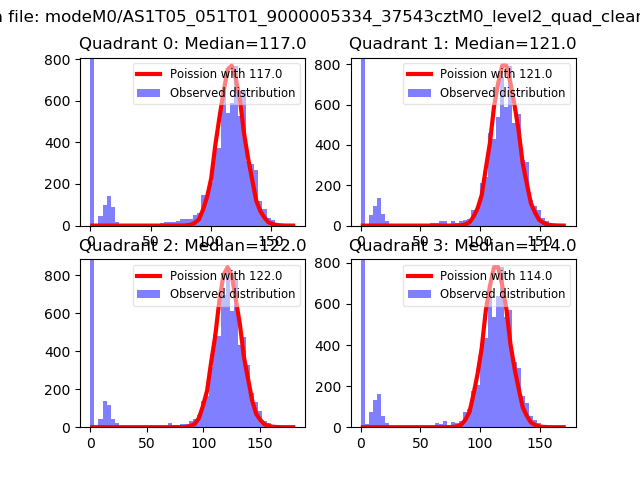 |
 |
| Quadrant-wise count rates Data is divided into 100 sec bins |
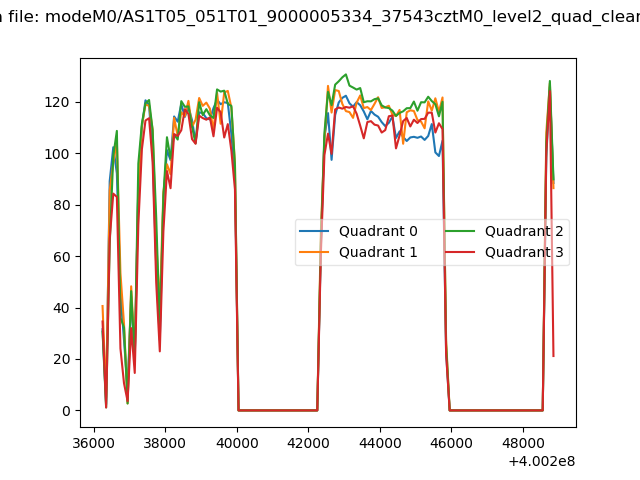 |
|
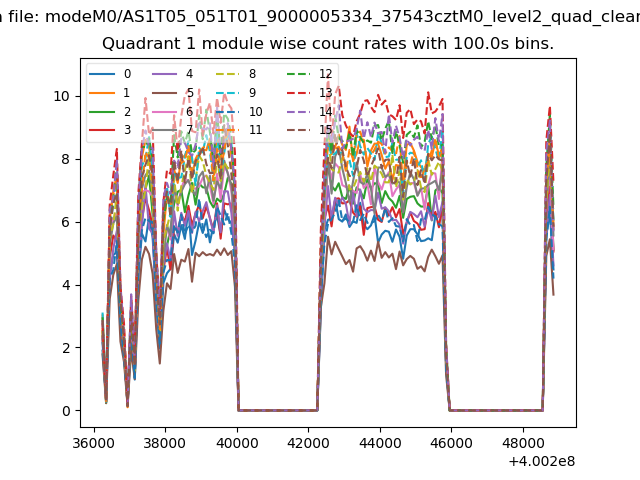
| Module-wise count rates for Quadrant A Data is divided into 100 sec bins |
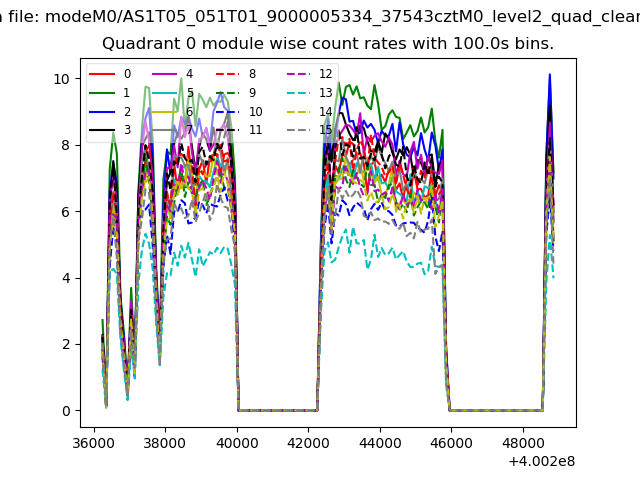 |
 |
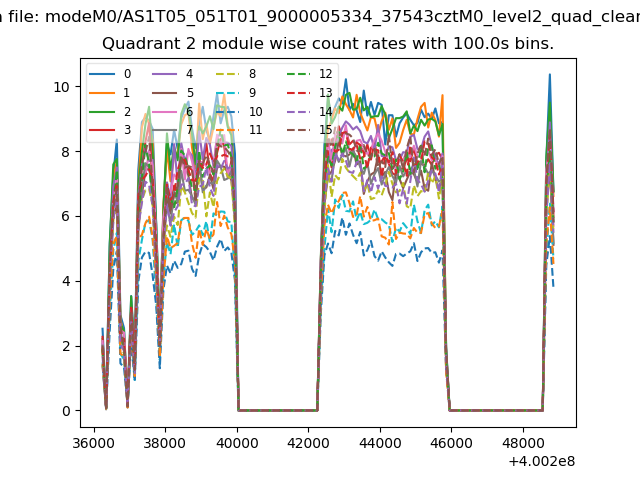
| Module-wise count rates for Quadrant B Data is divided into 100 sec bins |
 |
 |
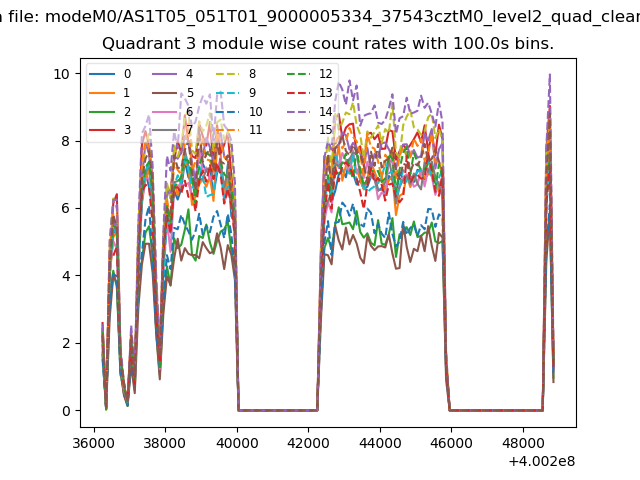
| Module-wise count rates for Quadrant C Data is divided into 100 sec bins |
 |
 |
| Module-wise count rates for Quadrant D Data is divided into 100 sec bins |
 |
 |
| Parameter | Plot |
|---|---|
| CZT HV Monitor | 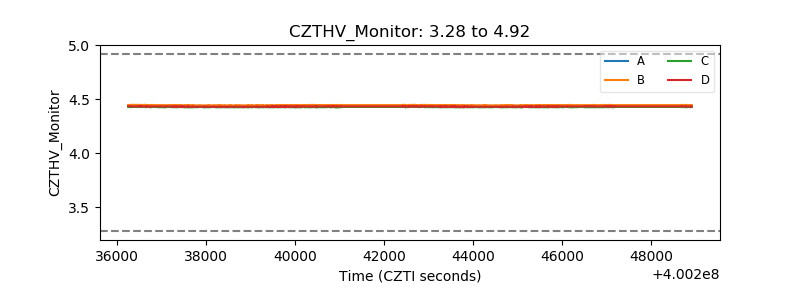 |
| D_VDD | 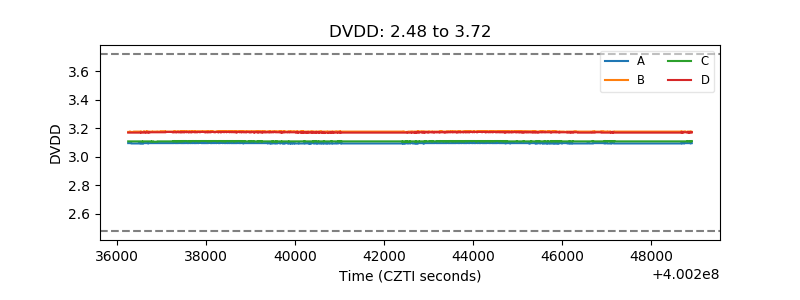 |
| Temperature 1 | 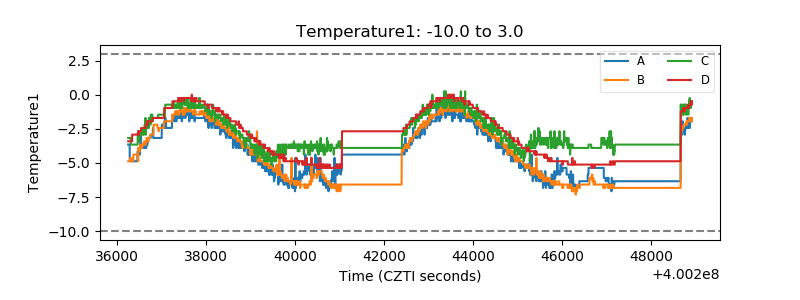 |
| Veto HV Monitor | 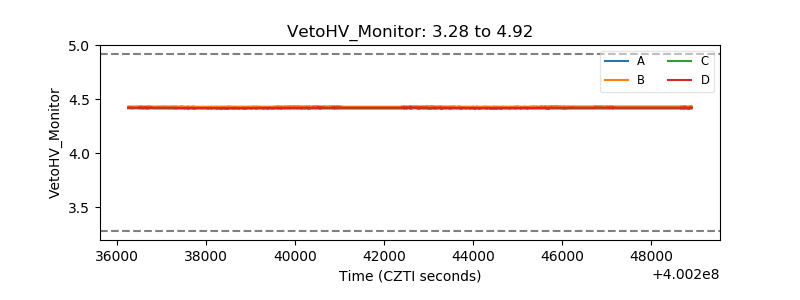 |
| Veto LLD | 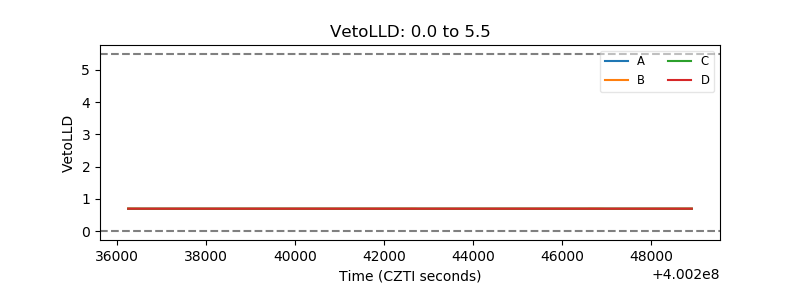 |
| Alpha Counter | 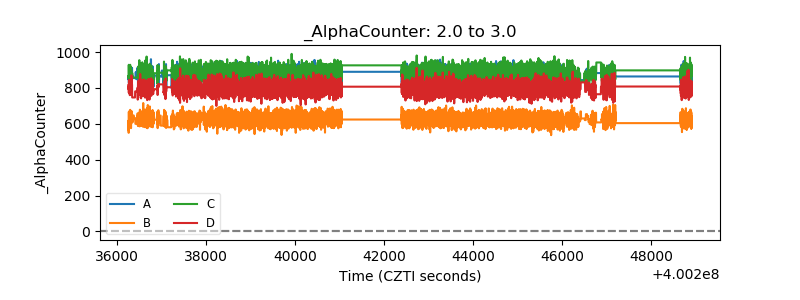 |
| _CPM_Rate | 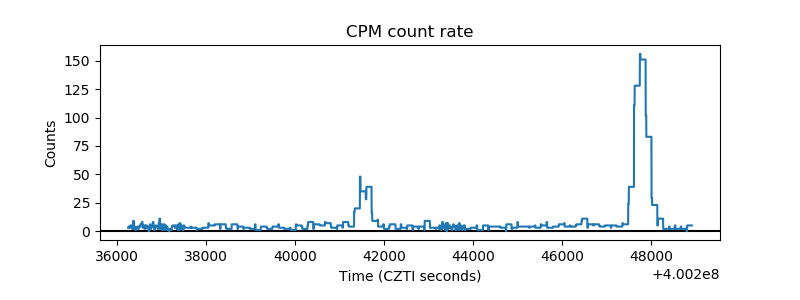 |
| CZT Counter | 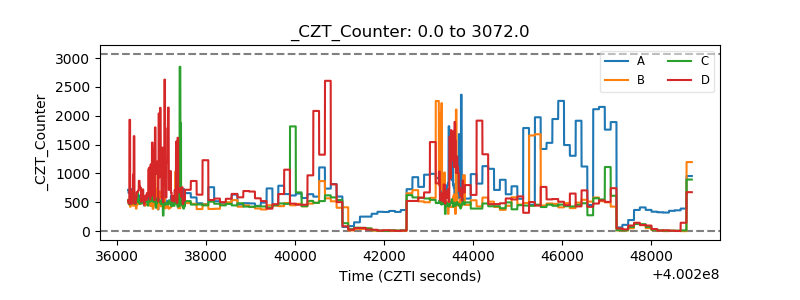 |
| +2.5 Volts monitor | 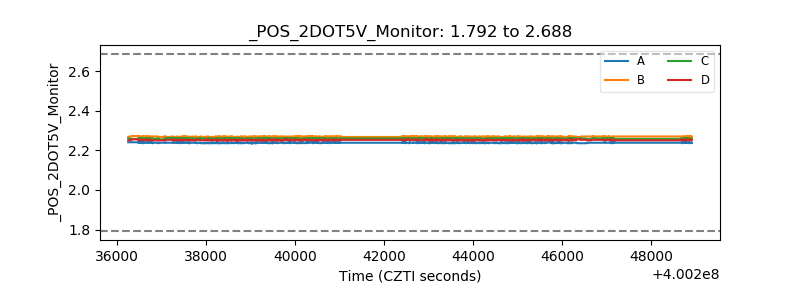 |
| +5 Volts monitor | 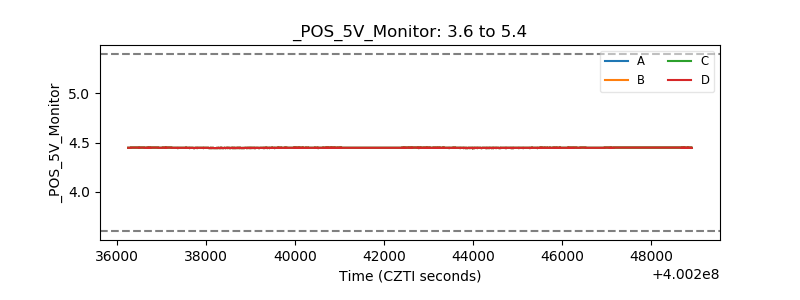 |
| _ROLL_ROT | 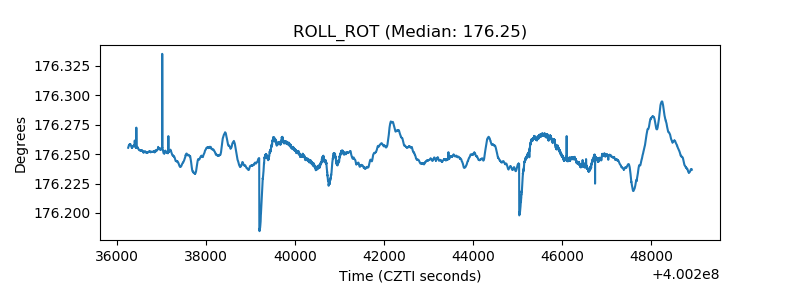 |
| _Roll_DEC | 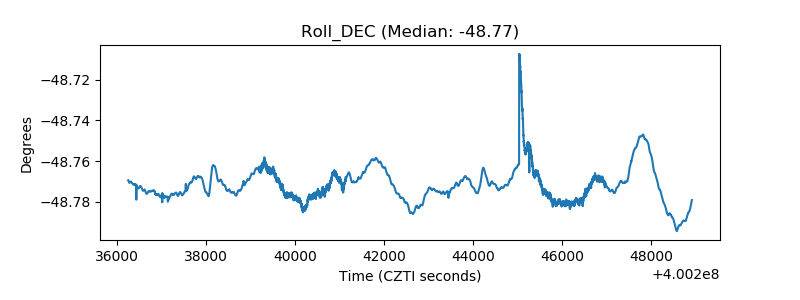 |
| _Roll_RA | 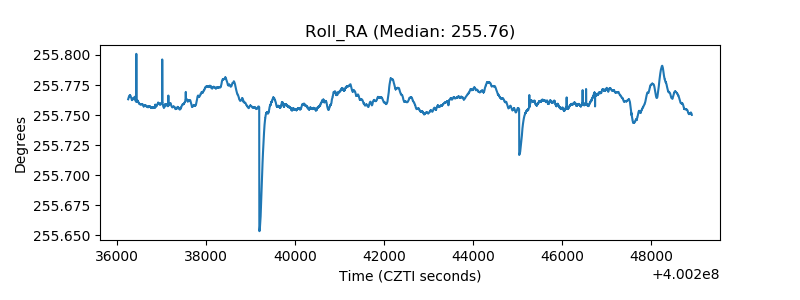 |
| Veto Counter | 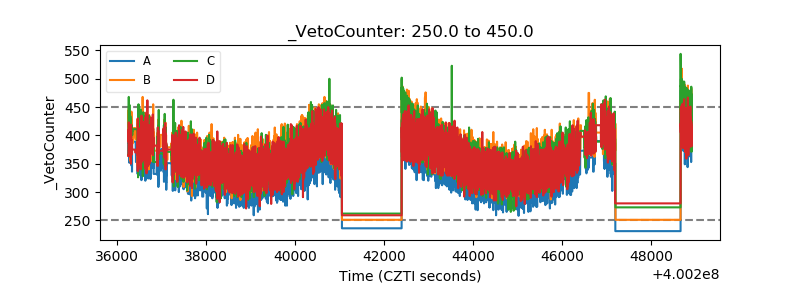 |