| Param | Original file | Final file |
|---|---|---|
| Filename | modeM0/AS1T05_051T01_9000005334_37544cztM0_level2.evt | modeM0/AS1T05_051T01_9000005334_37544cztM0_level2_quad_clean.evt |
| Size (bytes) | 493,214,400 | 76,898,880 |
| Size | 470.4 MB | 73.3 MB |
| Events in quadrant A | 4,033,181 | 486,898 |
| Events in quadrant B | 3,295,705 | 492,732 |
| Events in quadrant C | 3,112,223 | 495,055 |
| Events in quadrant D | 4,112,760 | 458,498 |
| Mode M9 | |||
|---|---|---|---|
| Quadrant | BADHDUFLAG | Total packets | Discarded packets |
| A | 0 | 16 | 0 |
| B | 0 | 16 | 0 |
| C | 0 | 16 | 0 |
| D | 0 | 16 | 0 |
| Mode M0 | |||
|---|---|---|---|
| Quadrant | BADHDUFLAG | Total packets | Discarded packets |
| A | 0 | 15688 | 3 |
| B | 0 | 13411 | 2 |
| C | 0 | 12792 | 2 |
| D | 0 | 16028 | 2 |
| Mode SS | |||
|---|---|---|---|
| Quadrant | BADHDUFLAG | Total packets | Discarded packets |
| A | 0 | 114 | 0 |
| B | 0 | 114 | 0 |
| C | 0 | 114 | 0 |
| D | 0 | 114 | 0 |
| Quadrant | Total seconds | Saturated seconds | Saturation percentage |
|---|---|---|---|
| A | 5655 | 73 | 1.290893% |
| B | 5655 | 128 | 2.263484% |
| C | 5655 | 73 | 1.290893% |
| D | 5656 | 276 | 4.879774% |
Noise dominated data is calculated using 1-second bins in cleaned event files. If a bin has >2000 counts, and if more than 50% of those come from <1% of pixels, then it is considered to be noise-dominated and hence unusable.
| Quadrant | # 1 sec bins | Bins with >0 counts | Bins with >2000 counts | High rate bins dominated by noise | Noise dominated (total time) | Noise dominated (detector-on time) | Marked lightcurve |
|---|---|---|---|---|---|---|---|
| A | 7239 | 5656 | 43 | 43 | 0.59% | 0.76% | 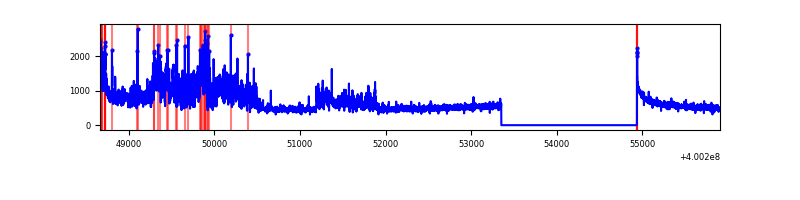 |
| B | 7239 | 5656 | 82 | 82 | 1.13% | 1.45% | 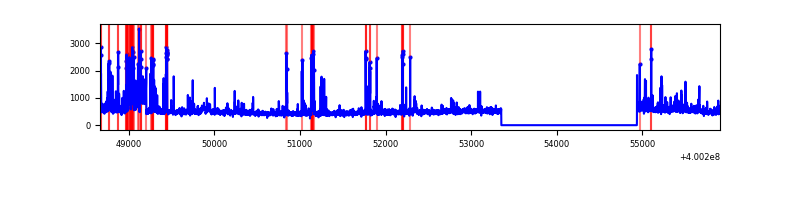 |
| C | 7239 | 5656 | 69 | 69 | 0.95% | 1.22% | 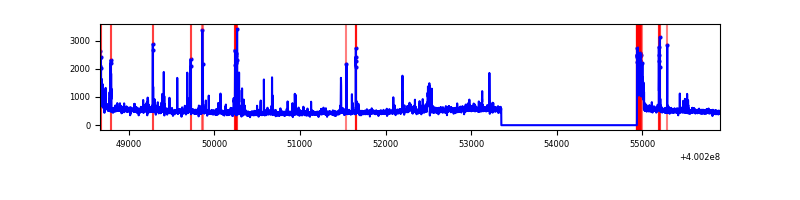 |
| D | 7240 | 5657 | 251 | 251 | 3.47% | 4.44% | 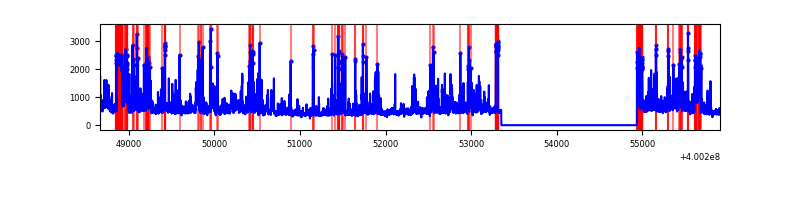 |
Top three noisy pixels from each quadrant. If the there are fewer than three noisy pixels in the level2.evt file, extra rows are filled as -1
| Pixel properties | Quadrant properties | ||||||
|---|---|---|---|---|---|---|---|
| Quadrant | DetID | PixID | Counts | Sigma | Mean | Median | Sigma |
| A | 15 | 222 | 913575 | 6901.9 | 646 | 632 | 132.3 |
| A | 10 | 83 | 331193 | 2499.06 | 646 | 632 | 132.3 |
| A | 6 | 10 | 245288 | 1849.61 | 646 | 632 | 132.3 |
| B | 5 | 255 | 285099 | 2299.53 | 640 | 623 | 123.7 |
| B | 5 | 172 | 145955 | 1174.78 | 640 | 623 | 123.7 |
| B | 4 | 81 | 66168 | 529.83 | 640 | 623 | 123.7 |
| C | 15 | 214 | 244292 | 1673.78 | 624 | 628 | 145.6 |
| C | 14 | 254 | 217811 | 1491.88 | 624 | 628 | 145.6 |
| C | 0 | 10 | 134591 | 920.22 | 624 | 628 | 145.6 |
| D | 2 | 249 | 470555 | 3117.52 | 610 | 591 | 150.7 |
| D | 12 | 235 | 293184 | 1940.92 | 610 | 591 | 150.7 |
| D | 10 | 199 | 201468 | 1332.52 | 610 | 591 | 150.7 |
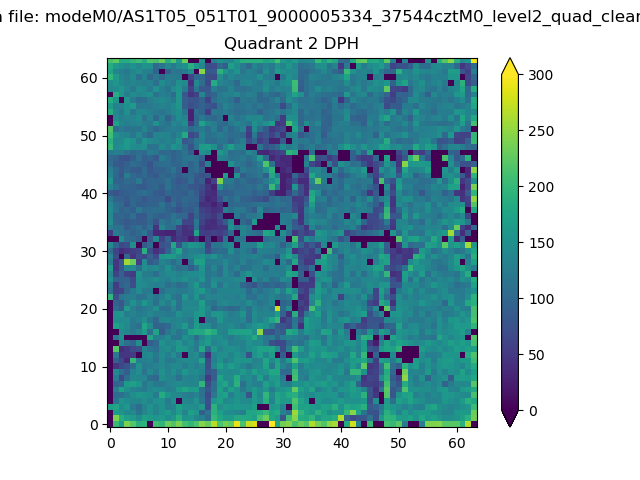
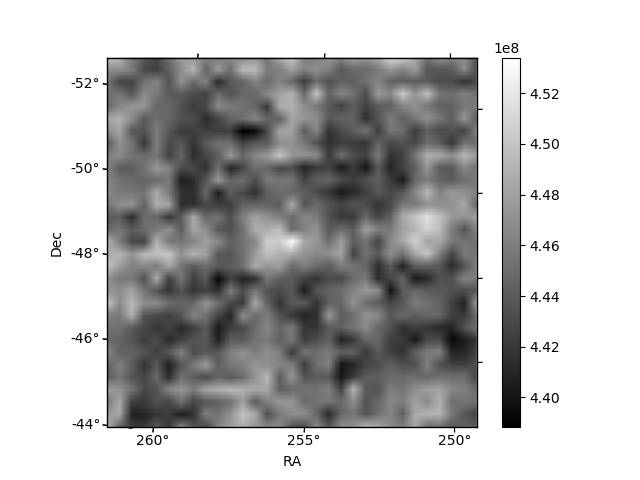
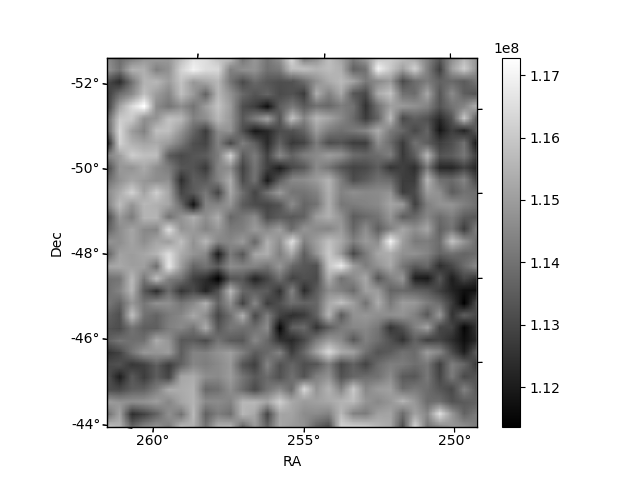
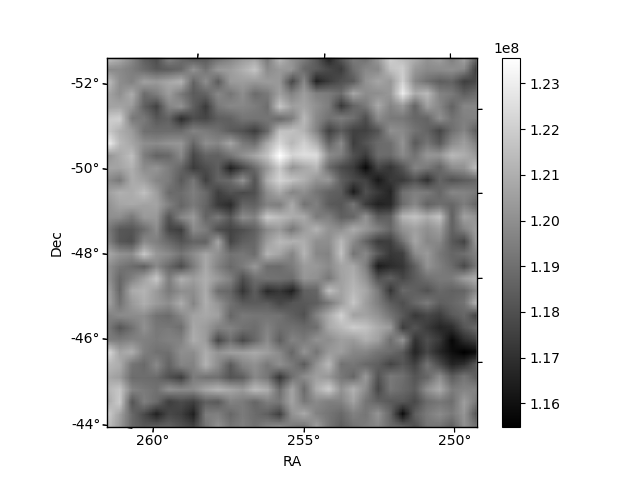
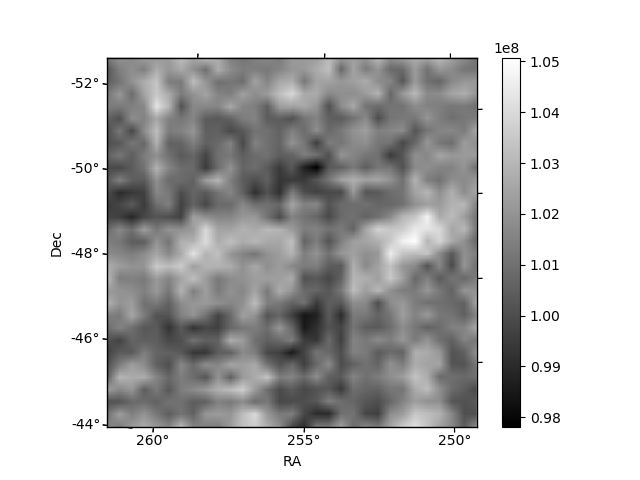
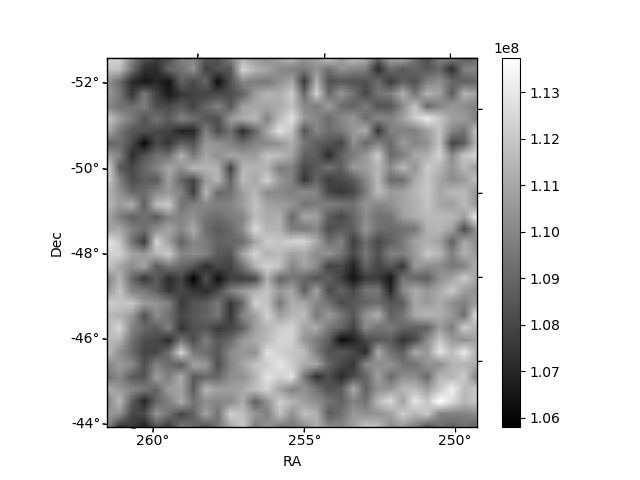
Histogram calculated using DETX and DETY for each event in the final _common_clean file
| Quadrant A | 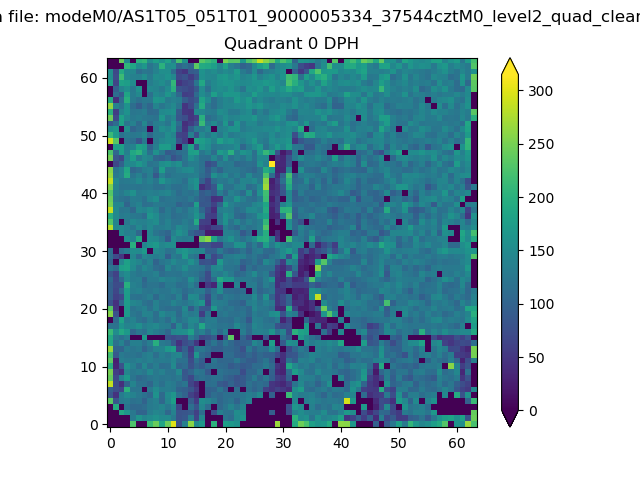 |
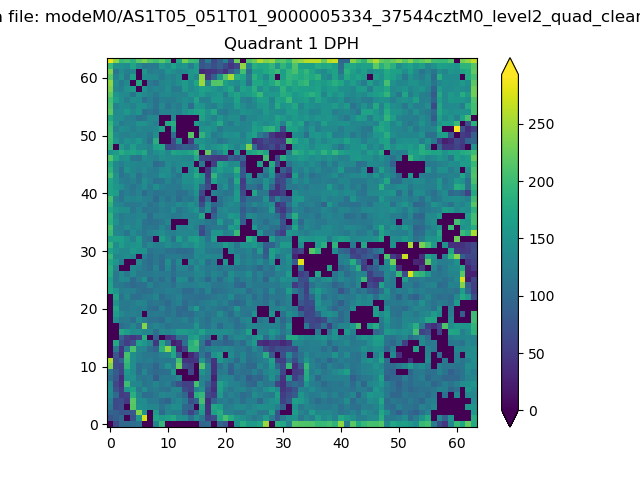 |
Quadrant B |
|---|---|---|---|
| Quadrant D | 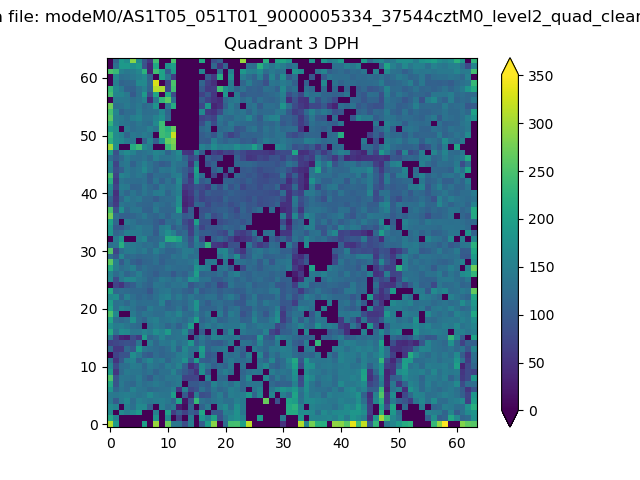 |
 |
Quadrant C |
| Plot type | Count rate plots | Images |
|---|---|---|
| Comparison with Poisson distribution Blue bars denote a histogram of data divided into 1 sec bins. Red curve is a Poisson curve with rate = median count rate of data. |
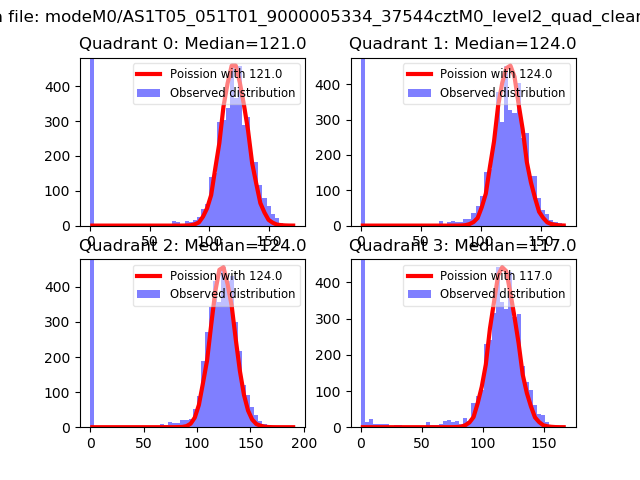 |
 |
| Quadrant-wise count rates Data is divided into 100 sec bins |
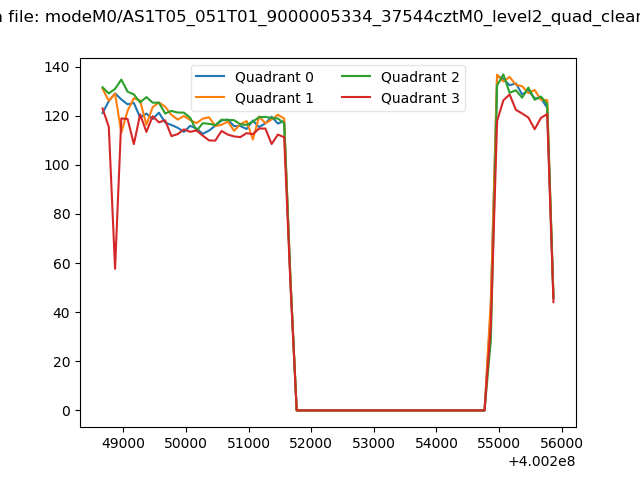 |
|
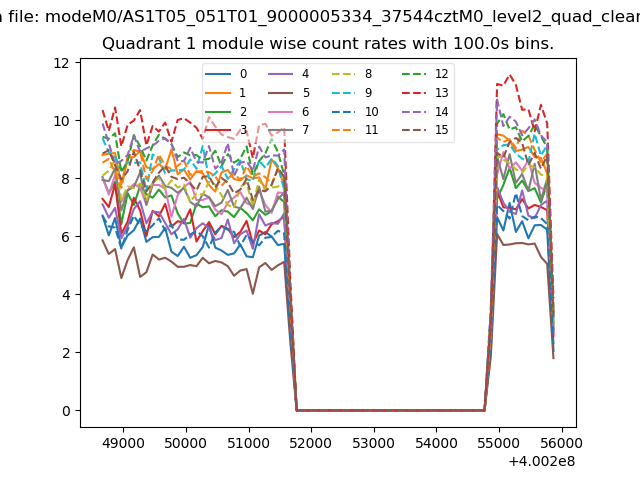
| Module-wise count rates for Quadrant A Data is divided into 100 sec bins |
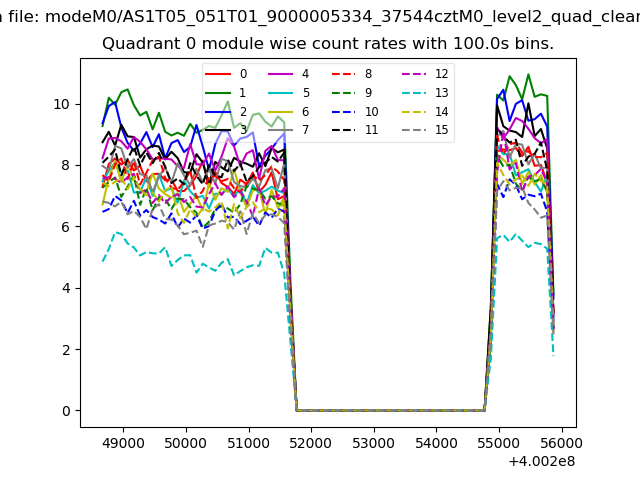 |
 |
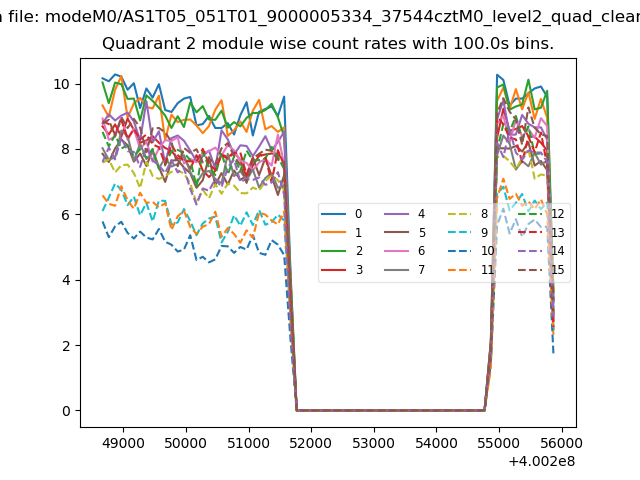
| Module-wise count rates for Quadrant B Data is divided into 100 sec bins |
 |
 |
| Module-wise count rates for Quadrant C Data is divided into 100 sec bins |
 |
 |
| Module-wise count rates for Quadrant D Data is divided into 100 sec bins |
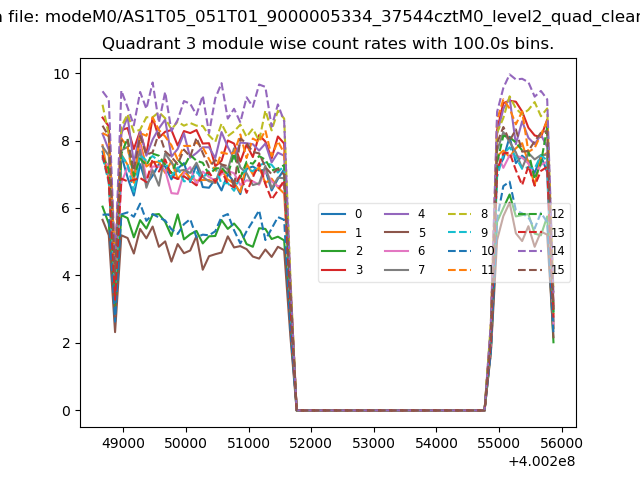 |
 |
| Parameter | Plot |
|---|---|
| CZT HV Monitor | 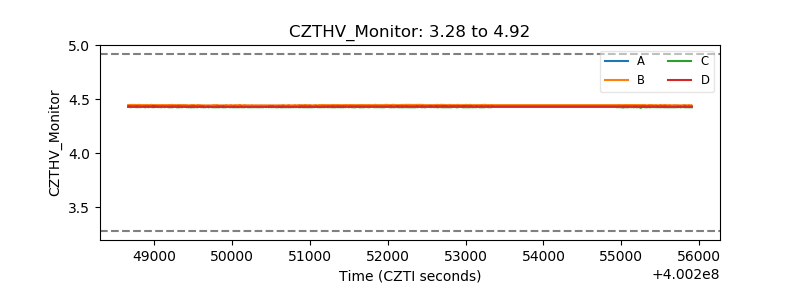 |
| D_VDD | 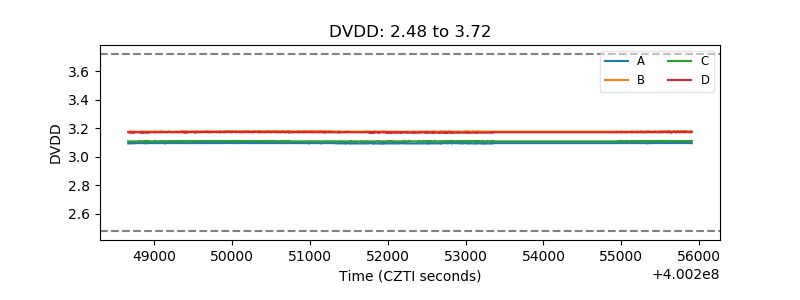 |
| Temperature 1 | 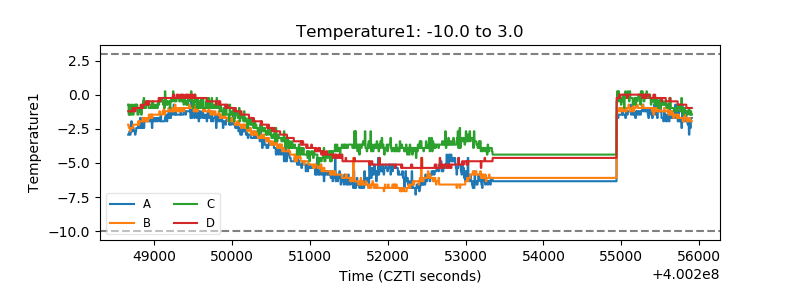 |
| Veto HV Monitor | 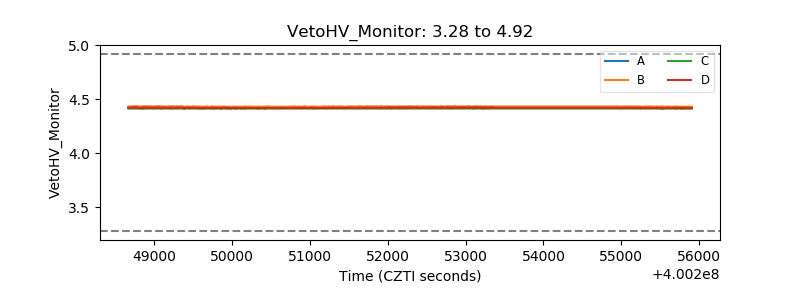 |
| Veto LLD | 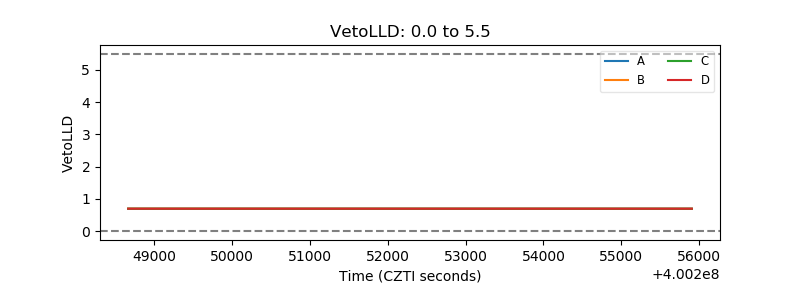 |
| Alpha Counter | 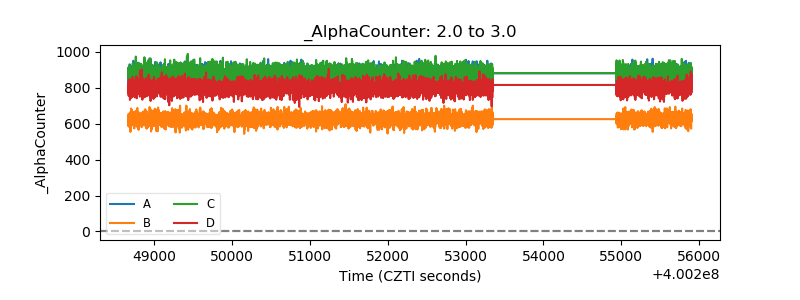 |
| _CPM_Rate | 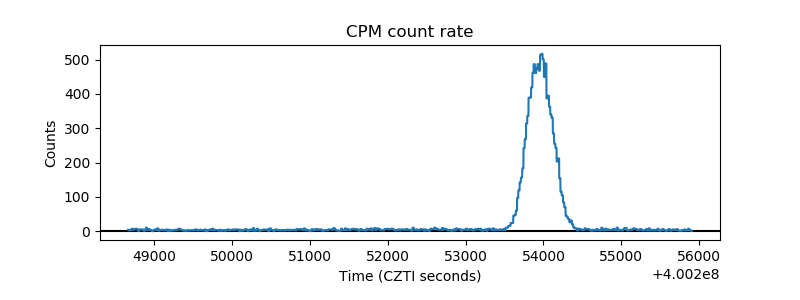 |
| CZT Counter | 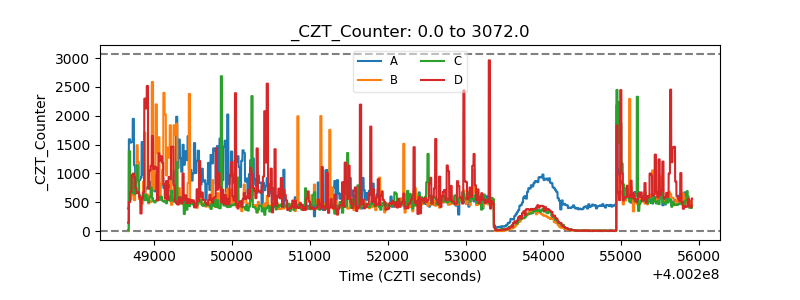 |
| +2.5 Volts monitor | 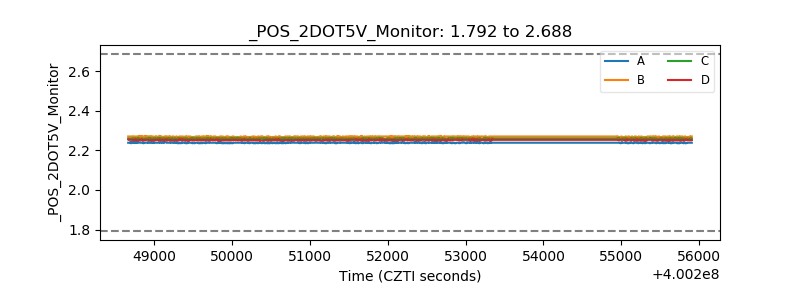 |
| +5 Volts monitor | 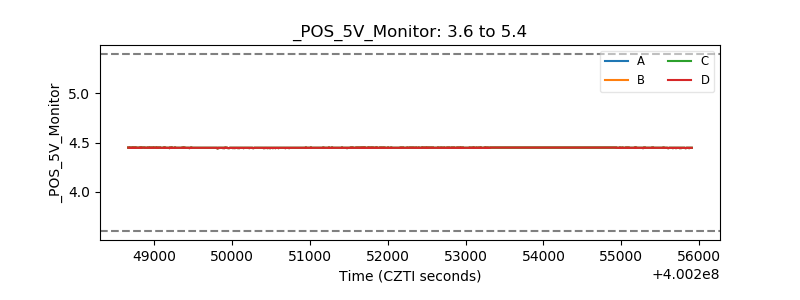 |
| _ROLL_ROT | 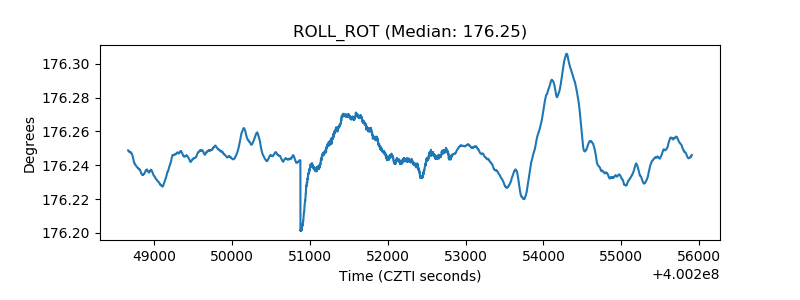 |
| _Roll_DEC | 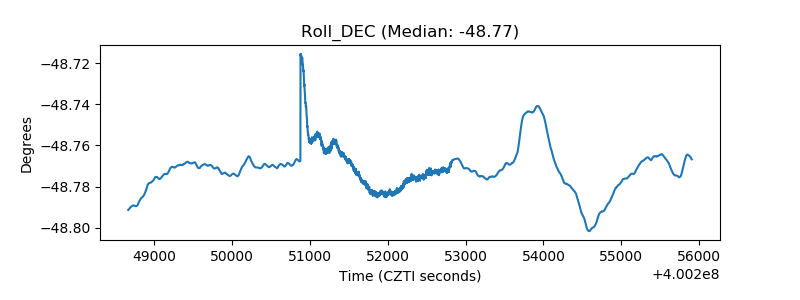 |
| _Roll_RA | 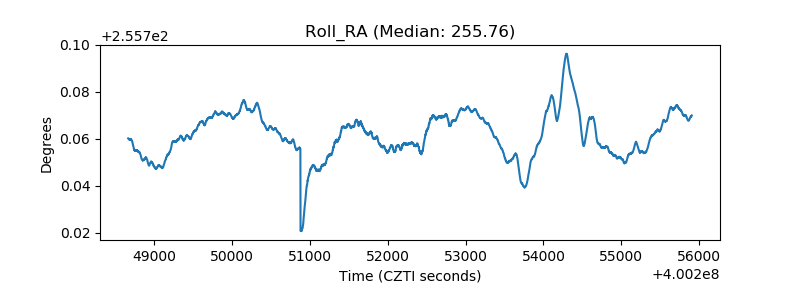 |
| Veto Counter | 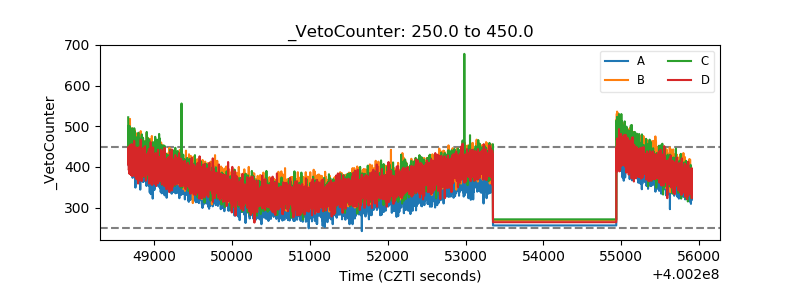 |