| Param | Original file | Final file |
|---|---|---|
| Filename | modeM0/AS1T05_051T01_9000005334_37545cztM0_level2.evt | modeM0/AS1T05_051T01_9000005334_37545cztM0_level2_quad_clean.evt |
| Size (bytes) | 1,710,074,880 | 251,717,760 |
| Size | 1.6 GB | 240.1 MB |
| Events in quadrant A | 14,707,331 | 1,577,305 |
| Events in quadrant B | 10,929,397 | 1,608,004 |
| Events in quadrant C | 10,131,487 | 1,616,289 |
| Events in quadrant D | 14,734,642 | 1,504,960 |
| Mode M9 | |||
|---|---|---|---|
| Quadrant | BADHDUFLAG | Total packets | Discarded packets |
| A | 0 | 61 | 0 |
| B | 0 | 61 | 0 |
| C | 0 | 61 | 0 |
| D | 0 | 61 | 0 |
| Mode M0 | |||
|---|---|---|---|
| Quadrant | BADHDUFLAG | Total packets | Discarded packets |
| A | 0 | 56243 | 8 |
| B | 0 | 44773 | 4 |
| C | 0 | 42070 | 4 |
| D | 0 | 56739 | 4 |
| Mode SS | |||
|---|---|---|---|
| Quadrant | BADHDUFLAG | Total packets | Discarded packets |
| A | 0 | 390 | 0 |
| B | 0 | 390 | 0 |
| C | 0 | 390 | 0 |
| D | 0 | 390 | 0 |
| Quadrant | Total seconds | Saturated seconds | Saturation percentage |
|---|---|---|---|
| A | 19116 | 893 | 4.671479% |
| B | 19117 | 494 | 2.584087% |
| C | 19117 | 191 | 0.999111% |
| D | 19117 | 1067 | 5.581420% |
Noise dominated data is calculated using 1-second bins in cleaned event files. If a bin has >2000 counts, and if more than 50% of those come from <1% of pixels, then it is considered to be noise-dominated and hence unusable.
| Quadrant | # 1 sec bins | Bins with >0 counts | Bins with >2000 counts | High rate bins dominated by noise | Noise dominated (total time) | Noise dominated (detector-on time) | Marked lightcurve |
|---|---|---|---|---|---|---|---|
| A | 25211 | 19121 | 650 | 650 | 2.58% | 3.40% | 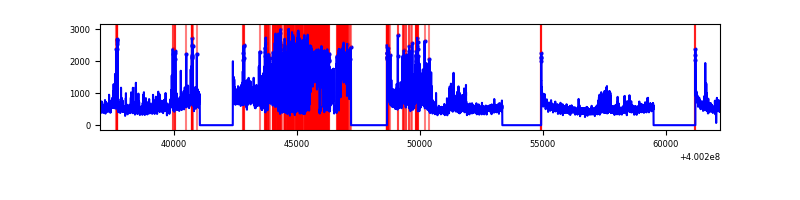 |
| B | 25211 | 19121 | 359 | 359 | 1.42% | 1.88% | 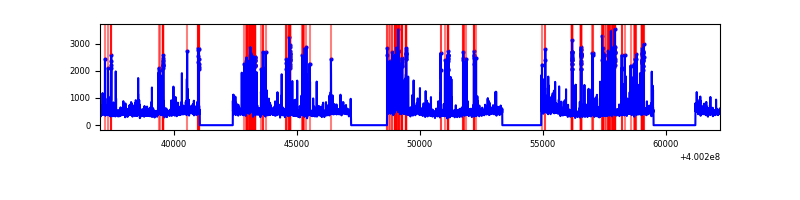 |
| C | 25211 | 19121 | 199 | 199 | 0.79% | 1.04% | 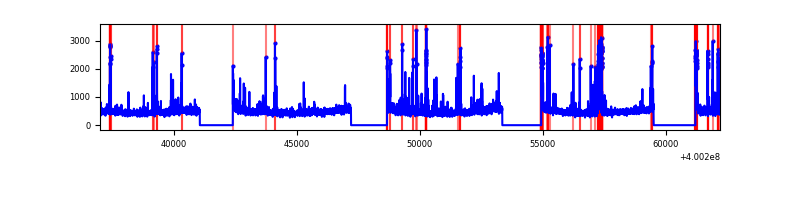 |
| D | 25211 | 19121 | 1072 | 1072 | 4.25% | 5.61% | 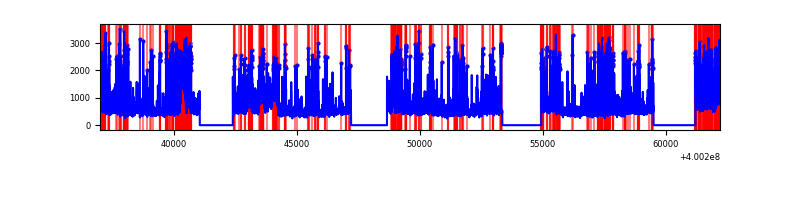 |
Top three noisy pixels from each quadrant. If the there are fewer than three noisy pixels in the level2.evt file, extra rows are filled as -1
| Pixel properties | Quadrant properties | ||||||
|---|---|---|---|---|---|---|---|
| Quadrant | DetID | PixID | Counts | Sigma | Mean | Median | Sigma |
| A | 15 | 222 | 4569694 | 10549.87 | 2142 | 2102 | 433.0 |
| A | 10 | 83 | 927043 | 2136.36 | 2142 | 2102 | 433.0 |
| A | 6 | 10 | 739889 | 1704.08 | 2142 | 2102 | 433.0 |
| B | 5 | 172 | 682904 | 1675.22 | 2141 | 2085 | 406.4 |
| B | 5 | 255 | 446412 | 1093.31 | 2141 | 2085 | 406.4 |
| B | 0 | 221 | 400588 | 980.55 | 2141 | 2085 | 406.4 |
| C | 15 | 214 | 812243 | 1668.0 | 2093 | 2107 | 485.7 |
| C | 14 | 254 | 642422 | 1318.35 | 2093 | 2107 | 485.7 |
| C | 0 | 10 | 279433 | 570.99 | 2093 | 2107 | 485.7 |
| D | 2 | 249 | 2353906 | 4736.72 | 2045 | 1989 | 496.5 |
| D | 12 | 235 | 2046835 | 4118.28 | 2045 | 1989 | 496.5 |
| D | 12 | 233 | 509349 | 1021.81 | 2045 | 1989 | 496.5 |
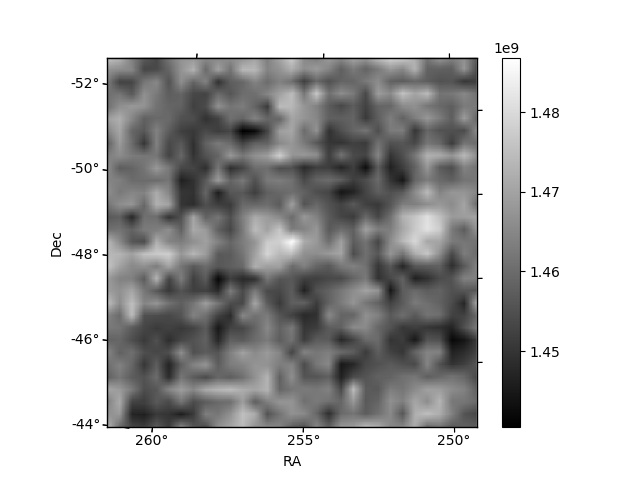
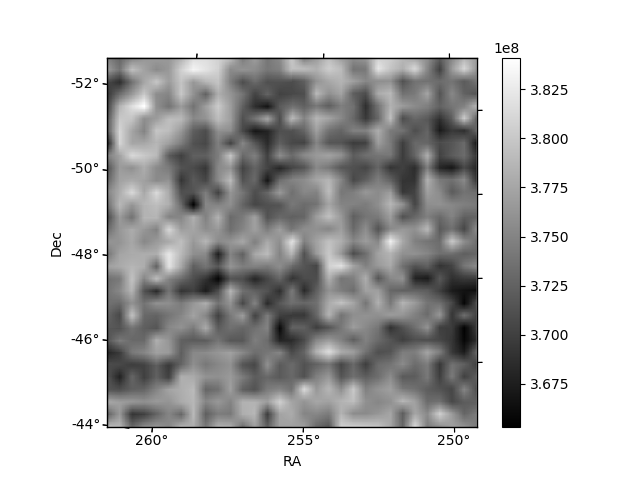
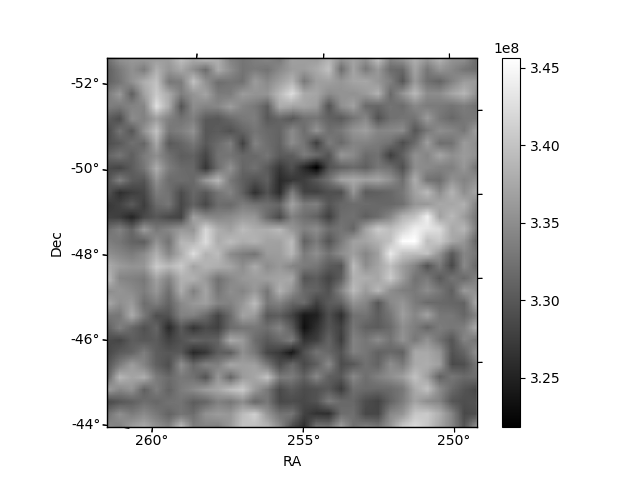
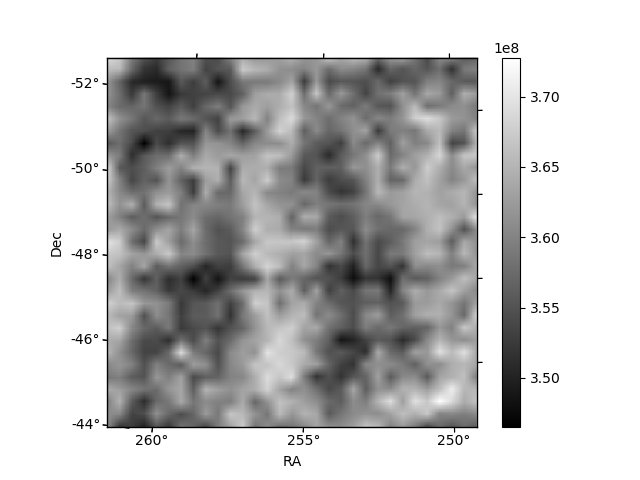
Histogram calculated using DETX and DETY for each event in the final _common_clean file
| Quadrant A | 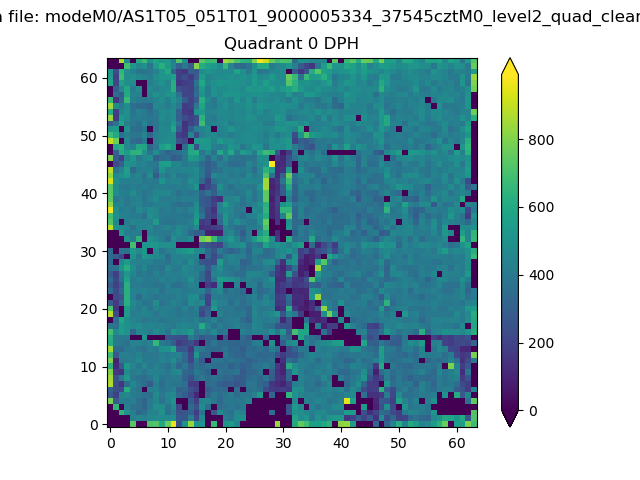 |
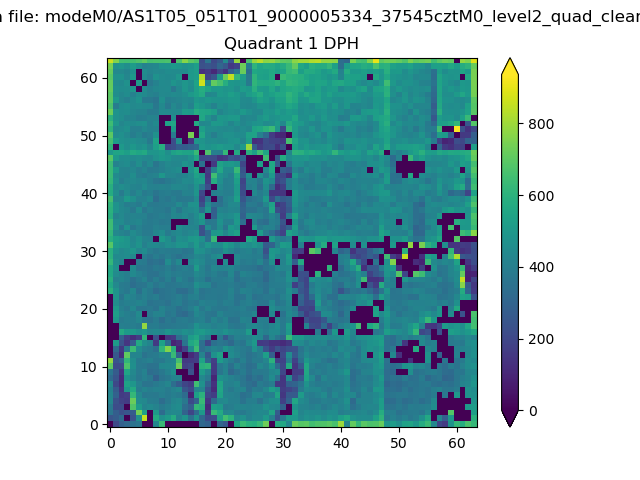 |
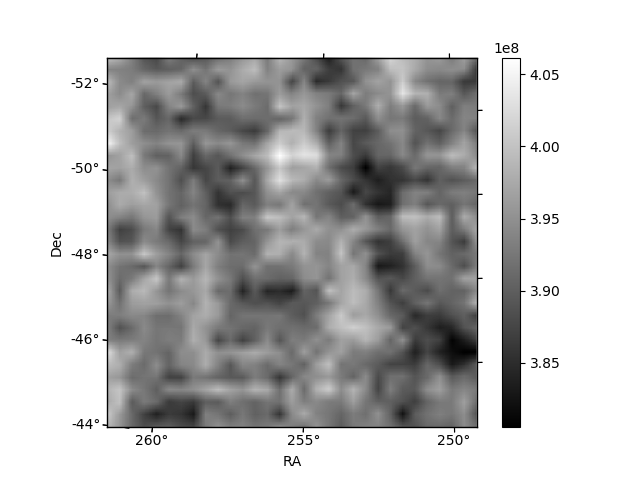
Quadrant B |
|---|---|---|---|
| Quadrant D | 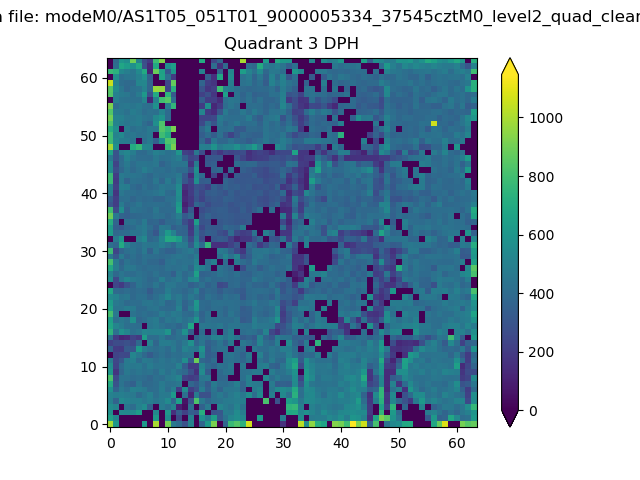 |
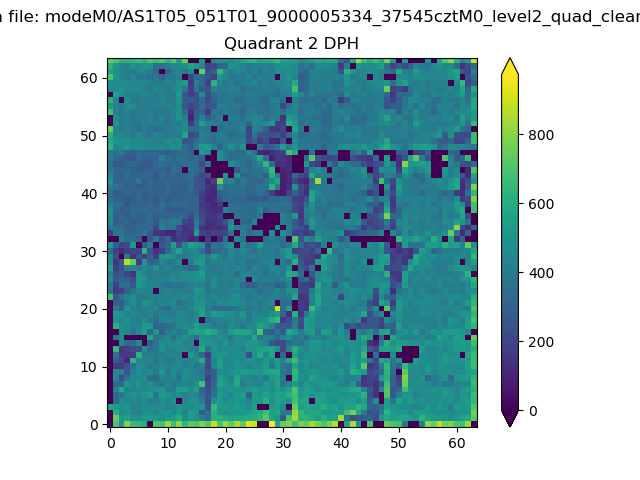 |
Quadrant C |
| Plot type | Count rate plots | Images |
|---|---|---|
| Comparison with Poisson distribution Blue bars denote a histogram of data divided into 1 sec bins. Red curve is a Poisson curve with rate = median count rate of data. |
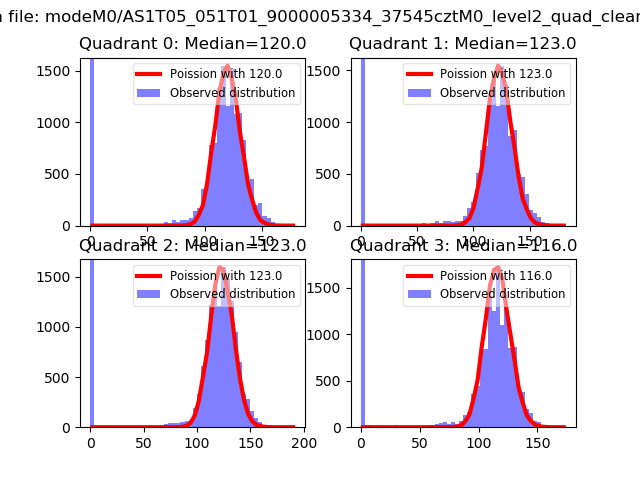 |
 |
| Quadrant-wise count rates Data is divided into 100 sec bins |
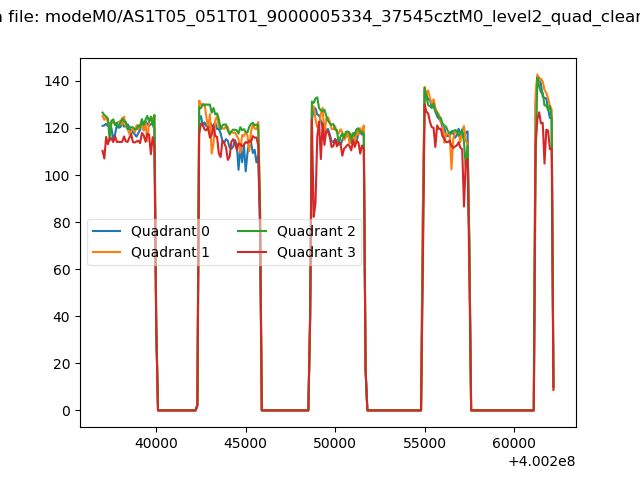 |
|
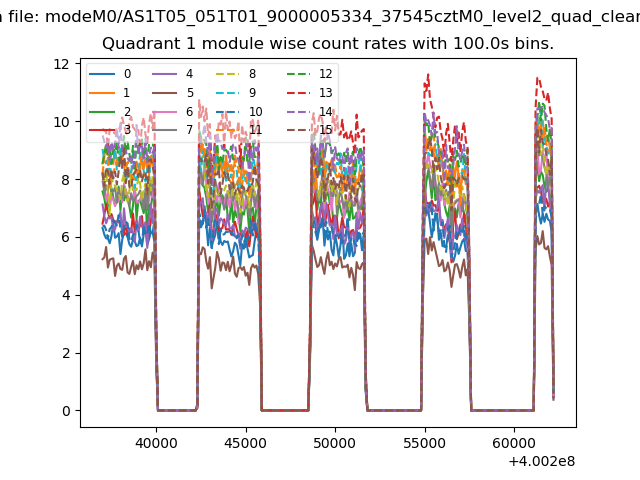
| Module-wise count rates for Quadrant A Data is divided into 100 sec bins |
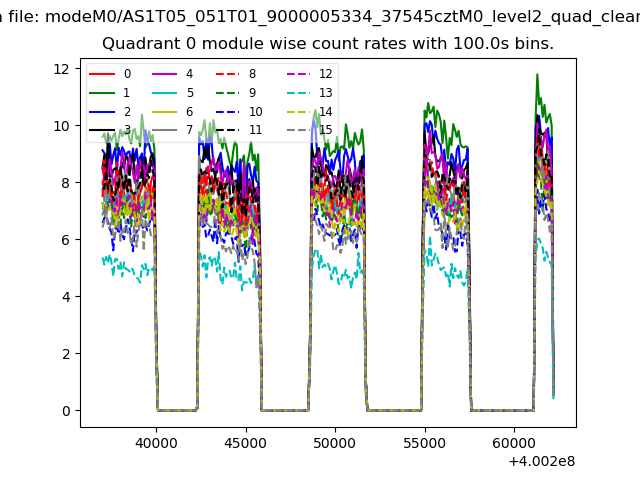 |
 |
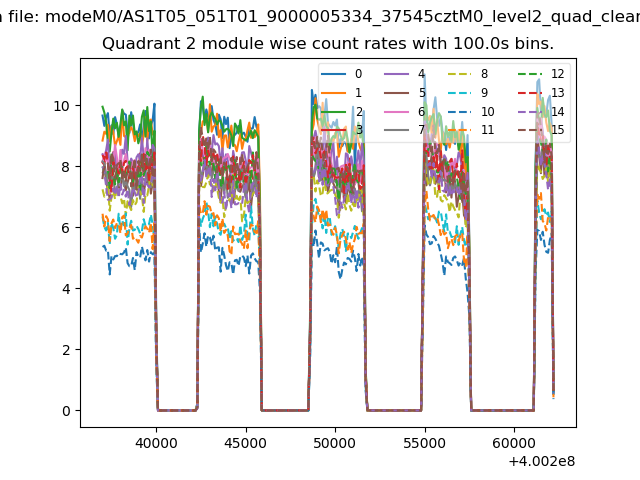
| Module-wise count rates for Quadrant B Data is divided into 100 sec bins |
 |
 |
| Module-wise count rates for Quadrant C Data is divided into 100 sec bins |
 |
 |
| Module-wise count rates for Quadrant D Data is divided into 100 sec bins |
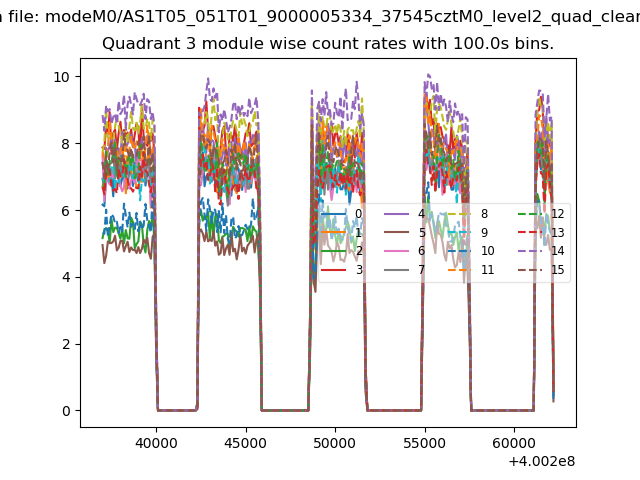 |
 |
| Parameter | Plot |
|---|---|
| CZT HV Monitor | 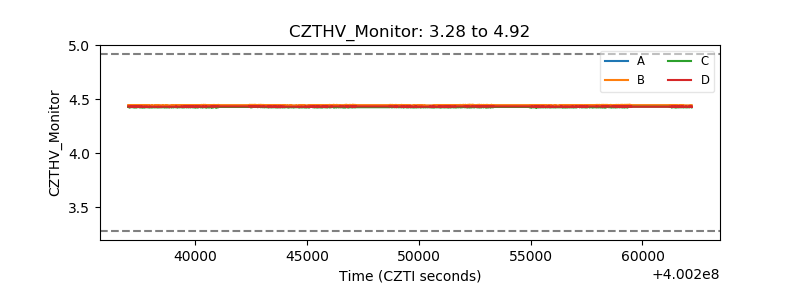 |
| D_VDD | 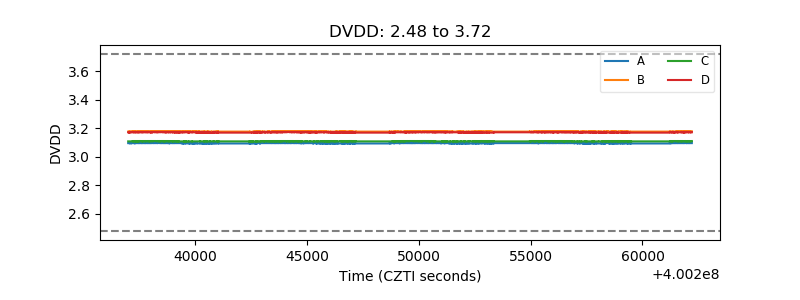 |
| Temperature 1 | 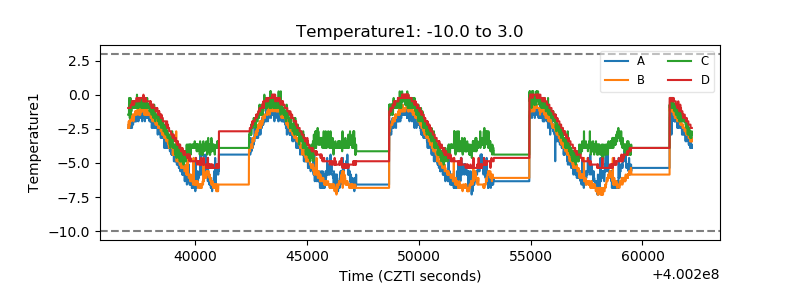 |
| Veto HV Monitor | 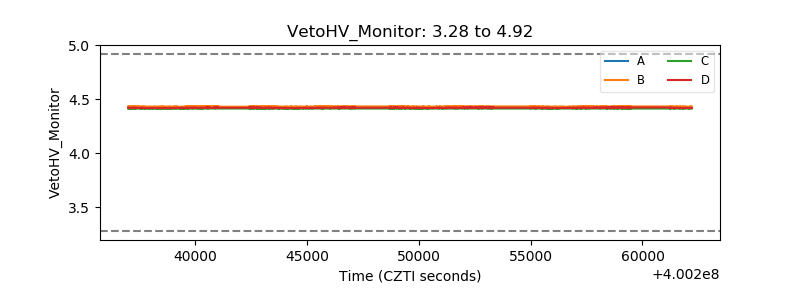 |
| Veto LLD | 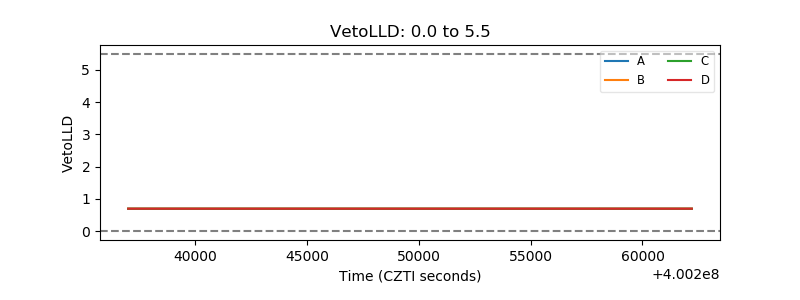 |
| Alpha Counter | 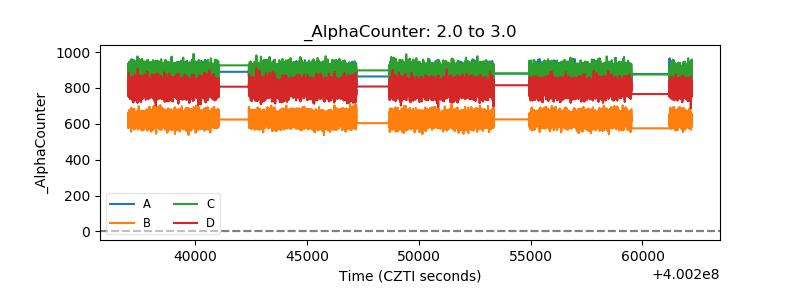 |
| _CPM_Rate | 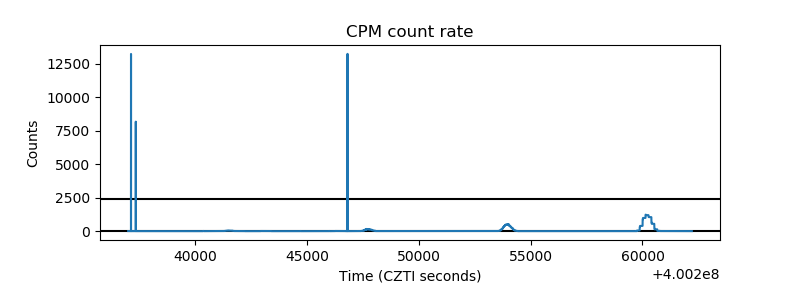 |
| CZT Counter | 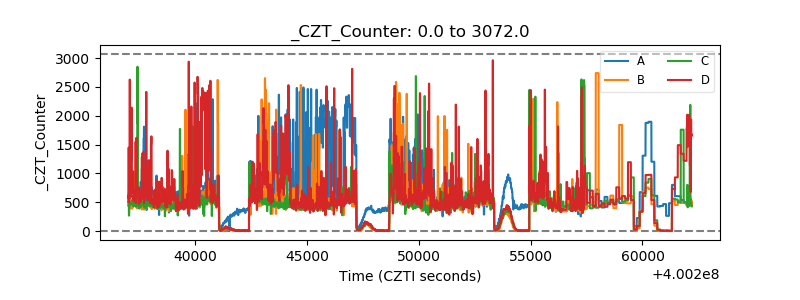 |
| +2.5 Volts monitor | 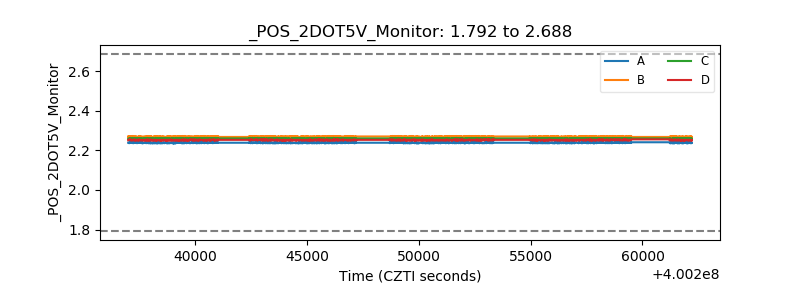 |
| +5 Volts monitor | 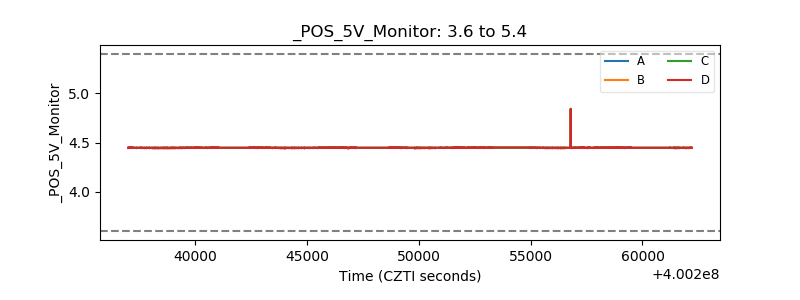 |
| _ROLL_ROT | 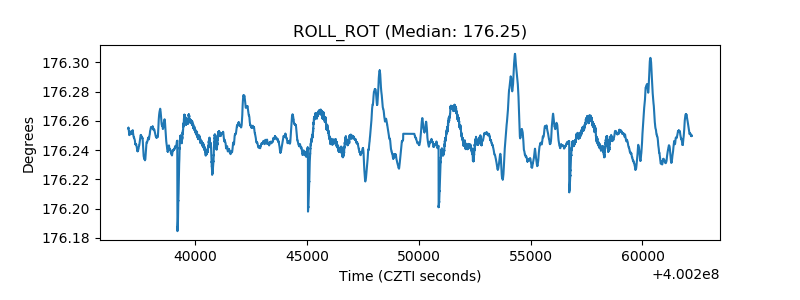 |
| _Roll_DEC | 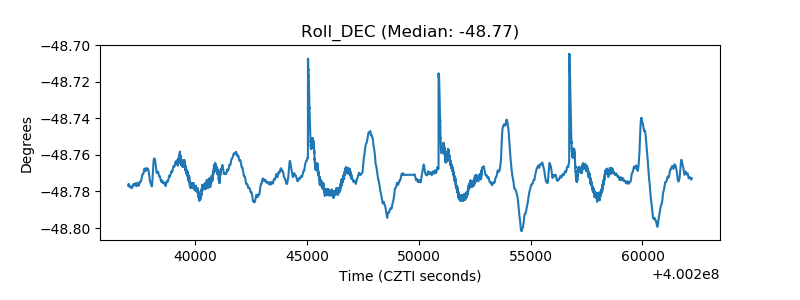 |
| _Roll_RA | 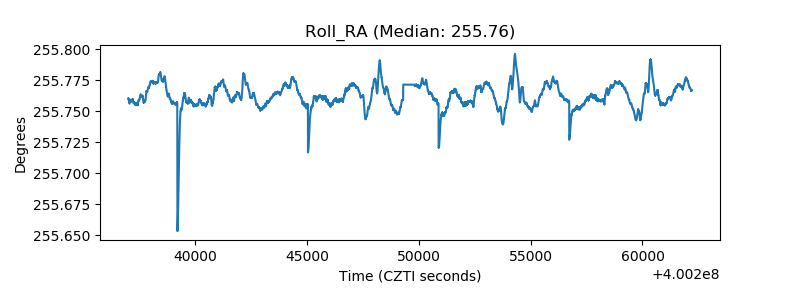 |
| Veto Counter | 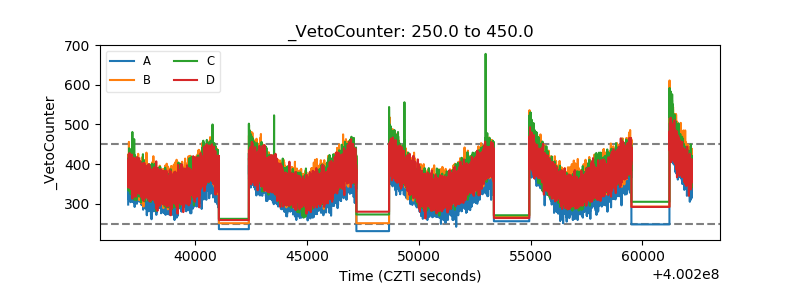 |