| Param | Original file | Final file |
|---|---|---|
| Filename | modeM0/AS1T05_051T01_9000005334_37547cztM0_level2.evt | modeM0/AS1T05_051T01_9000005334_37547cztM0_level2_quad_clean.evt |
| Size (bytes) | 474,235,200 | 66,306,240 |
| Size | 452.3 MB | 63.2 MB |
| Events in quadrant A | 2,833,538 | 423,040 |
| Events in quadrant B | 2,874,486 | 427,257 |
| Events in quadrant C | 3,055,349 | 413,308 |
| Events in quadrant D | 5,243,258 | 376,466 |
| Mode M9 | |||
|---|---|---|---|
| Quadrant | BADHDUFLAG | Total packets | Discarded packets |
| A | 0 | 25 | 0 |
| B | 0 | 25 | 0 |
| C | 0 | 25 | 0 |
| D | 0 | 26 | 0 |
| Mode M0 | |||
|---|---|---|---|
| Quadrant | BADHDUFLAG | Total packets | Discarded packets |
| A | 0 | 11806 | 3 |
| B | 0 | 11827 | 2 |
| C | 0 | 12275 | 2 |
| D | 0 | 19129 | 2 |
| Mode SS | |||
|---|---|---|---|
| Quadrant | BADHDUFLAG | Total packets | Discarded packets |
| A | 0 | 108 | 0 |
| B | 0 | 108 | 0 |
| C | 0 | 108 | 0 |
| D | 0 | 108 | 0 |
| Quadrant | Total seconds | Saturated seconds | Saturation percentage |
|---|---|---|---|
| A | 5242 | 15 | 0.286150% |
| B | 5242 | 54 | 1.030141% |
| C | 5242 | 134 | 2.556276% |
| D | 5242 | 386 | 7.363602% |
Noise dominated data is calculated using 1-second bins in cleaned event files. If a bin has >2000 counts, and if more than 50% of those come from <1% of pixels, then it is considered to be noise-dominated and hence unusable.
| Quadrant | # 1 sec bins | Bins with >0 counts | Bins with >2000 counts | High rate bins dominated by noise | Noise dominated (total time) | Noise dominated (detector-on time) | Marked lightcurve |
|---|---|---|---|---|---|---|---|
| A | 7034 | 5243 | 7 | 7 | 0.10% | 0.13% | 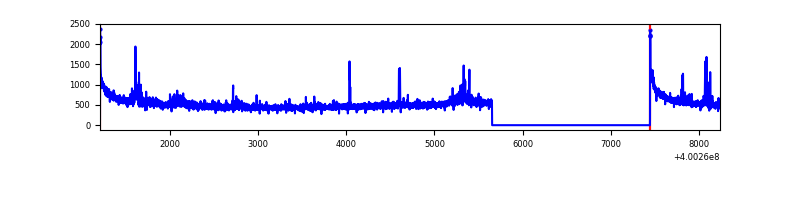 |
| B | 7034 | 5243 | 29 | 29 | 0.41% | 0.55% | 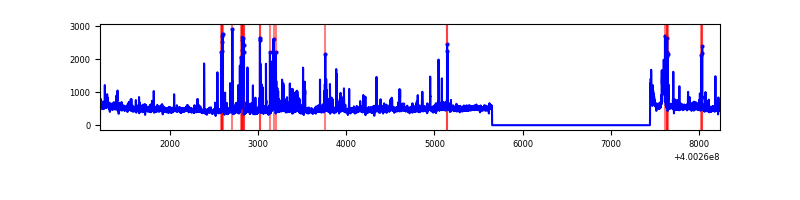 |
| C | 7034 | 5243 | 145 | 145 | 2.06% | 2.77% | 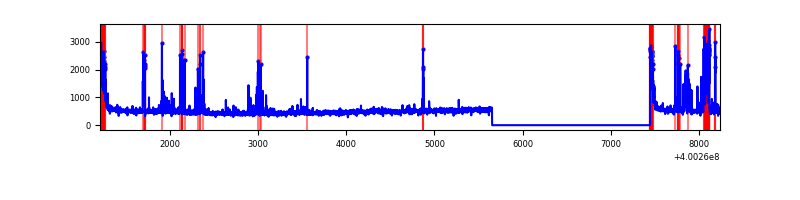 |
| D | 7034 | 5243 | 517 | 517 | 7.35% | 9.86% | 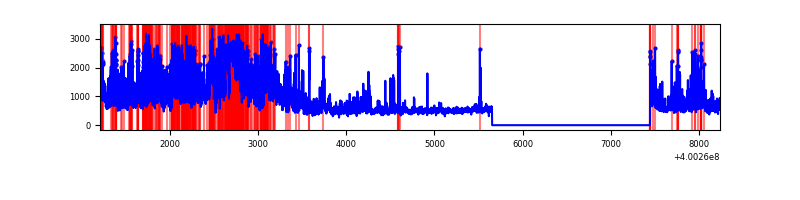 |
Top three noisy pixels from each quadrant. If the there are fewer than three noisy pixels in the level2.evt file, extra rows are filled as -1
| Pixel properties | Quadrant properties | ||||||
|---|---|---|---|---|---|---|---|
| Quadrant | DetID | PixID | Counts | Sigma | Mean | Median | Sigma |
| A | 10 | 83 | 315001 | 2562.22 | 603 | 592 | 122.7 |
| A | 15 | 222 | 136109 | 1104.37 | 603 | 592 | 122.7 |
| A | 6 | 10 | 17296 | 136.13 | 603 | 592 | 122.7 |
| B | 5 | 172 | 107402 | 915.48 | 603 | 589 | 116.7 |
| B | 5 | 255 | 94474 | 804.68 | 603 | 589 | 116.7 |
| B | 4 | 81 | 81765 | 695.75 | 603 | 589 | 116.7 |
| C | 14 | 254 | 245562 | 1823.42 | 576 | 582 | 134.4 |
| C | 15 | 214 | 223048 | 1655.84 | 576 | 582 | 134.4 |
| C | 0 | 10 | 189417 | 1405.52 | 576 | 582 | 134.4 |
| D | 12 | 235 | 2349586 | 16726.81 | 567 | 551 | 140.4 |
| D | 2 | 249 | 222509 | 1580.5 | 567 | 551 | 140.4 |
| D | 2 | 153 | 174214 | 1236.6 | 567 | 551 | 140.4 |
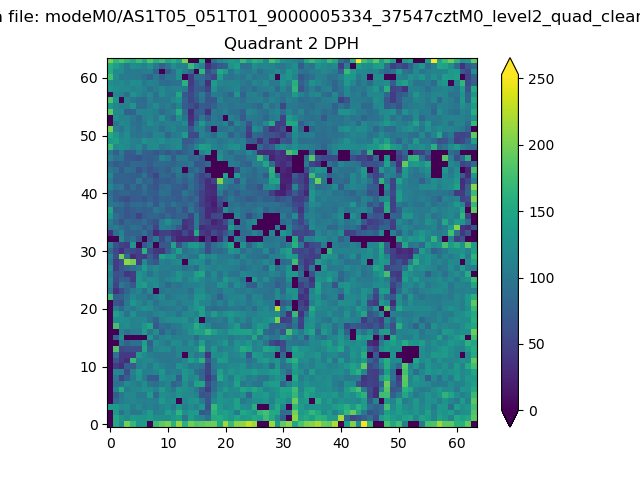
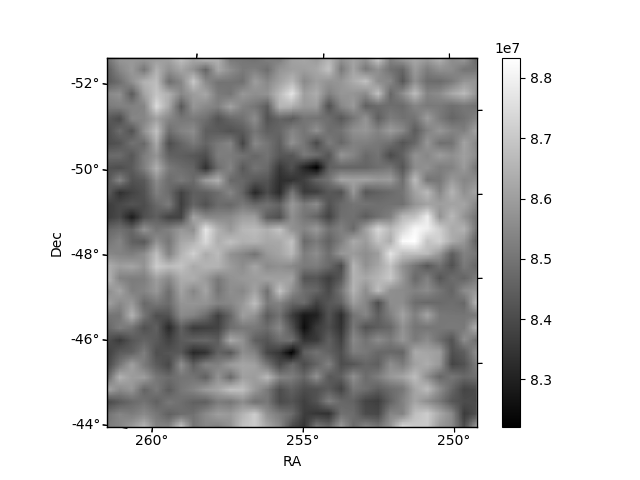
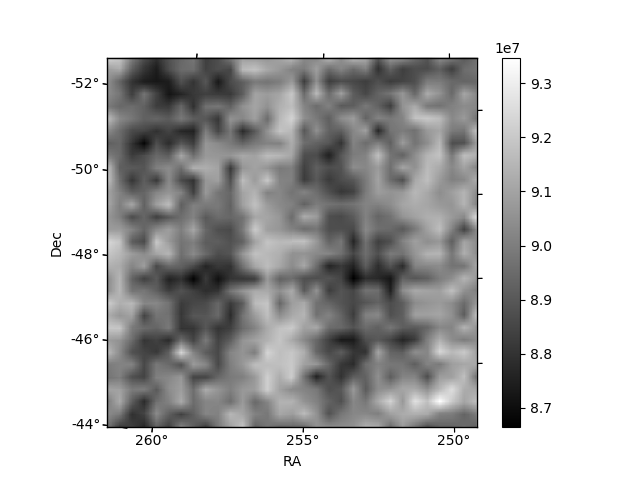
Histogram calculated using DETX and DETY for each event in the final _common_clean file
| Quadrant A | 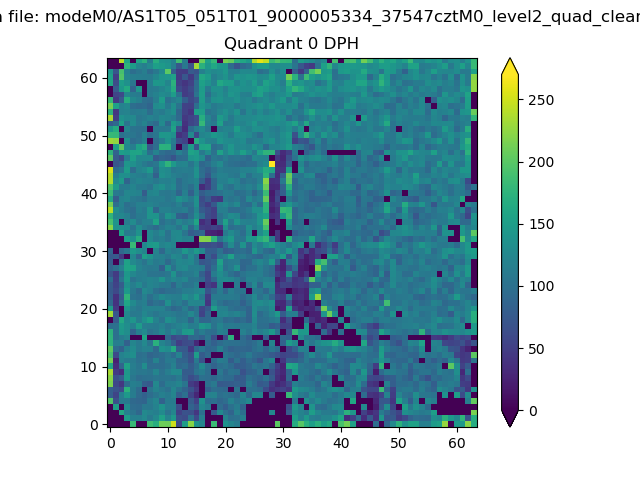 |
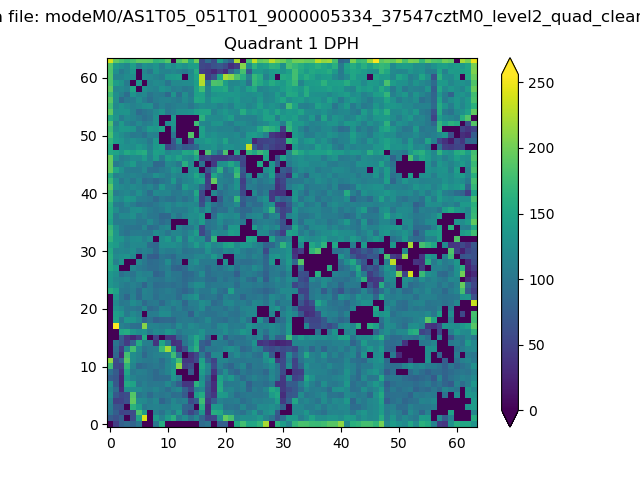 |
Quadrant B |
|---|---|---|---|
| Quadrant D | 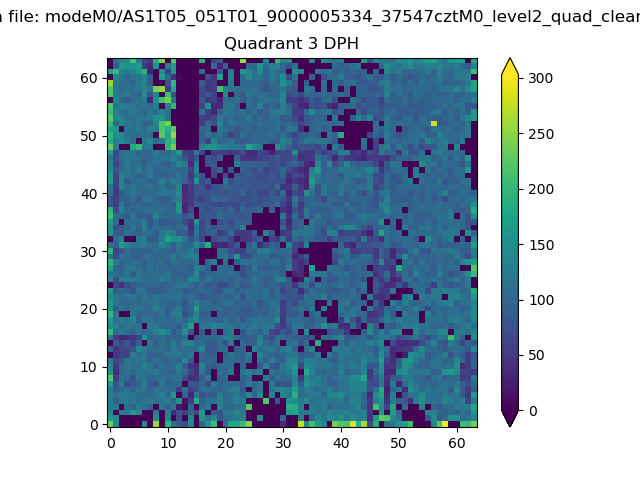 |
 |
Quadrant C |
| Plot type | Count rate plots | Images |
|---|---|---|
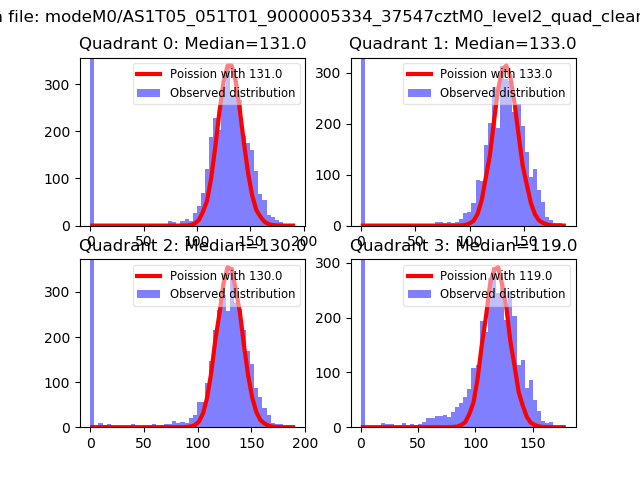
| Comparison with Poisson distribution Blue bars denote a histogram of data divided into 1 sec bins. Red curve is a Poisson curve with rate = median count rate of data. |
 |
 |
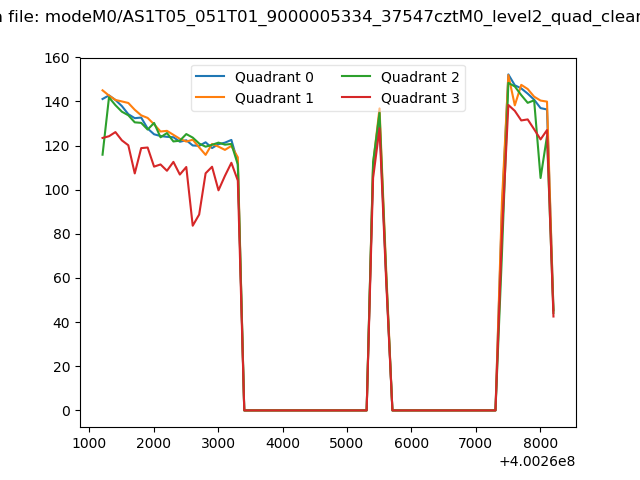
| Quadrant-wise count rates Data is divided into 100 sec bins |
 |
|
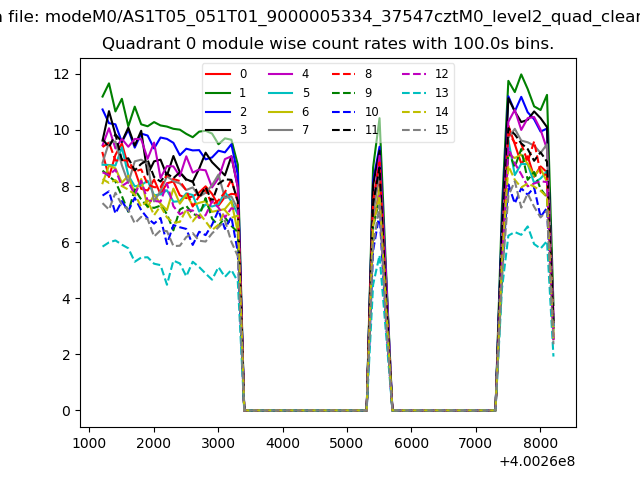
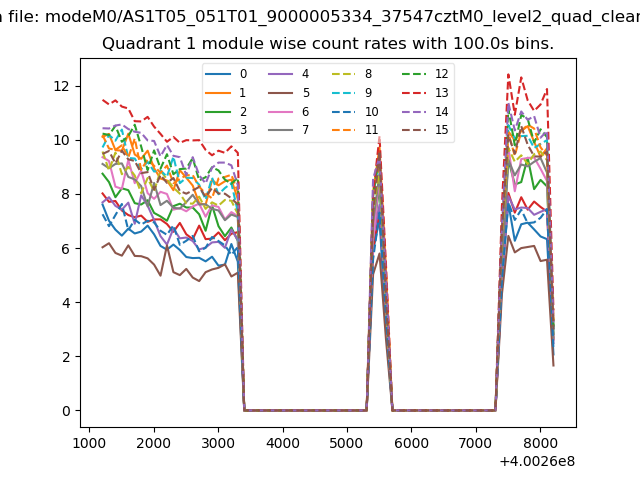
| Module-wise count rates for Quadrant A Data is divided into 100 sec bins |
 |
 |
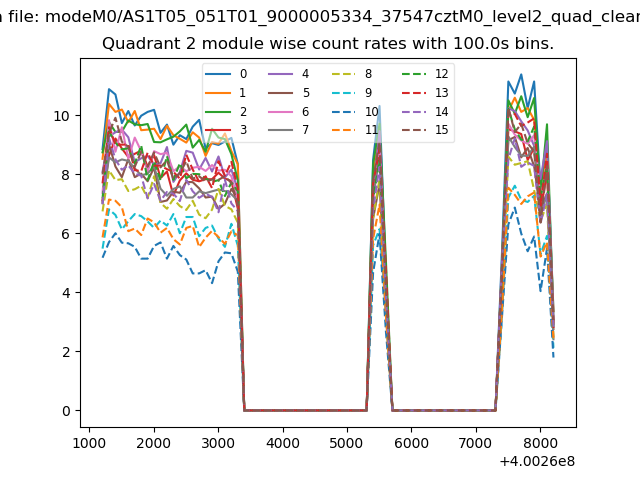
| Module-wise count rates for Quadrant B Data is divided into 100 sec bins |
 |
 |
| Module-wise count rates for Quadrant C Data is divided into 100 sec bins |
 |
 |
| Module-wise count rates for Quadrant D Data is divided into 100 sec bins |
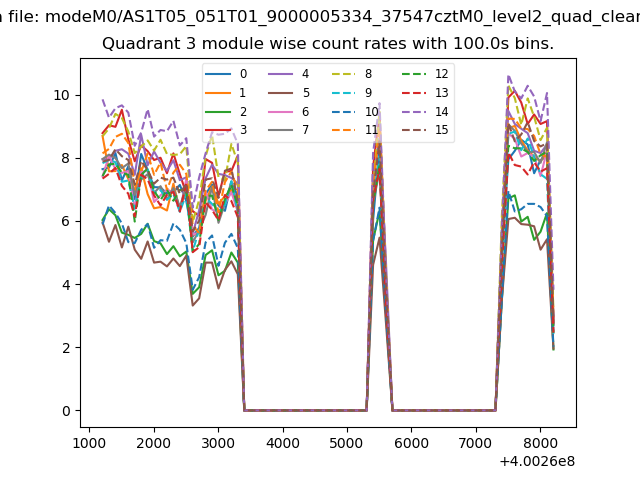 |
 |
| Parameter | Plot |
|---|---|
| CZT HV Monitor |  |
| D_VDD | 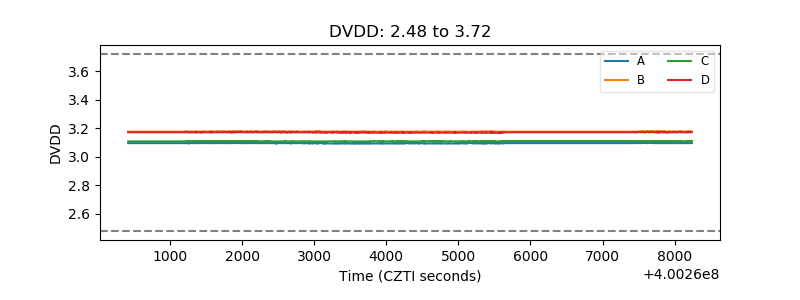 |
| Temperature 1 | 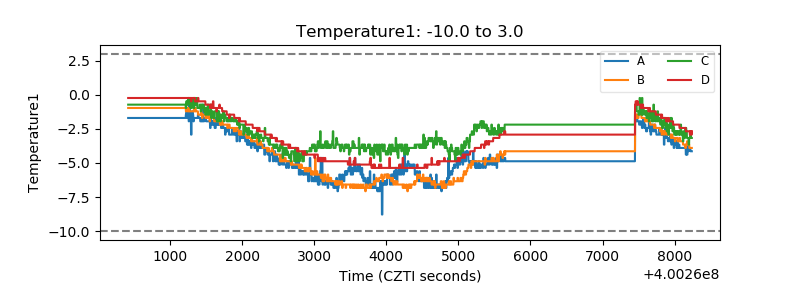 |
| Veto HV Monitor | 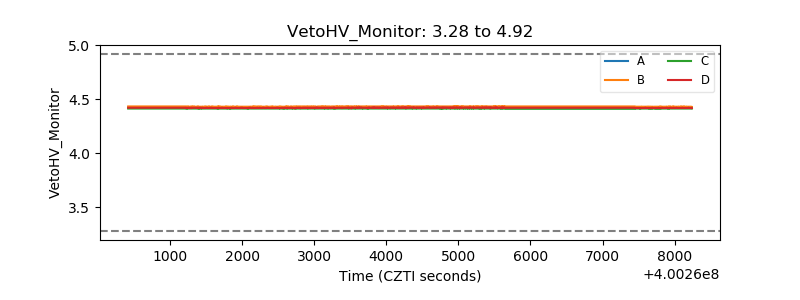 |
| Veto LLD |  |
| Alpha Counter | 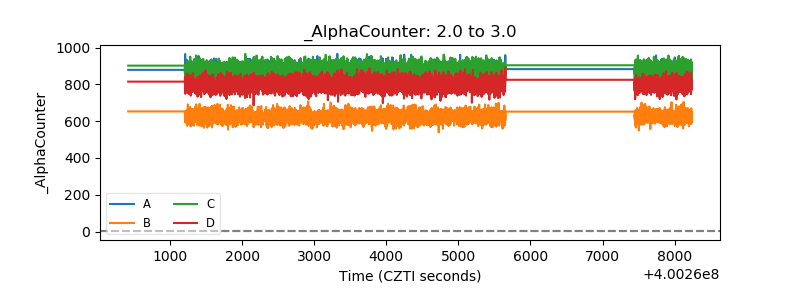 |
| _CPM_Rate | 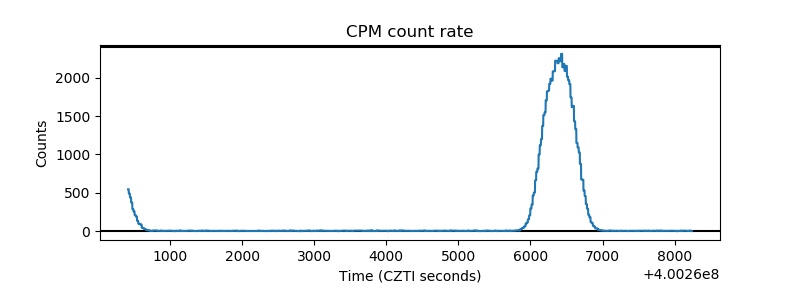 |
| CZT Counter | 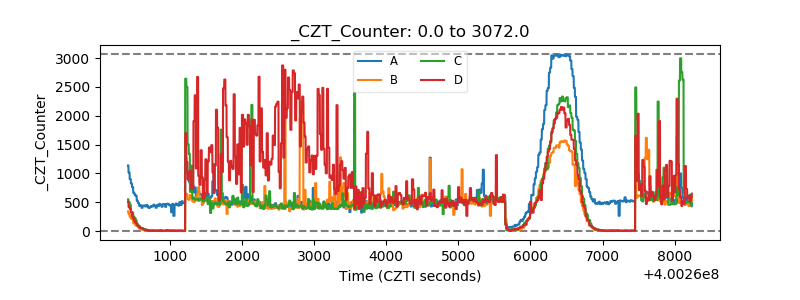 |
| +2.5 Volts monitor | 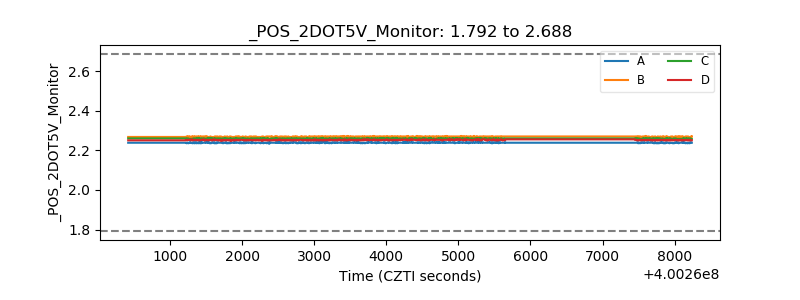 |
| +5 Volts monitor | 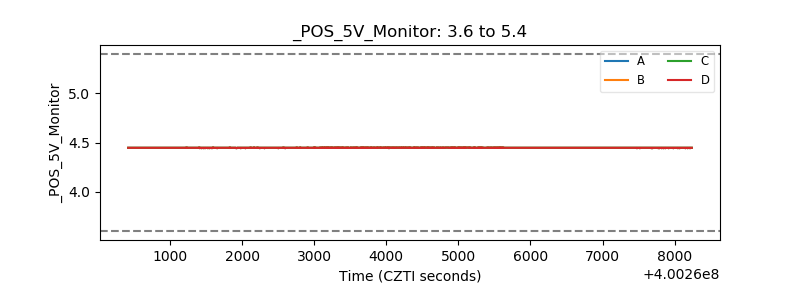 |
| _ROLL_ROT | 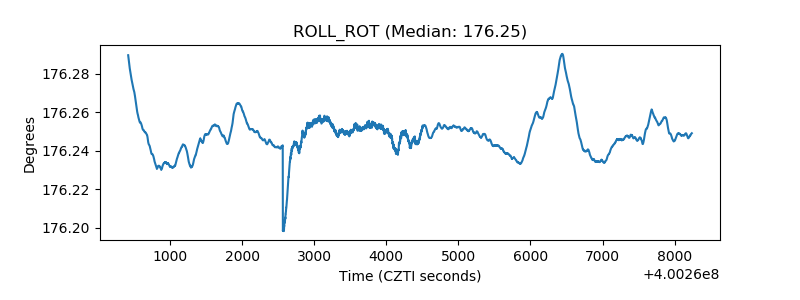 |
| _Roll_DEC | 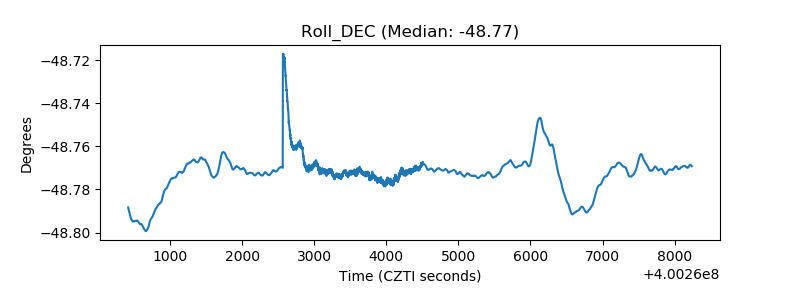 |
| _Roll_RA | 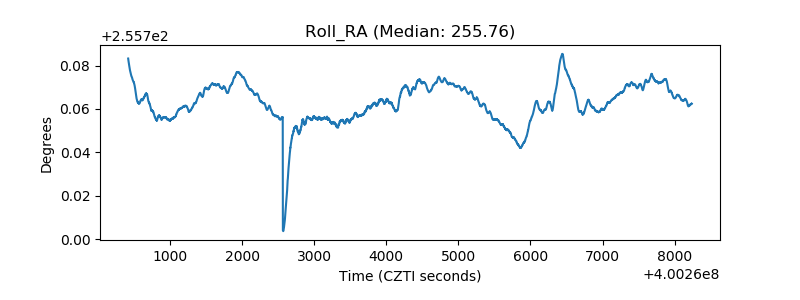 |
| Veto Counter | 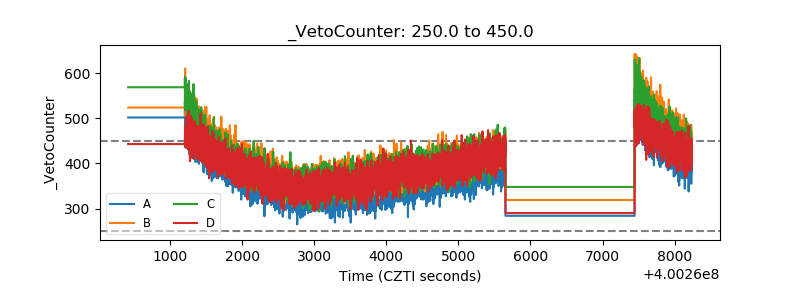 |