| Param | Original file | Final file |
|---|---|---|
| Filename | modeM0/AS1T05_051T01_9000005334_37548cztM0_level2.evt | modeM0/AS1T05_051T01_9000005334_37548cztM0_level2_quad_clean.evt |
| Size (bytes) | 409,887,360 | 65,784,960 |
| Size | 390.9 MB | 62.7 MB |
| Events in quadrant A | 2,684,527 | 419,434 |
| Events in quadrant B | 2,867,423 | 426,150 |
| Events in quadrant C | 2,982,388 | 409,205 |
| Events in quadrant D | 3,535,206 | 382,248 |
| Mode M9 | |||
|---|---|---|---|
| Quadrant | BADHDUFLAG | Total packets | Discarded packets |
| A | 0 | 26 | 0 |
| B | 0 | 26 | 0 |
| C | 0 | 26 | 0 |
| D | 0 | 27 | 0 |
| Mode M0 | |||
|---|---|---|---|
| Quadrant | BADHDUFLAG | Total packets | Discarded packets |
| A | 0 | 11075 | 3 |
| B | 0 | 11616 | 2 |
| C | 0 | 11917 | 2 |
| D | 0 | 13873 | 2 |
| Mode SS | |||
|---|---|---|---|
| Quadrant | BADHDUFLAG | Total packets | Discarded packets |
| A | 0 | 104 | 0 |
| B | 0 | 104 | 0 |
| C | 0 | 104 | 0 |
| D | 0 | 104 | 0 |
| Quadrant | Total seconds | Saturated seconds | Saturation percentage |
|---|---|---|---|
| A | 5059 | 15 | 0.296501% |
| B | 5059 | 76 | 1.502273% |
| C | 5059 | 107 | 2.115042% |
| D | 5059 | 272 | 5.376557% |
Noise dominated data is calculated using 1-second bins in cleaned event files. If a bin has >2000 counts, and if more than 50% of those come from <1% of pixels, then it is considered to be noise-dominated and hence unusable.
| Quadrant | # 1 sec bins | Bins with >0 counts | Bins with >2000 counts | High rate bins dominated by noise | Noise dominated (total time) | Noise dominated (detector-on time) | Marked lightcurve |
|---|---|---|---|---|---|---|---|
| A | 7001 | 5060 | 8 | 8 | 0.11% | 0.16% | 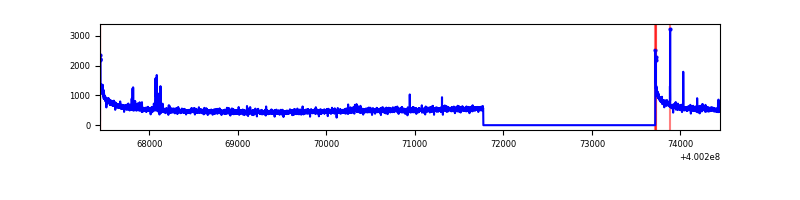 |
| B | 7001 | 5060 | 45 | 45 | 0.64% | 0.89% | 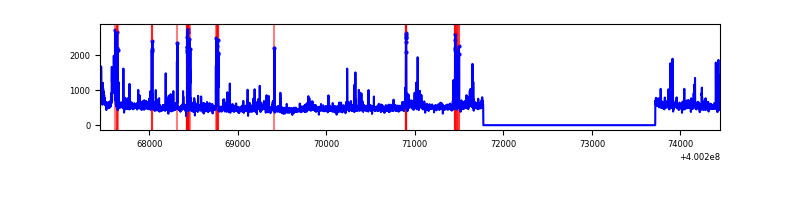 |
| C | 7001 | 5060 | 113 | 113 | 1.61% | 2.23% | 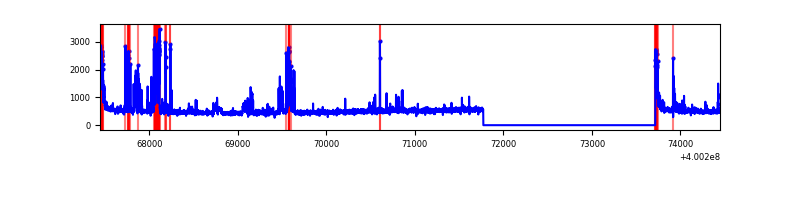 |
| D | 7001 | 5060 | 276 | 276 | 3.94% | 5.45% | 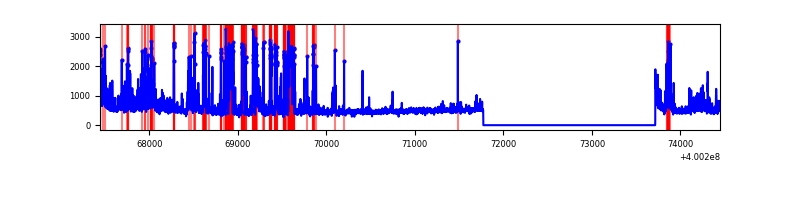 |
Top three noisy pixels from each quadrant. If the there are fewer than three noisy pixels in the level2.evt file, extra rows are filled as -1
| Pixel properties | Quadrant properties | ||||||
|---|---|---|---|---|---|---|---|
| Quadrant | DetID | PixID | Counts | Sigma | Mean | Median | Sigma |
| A | 10 | 83 | 310439 | 2598.52 | 594 | 584 | 119.2 |
| A | 12 | 189 | 22327 | 182.34 | 594 | 584 | 119.2 |
| A | 7 | 16 | 14856 | 119.69 | 594 | 584 | 119.2 |
| B | 5 | 255 | 97606 | 846.32 | 596 | 582 | 114.6 |
| B | 5 | 172 | 86982 | 753.65 | 596 | 582 | 114.6 |
| B | 15 | 85 | 58383 | 504.19 | 596 | 582 | 114.6 |
| C | 15 | 208 | 220245 | 1665.51 | 569 | 575 | 131.9 |
| C | 15 | 214 | 214914 | 1625.09 | 569 | 575 | 131.9 |
| C | 14 | 254 | 148605 | 1122.34 | 569 | 575 | 131.9 |
| D | 2 | 249 | 785613 | 5804.84 | 555 | 540 | 135.2 |
| D | 2 | 153 | 155176 | 1143.38 | 555 | 540 | 135.2 |
| D | 12 | 235 | 140983 | 1038.44 | 555 | 540 | 135.2 |
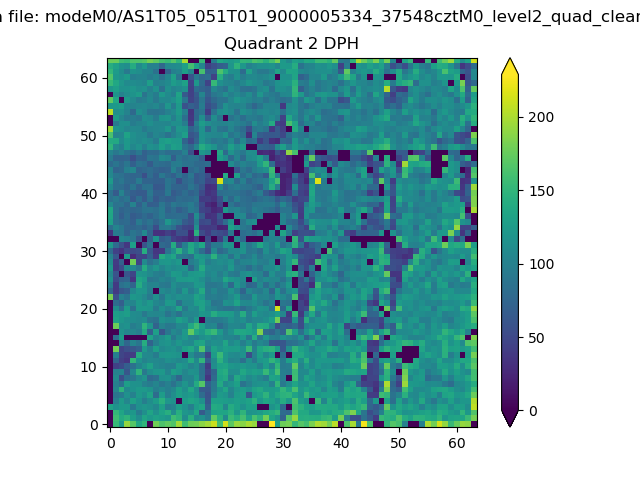
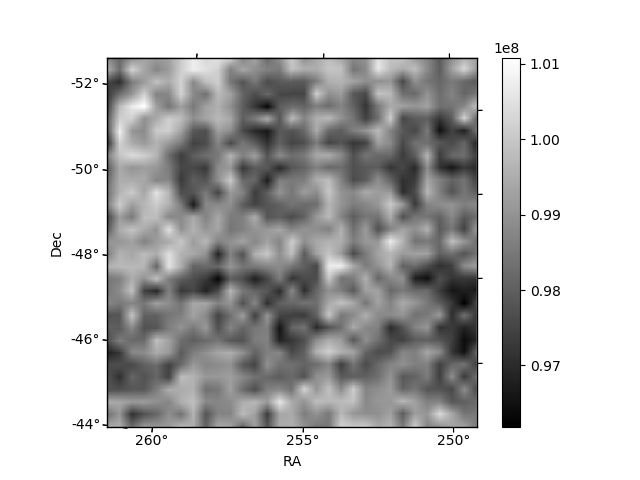
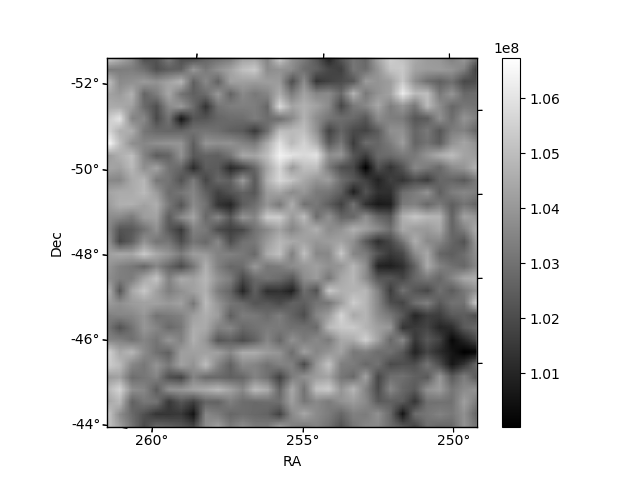
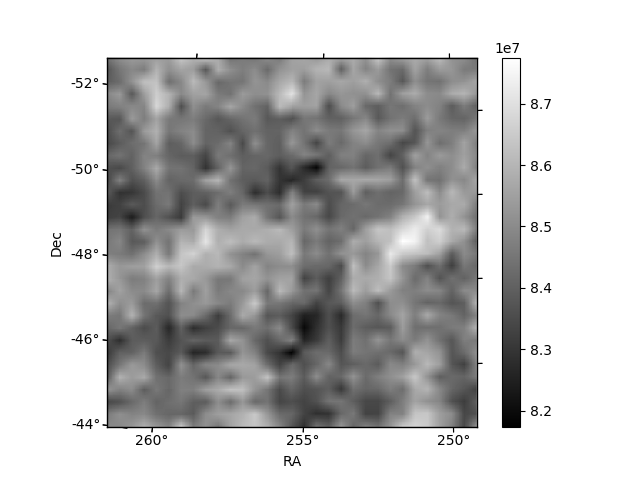
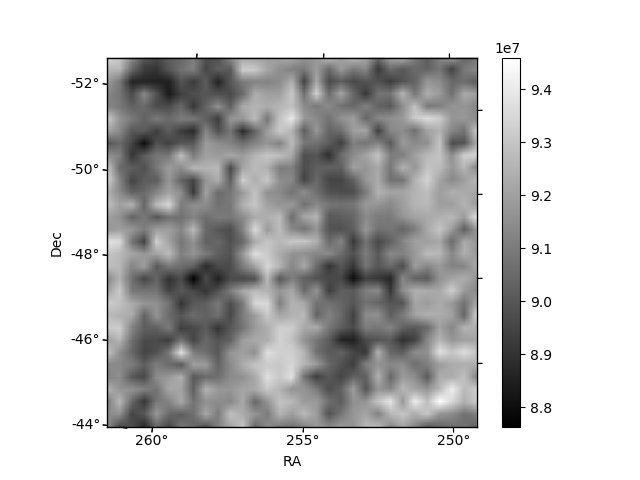
Histogram calculated using DETX and DETY for each event in the final _common_clean file
| Quadrant A | 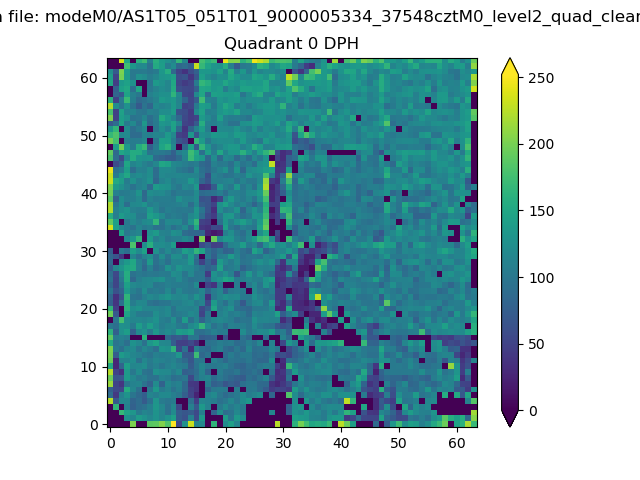 |
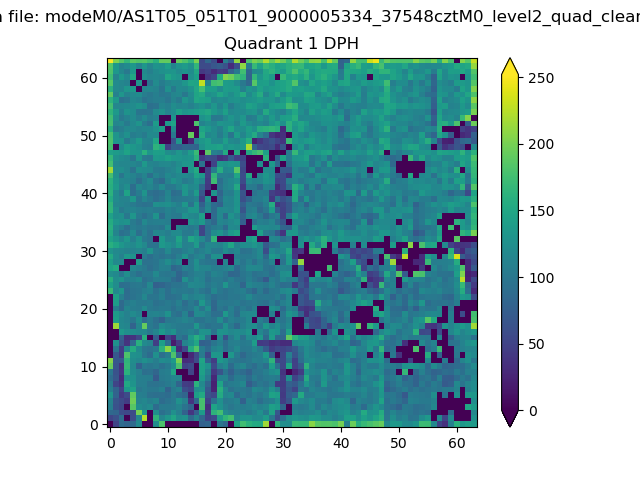 |
Quadrant B |
|---|---|---|---|
| Quadrant D | 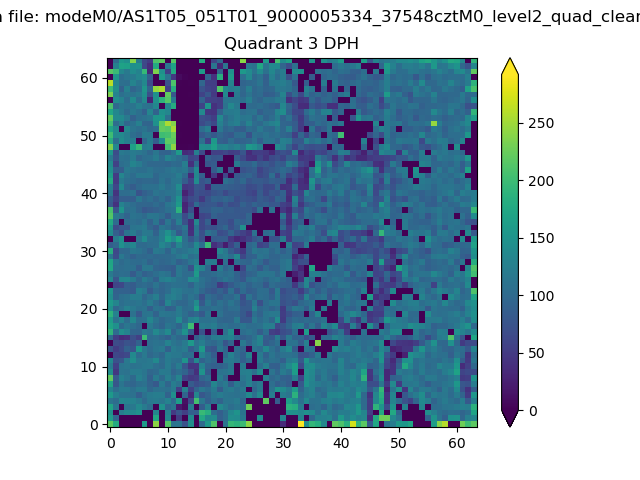 |
 |
Quadrant C |
| Plot type | Count rate plots | Images |
|---|---|---|
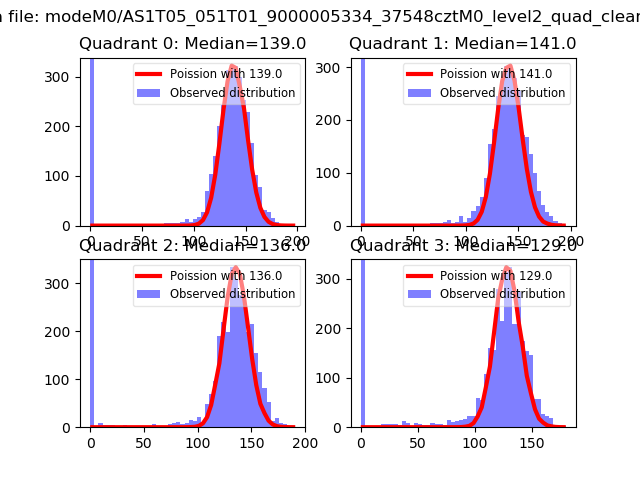
| Comparison with Poisson distribution Blue bars denote a histogram of data divided into 1 sec bins. Red curve is a Poisson curve with rate = median count rate of data. |
 |
 |
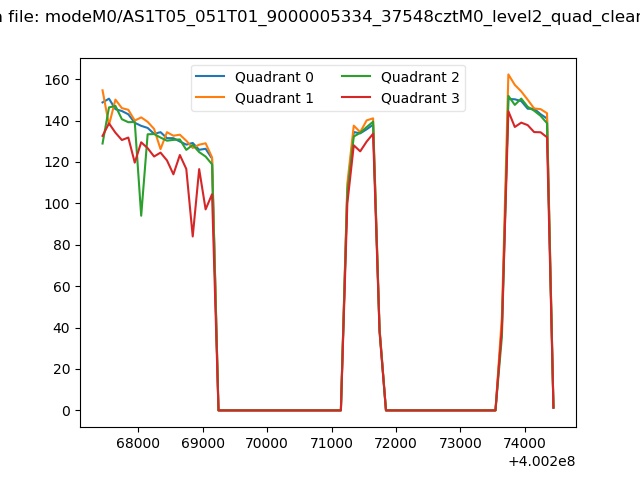
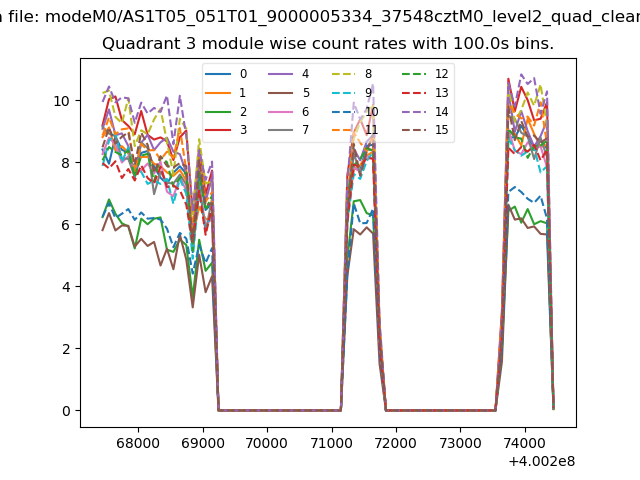
| Quadrant-wise count rates Data is divided into 100 sec bins |
 |
|
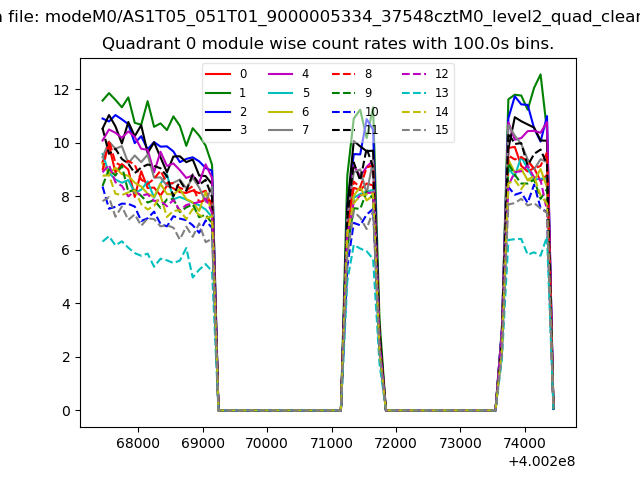
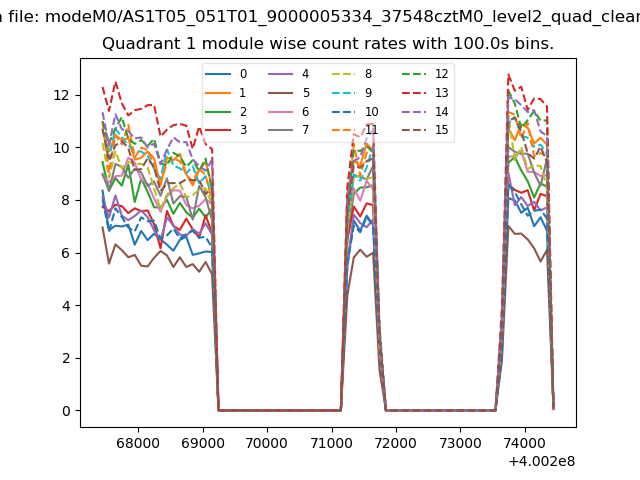
| Module-wise count rates for Quadrant A Data is divided into 100 sec bins |
 |
 |
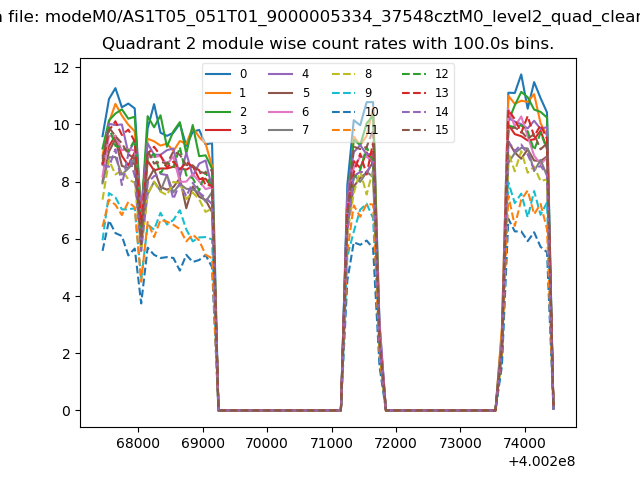
| Module-wise count rates for Quadrant B Data is divided into 100 sec bins |
 |
 |
| Module-wise count rates for Quadrant C Data is divided into 100 sec bins |
 |
 |
| Module-wise count rates for Quadrant D Data is divided into 100 sec bins |
 |
 |
| Parameter | Plot |
|---|---|
| CZT HV Monitor |  |
| D_VDD | 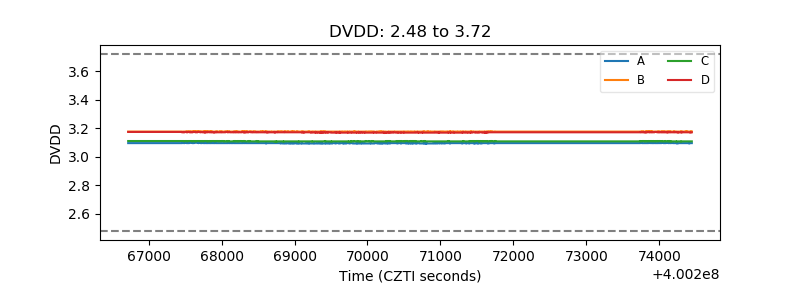 |
| Temperature 1 | 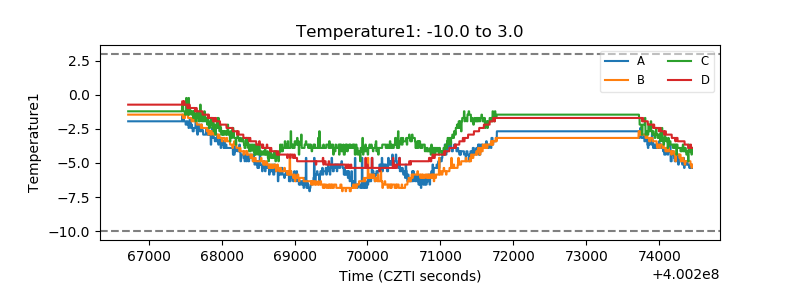 |
| Veto HV Monitor | 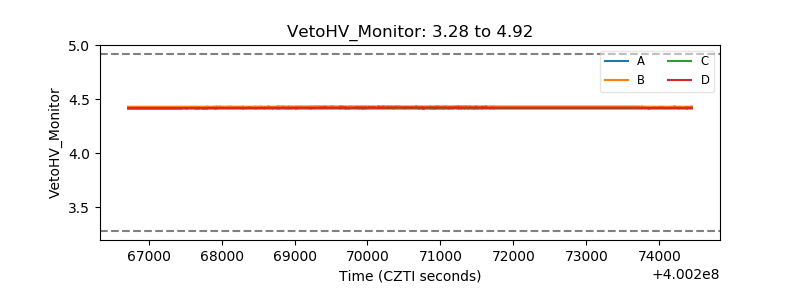 |
| Veto LLD | 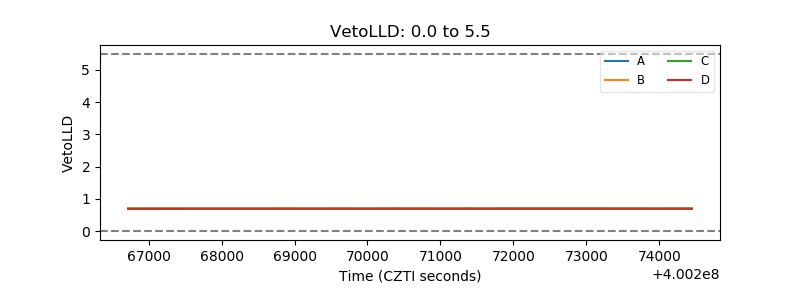 |
| Alpha Counter | 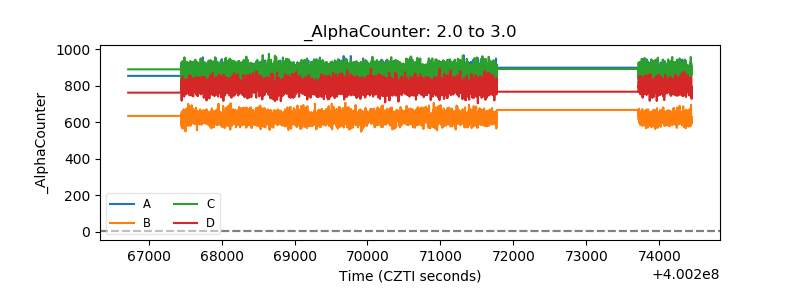 |
| _CPM_Rate | 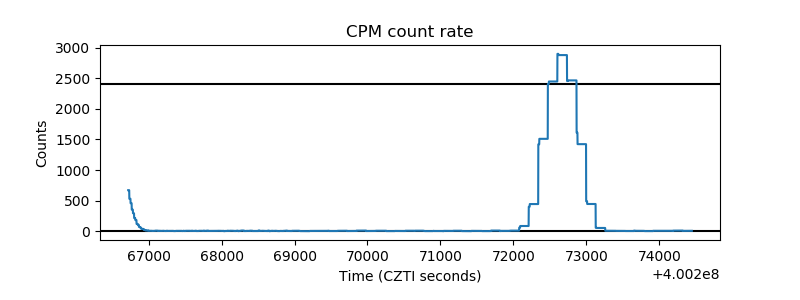 |
| CZT Counter | 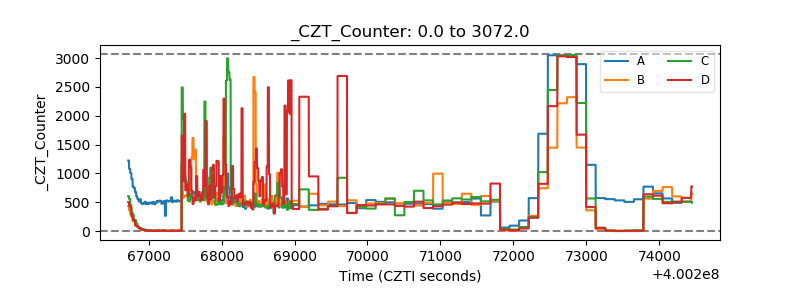 |
| +2.5 Volts monitor | 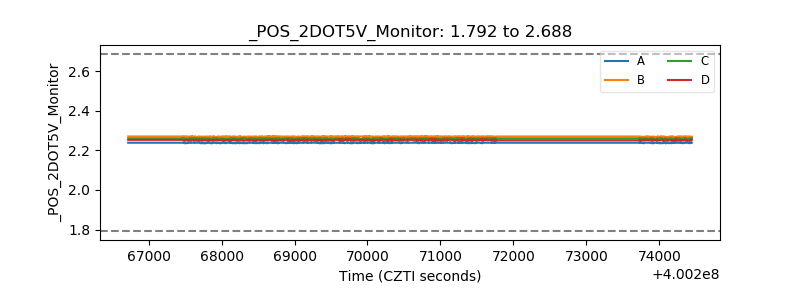 |
| +5 Volts monitor | 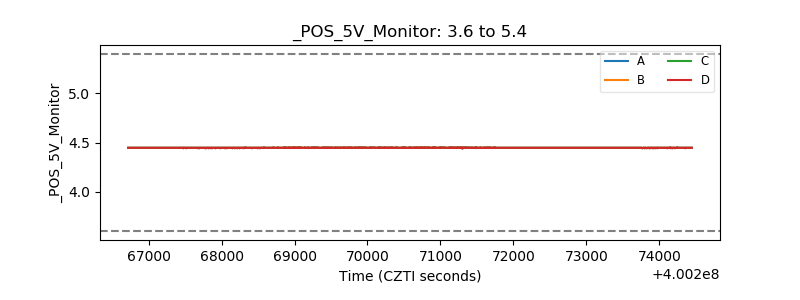 |
| _ROLL_ROT | 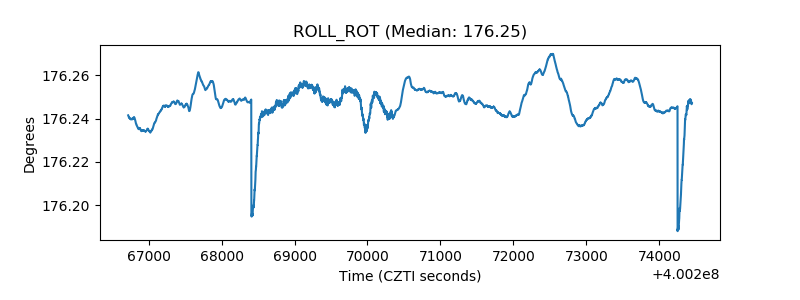 |
| _Roll_DEC | 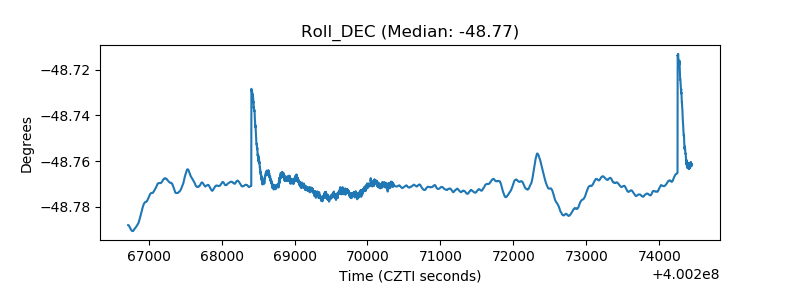 |
| _Roll_RA | 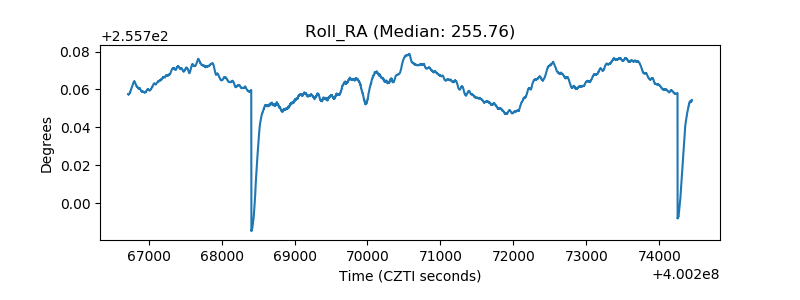 |
| Veto Counter | 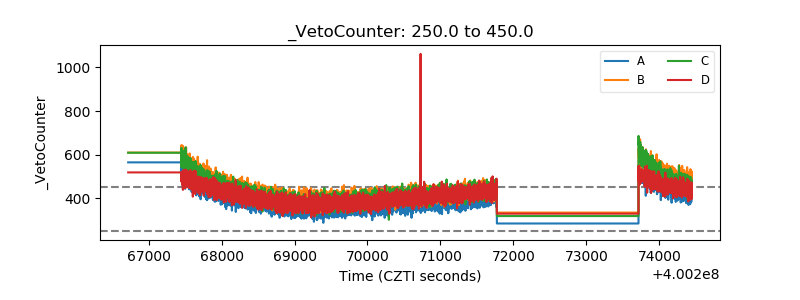 |