| Param | Original file | Final file |
|---|---|---|
| Filename | modeM0/AS1T05_051T01_9000005334_37549cztM0_level2.evt | modeM0/AS1T05_051T01_9000005334_37549cztM0_level2_quad_clean.evt |
| Size (bytes) | 386,582,400 | 64,918,080 |
| Size | 368.7 MB | 61.9 MB |
| Events in quadrant A | 2,587,924 | 409,134 |
| Events in quadrant B | 2,803,724 | 420,730 |
| Events in quadrant C | 2,882,245 | 409,151 |
| Events in quadrant D | 3,098,166 | 380,440 |
| Mode M9 | |||
|---|---|---|---|
| Quadrant | BADHDUFLAG | Total packets | Discarded packets |
| A | 0 | 24 | 0 |
| B | 0 | 24 | 0 |
| C | 0 | 24 | 0 |
| D | 0 | 25 | 0 |
| Mode M0 | |||
|---|---|---|---|
| Quadrant | BADHDUFLAG | Total packets | Discarded packets |
| A | 0 | 10645 | 3 |
| B | 0 | 11299 | 2 |
| C | 0 | 11436 | 2 |
| D | 0 | 12493 | 2 |
| Mode SS | |||
|---|---|---|---|
| Quadrant | BADHDUFLAG | Total packets | Discarded packets |
| A | 0 | 102 | 0 |
| B | 0 | 102 | 0 |
| C | 0 | 102 | 0 |
| D | 0 | 102 | 0 |
| Quadrant | Total seconds | Saturated seconds | Saturation percentage |
|---|---|---|---|
| A | 4931 | 12 | 0.243358% |
| B | 4931 | 40 | 0.811194% |
| C | 4931 | 67 | 1.358751% |
| D | 4931 | 139 | 2.818901% |
Noise dominated data is calculated using 1-second bins in cleaned event files. If a bin has >2000 counts, and if more than 50% of those come from <1% of pixels, then it is considered to be noise-dominated and hence unusable.
| Quadrant | # 1 sec bins | Bins with >0 counts | Bins with >2000 counts | High rate bins dominated by noise | Noise dominated (total time) | Noise dominated (detector-on time) | Marked lightcurve |
|---|---|---|---|---|---|---|---|
| A | 6964 | 4932 | 7 | 7 | 0.10% | 0.14% | 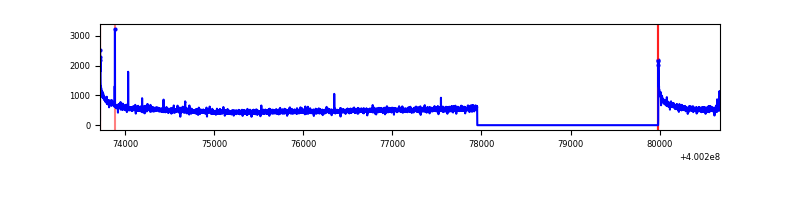 |
| B | 6964 | 4932 | 29 | 29 | 0.42% | 0.59% | 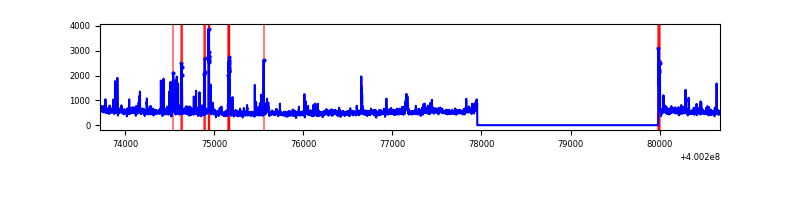 |
| C | 6964 | 4932 | 74 | 74 | 1.06% | 1.50% | 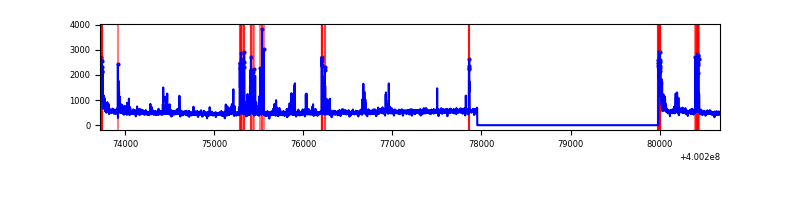 |
| D | 6963 | 4931 | 136 | 136 | 1.95% | 2.76% | 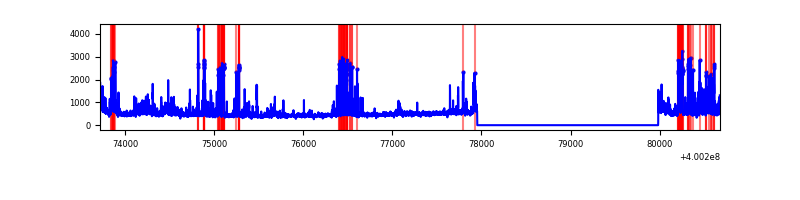 |
Top three noisy pixels from each quadrant. If the there are fewer than three noisy pixels in the level2.evt file, extra rows are filled as -1
| Pixel properties | Quadrant properties | ||||||
|---|---|---|---|---|---|---|---|
| Quadrant | DetID | PixID | Counts | Sigma | Mean | Median | Sigma |
| A | 10 | 83 | 286809 | 2432.06 | 585 | 575 | 117.7 |
| A | 12 | 189 | 14113 | 115.03 | 585 | 575 | 117.7 |
| A | 13 | 6 | 8591 | 68.11 | 585 | 575 | 117.7 |
| B | 15 | 32 | 81534 | 717.81 | 590 | 576 | 112.8 |
| B | 4 | 232 | 52761 | 462.69 | 590 | 576 | 112.8 |
| B | 0 | 245 | 41495 | 362.8 | 590 | 576 | 112.8 |
| C | 14 | 254 | 246073 | 1839.38 | 569 | 573 | 133.5 |
| C | 15 | 214 | 209427 | 1564.81 | 569 | 573 | 133.5 |
| C | 0 | 10 | 116731 | 870.3 | 569 | 573 | 133.5 |
| D | 2 | 249 | 376810 | 2768.42 | 556 | 540 | 135.9 |
| D | 1 | 52 | 180699 | 1325.53 | 556 | 540 | 135.9 |
| D | 13 | 249 | 96622 | 706.93 | 556 | 540 | 135.9 |
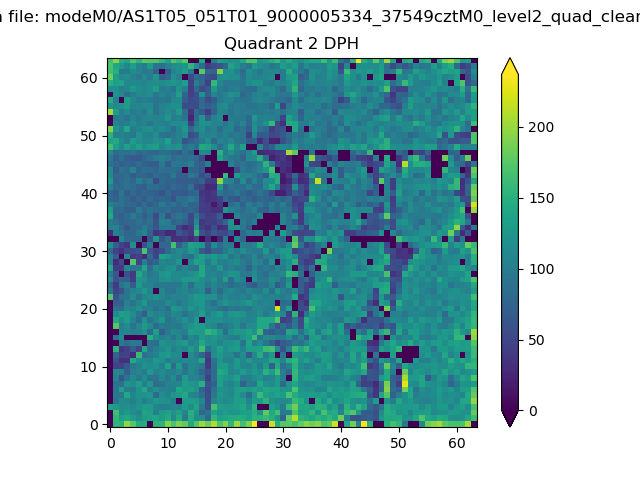
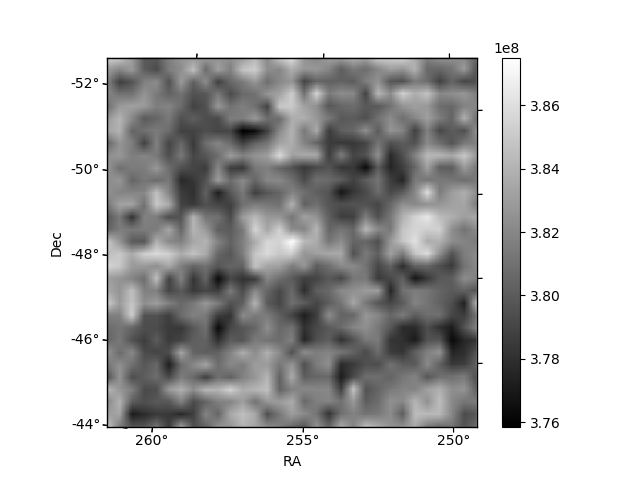
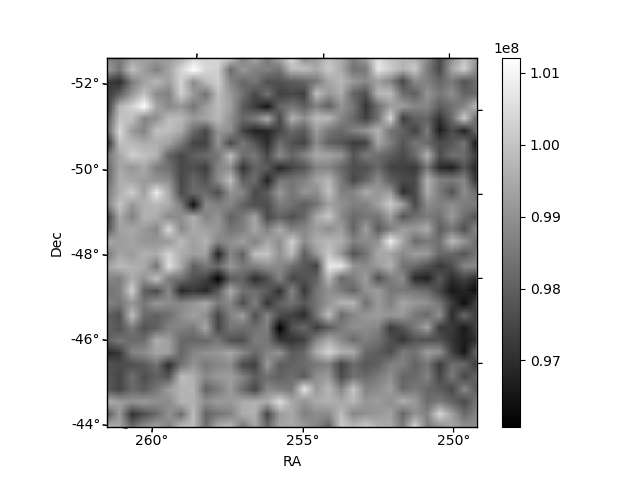
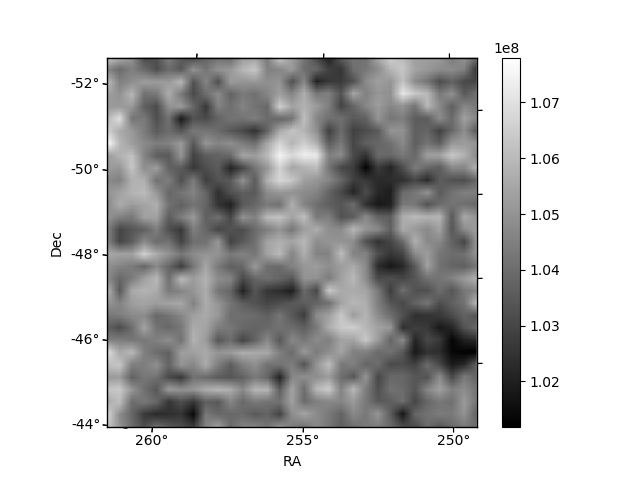
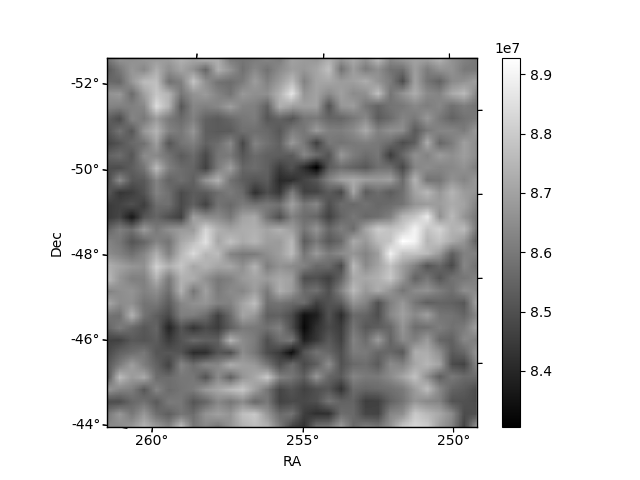
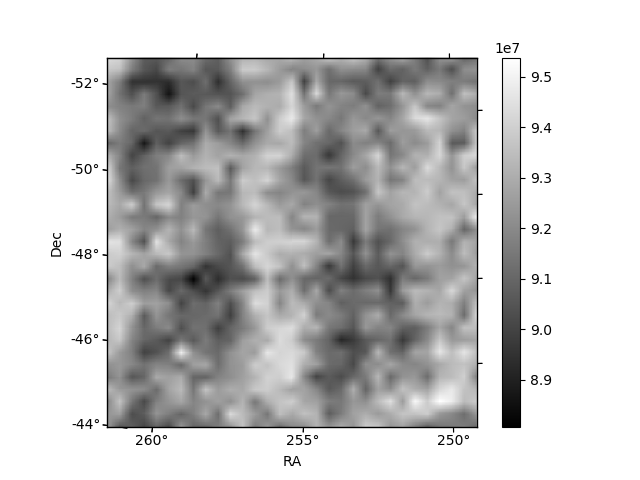
Histogram calculated using DETX and DETY for each event in the final _common_clean file
| Quadrant A | 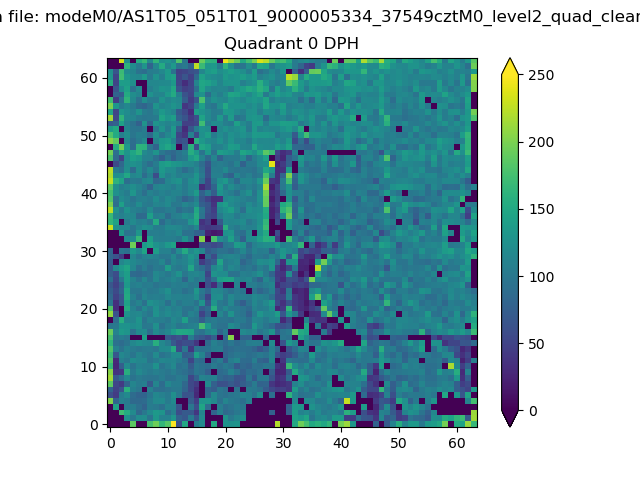 |
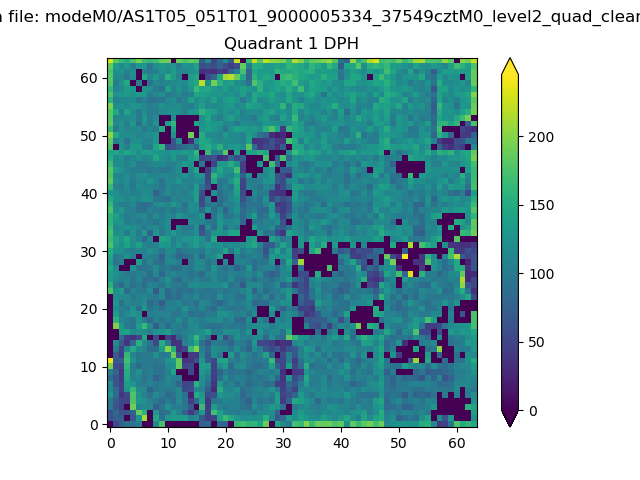 |
Quadrant B |
|---|---|---|---|
| Quadrant D | 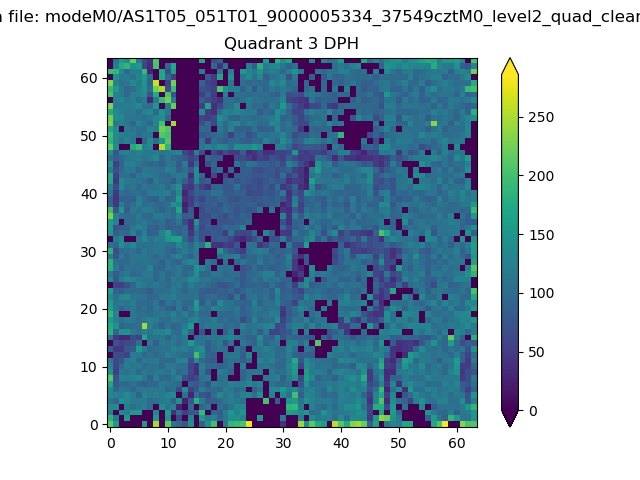 |
 |
Quadrant C |
| Plot type | Count rate plots | Images |
|---|---|---|
| Comparison with Poisson distribution Blue bars denote a histogram of data divided into 1 sec bins. Red curve is a Poisson curve with rate = median count rate of data. |
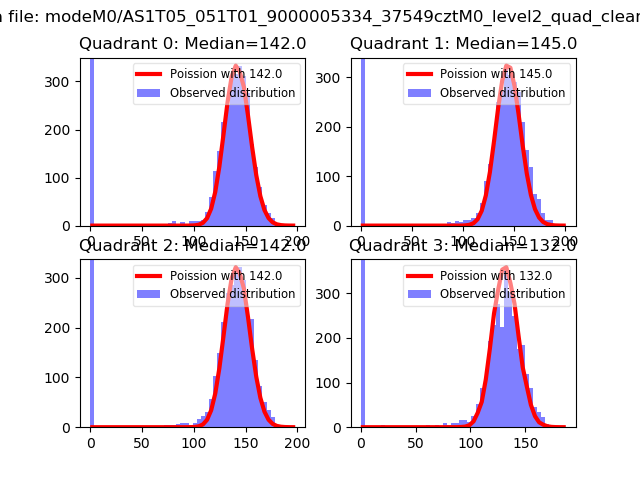 |
 |
| Quadrant-wise count rates Data is divided into 100 sec bins |
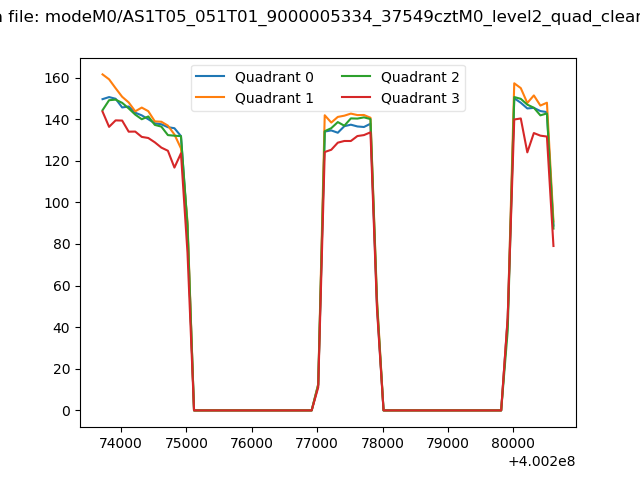 |
|
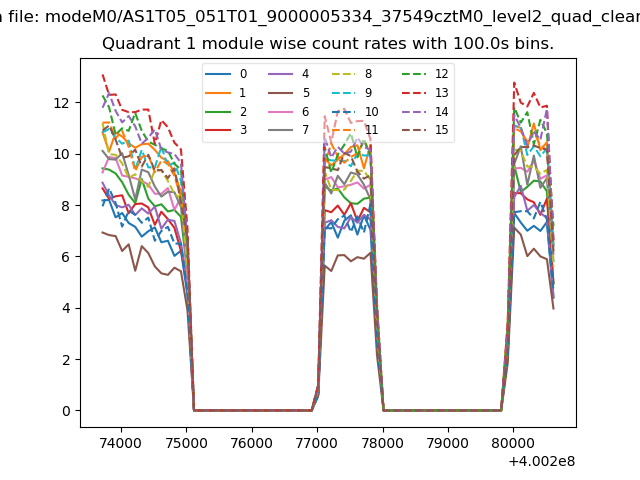
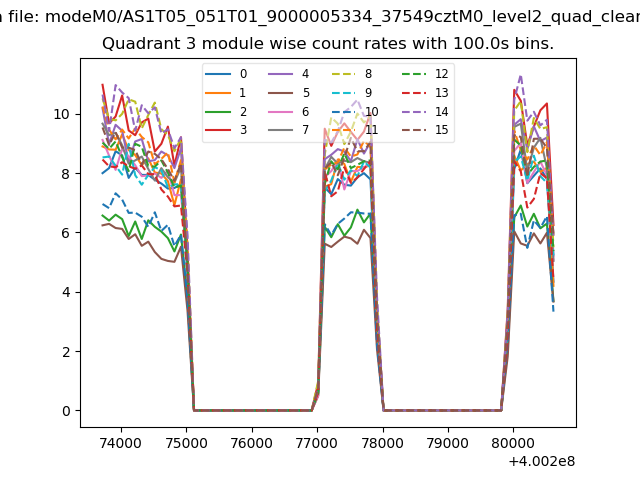
| Module-wise count rates for Quadrant A Data is divided into 100 sec bins |
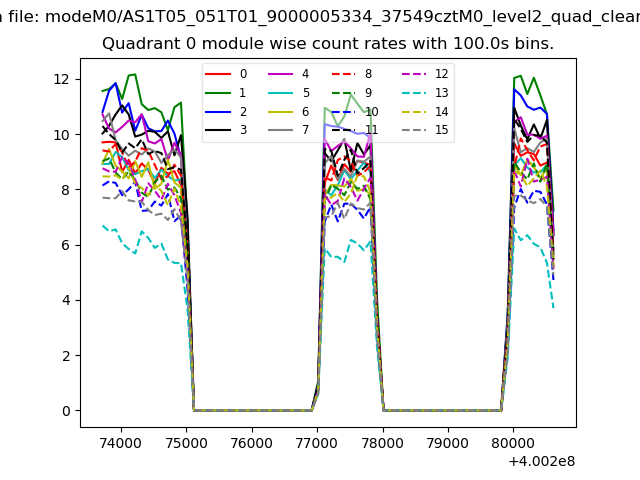 |
 |
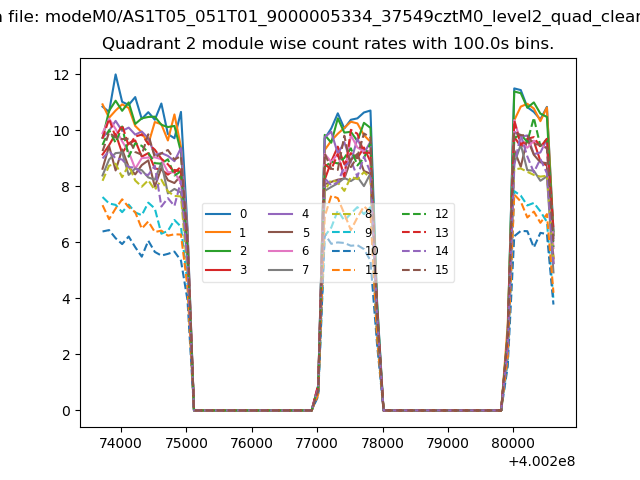
| Module-wise count rates for Quadrant B Data is divided into 100 sec bins |
 |
 |
| Module-wise count rates for Quadrant C Data is divided into 100 sec bins |
 |
 |
| Module-wise count rates for Quadrant D Data is divided into 100 sec bins |
 |
 |
| Parameter | Plot |
|---|---|
| CZT HV Monitor | 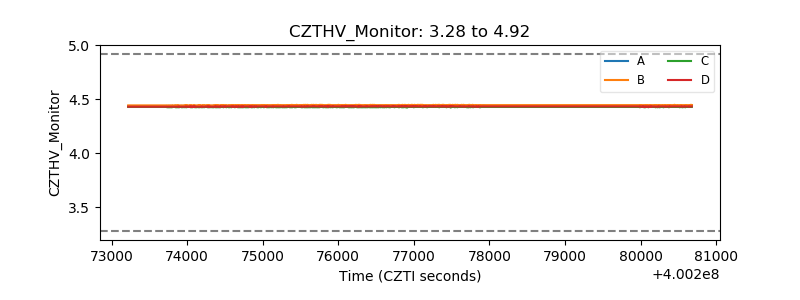 |
| D_VDD |  |
| Temperature 1 | 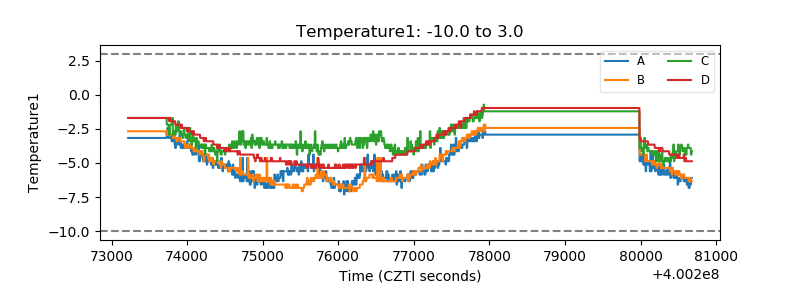 |
| Veto HV Monitor | 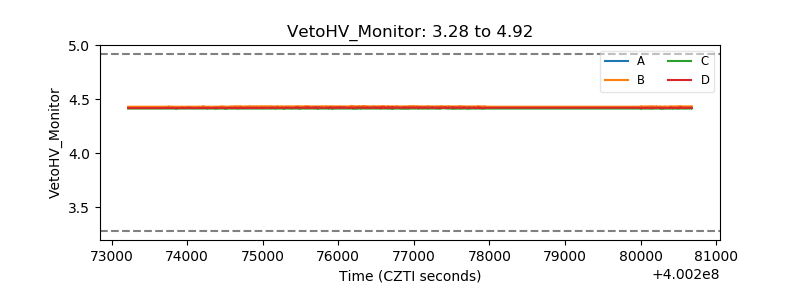 |
| Veto LLD | 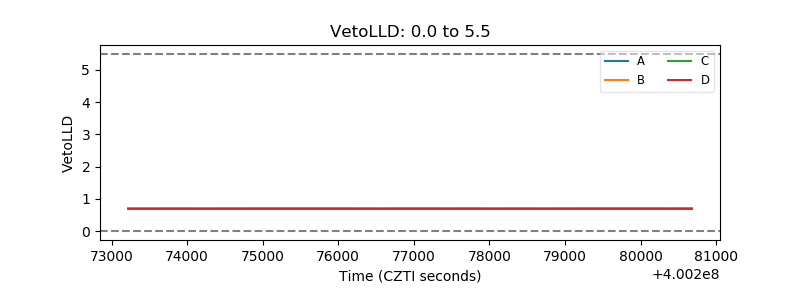 |
| Alpha Counter | 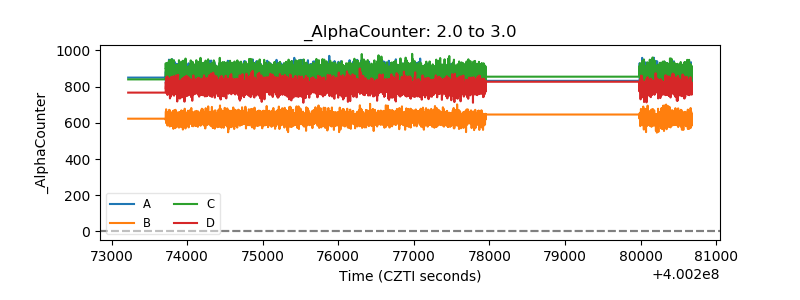 |
| _CPM_Rate | 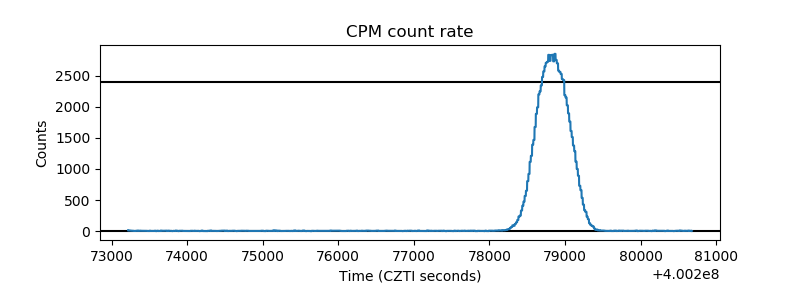 |
| CZT Counter | 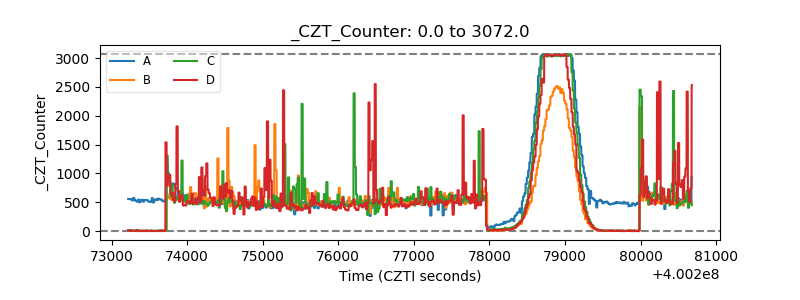 |
| +2.5 Volts monitor | 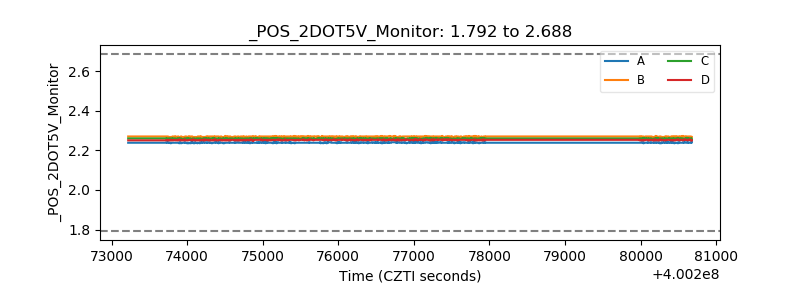 |
| +5 Volts monitor | 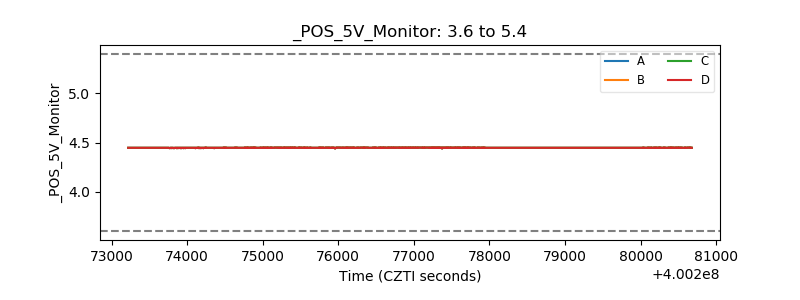 |
| _ROLL_ROT | 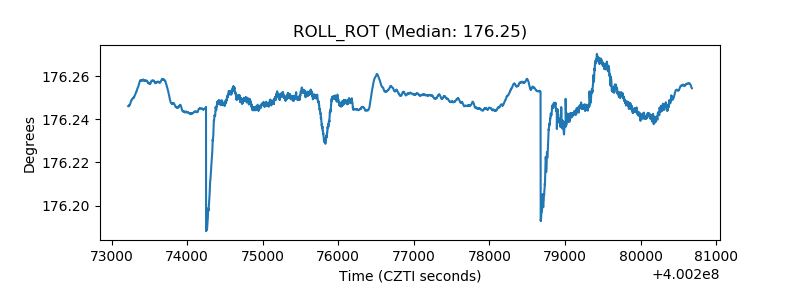 |
| _Roll_DEC | 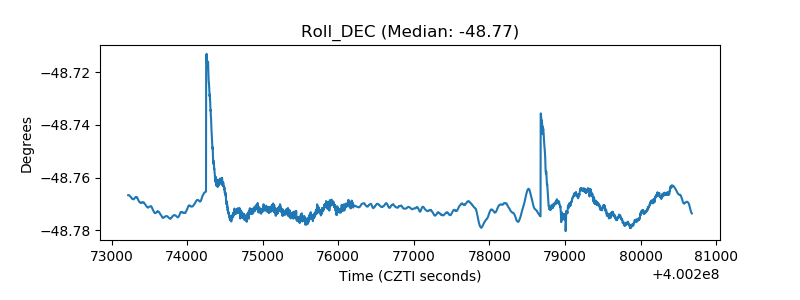 |
| _Roll_RA | 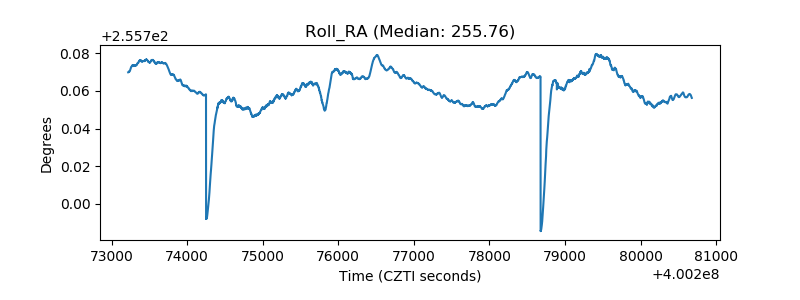 |
| Veto Counter | 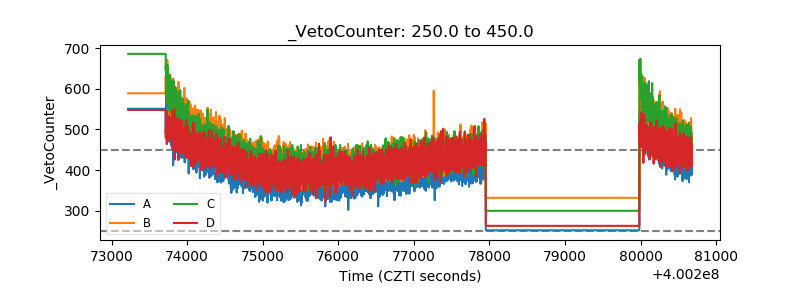 |