| Param | Original file | Final file |
|---|---|---|
| Filename | modeM0/AS1T05_051T01_9000005334_37550cztM0_level2.evt | modeM0/AS1T05_051T01_9000005334_37550cztM0_level2_quad_clean.evt |
| Size (bytes) | 400,412,160 | 59,232,960 |
| Size | 381.9 MB | 56.5 MB |
| Events in quadrant A | 2,622,239 | 368,296 |
| Events in quadrant B | 2,733,124 | 380,271 |
| Events in quadrant C | 3,322,869 | 356,607 |
| Events in quadrant D | 3,112,653 | 341,697 |
| Mode M9 | |||
|---|---|---|---|
| Quadrant | BADHDUFLAG | Total packets | Discarded packets |
| A | 0 | 34 | 0 |
| B | 0 | 34 | 0 |
| C | 0 | 34 | 0 |
| D | 0 | 35 | 0 |
| Mode M0 | |||
|---|---|---|---|
| Quadrant | BADHDUFLAG | Total packets | Discarded packets |
| A | 0 | 10725 | 3 |
| B | 0 | 11095 | 2 |
| C | 0 | 12821 | 2 |
| D | 0 | 12530 | 2 |
| Mode SS | |||
|---|---|---|---|
| Quadrant | BADHDUFLAG | Total packets | Discarded packets |
| A | 0 | 102 | 0 |
| B | 0 | 102 | 0 |
| C | 0 | 102 | 0 |
| D | 0 | 102 | 0 |
| Quadrant | Total seconds | Saturated seconds | Saturation percentage |
|---|---|---|---|
| A | 4932 | 11 | 0.223033% |
| B | 4932 | 24 | 0.486618% |
| C | 4932 | 310 | 6.285483% |
| D | 4932 | 164 | 3.325223% |
Noise dominated data is calculated using 1-second bins in cleaned event files. If a bin has >2000 counts, and if more than 50% of those come from <1% of pixels, then it is considered to be noise-dominated and hence unusable.
| Quadrant | # 1 sec bins | Bins with >0 counts | Bins with >2000 counts | High rate bins dominated by noise | Noise dominated (total time) | Noise dominated (detector-on time) | Marked lightcurve |
|---|---|---|---|---|---|---|---|
| A | 7055 | 4933 | 7 | 7 | 0.10% | 0.14% | 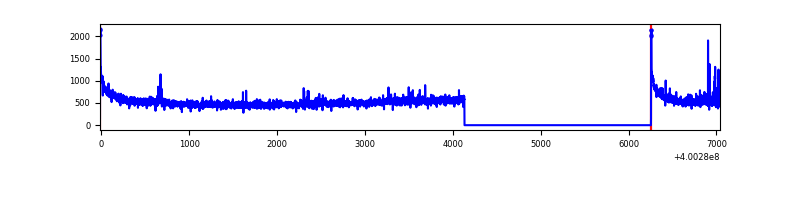 |
| B | 7055 | 4933 | 9 | 9 | 0.13% | 0.18% | 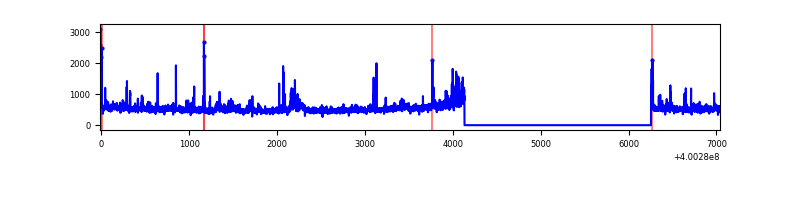 |
| C | 7055 | 4933 | 304 | 304 | 4.31% | 6.16% | 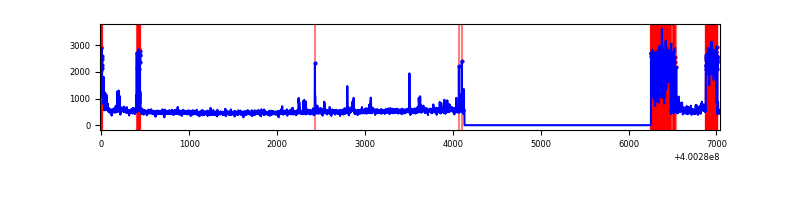 |
| D | 7055 | 4933 | 171 | 171 | 2.42% | 3.47% | 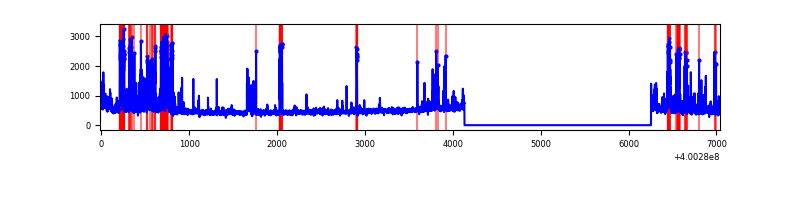 |
Top three noisy pixels from each quadrant. If the there are fewer than three noisy pixels in the level2.evt file, extra rows are filled as -1
| Pixel properties | Quadrant properties | ||||||
|---|---|---|---|---|---|---|---|
| Quadrant | DetID | PixID | Counts | Sigma | Mean | Median | Sigma |
| A | 10 | 83 | 278702 | 2356.25 | 585 | 574 | 118.0 |
| A | 6 | 10 | 30734 | 255.51 | 585 | 574 | 118.0 |
| A | 15 | 222 | 18025 | 147.84 | 585 | 574 | 118.0 |
| B | 0 | 189 | 59468 | 524.76 | 589 | 576 | 112.2 |
| B | 0 | 155 | 55944 | 493.36 | 589 | 576 | 112.2 |
| B | 0 | 213 | 49689 | 437.62 | 589 | 576 | 112.2 |
| C | 14 | 254 | 811745 | 6283.17 | 555 | 559 | 129.1 |
| C | 15 | 214 | 201657 | 1557.64 | 555 | 559 | 129.1 |
| C | 0 | 10 | 136318 | 1051.54 | 555 | 559 | 129.1 |
| D | 2 | 249 | 424426 | 3084.0 | 556 | 541 | 137.4 |
| D | 1 | 52 | 142643 | 1033.87 | 556 | 541 | 137.4 |
| D | 10 | 253 | 82994 | 599.89 | 556 | 541 | 137.4 |
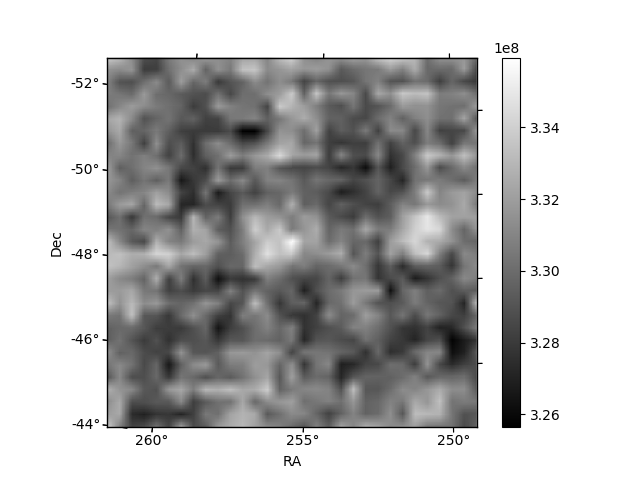
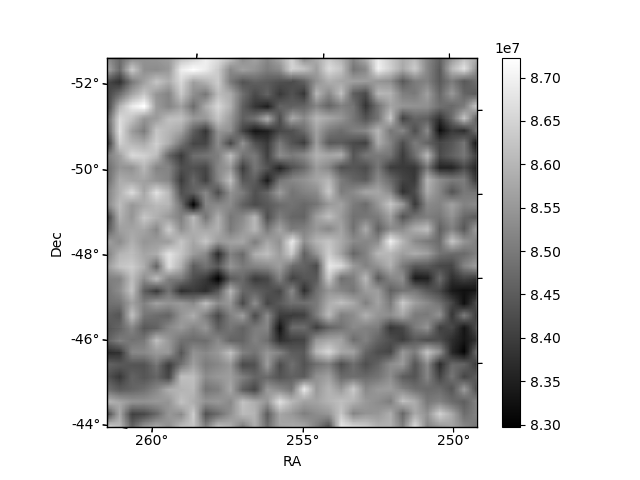
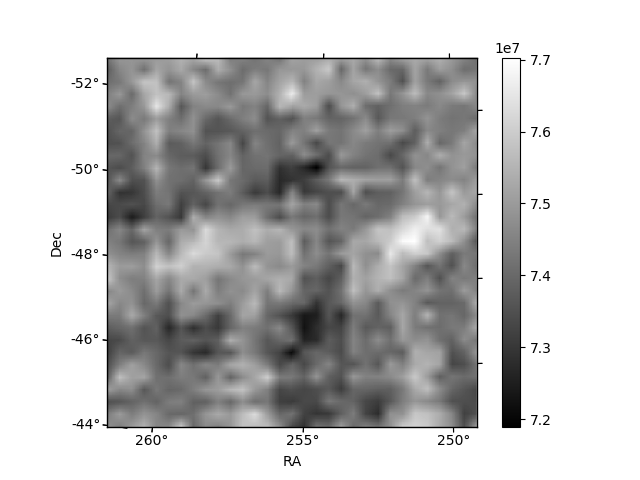
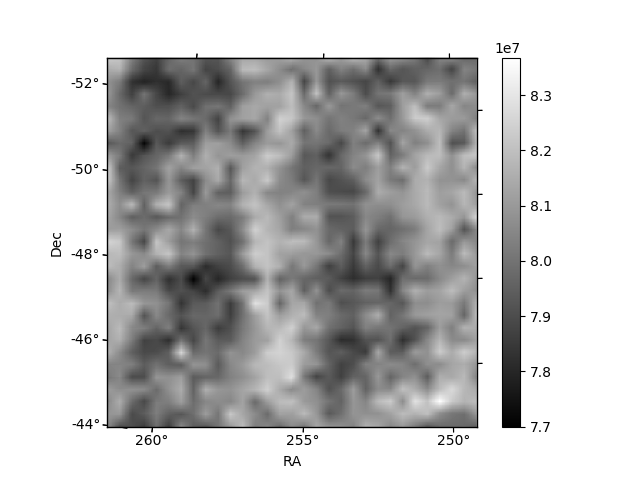
Histogram calculated using DETX and DETY for each event in the final _common_clean file
| Quadrant A | 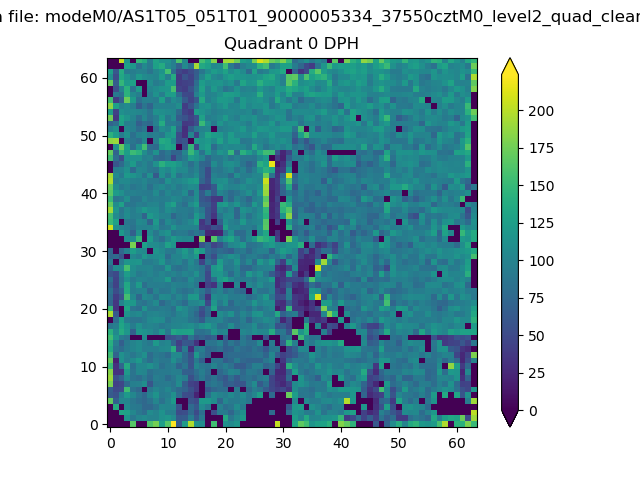 |
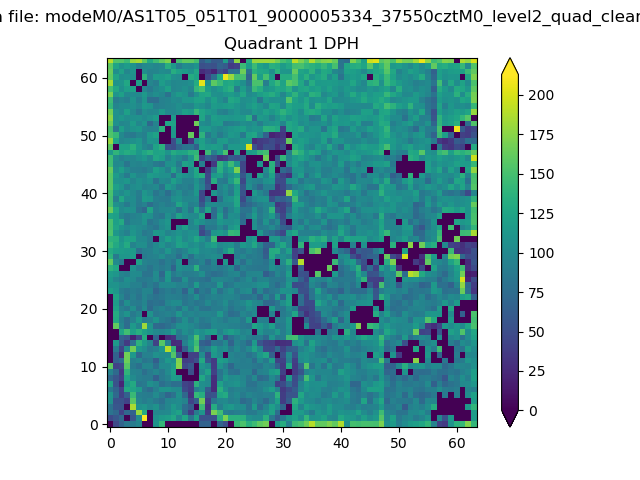 |
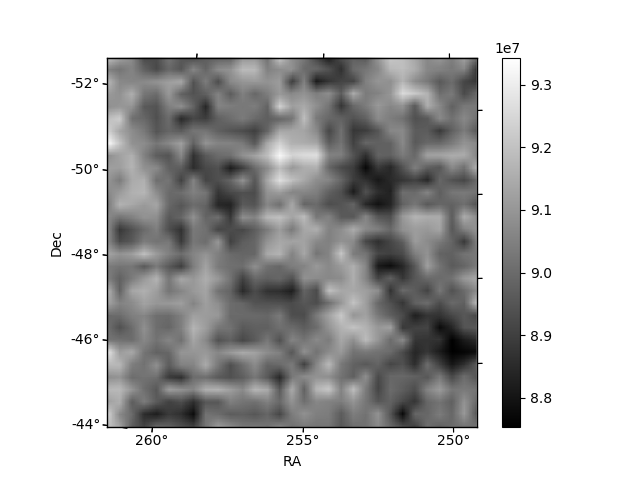
Quadrant B |
|---|---|---|---|
| Quadrant D | 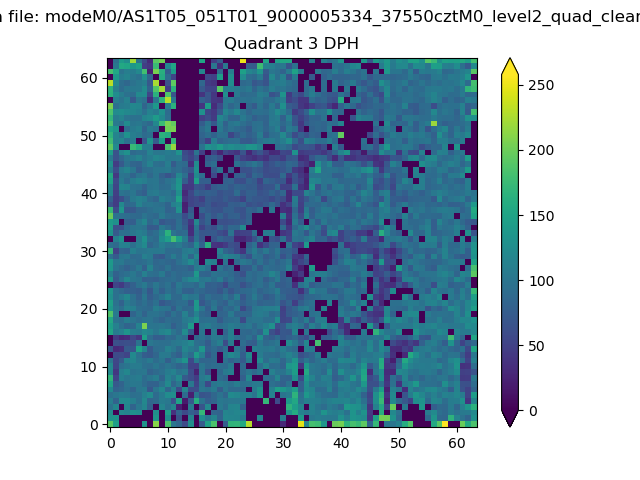 |
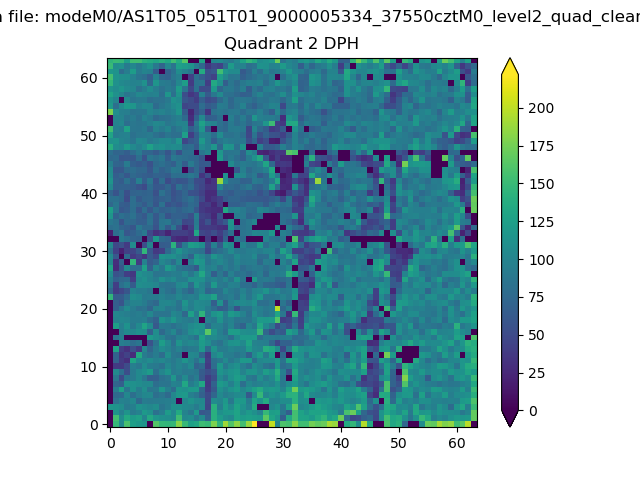 |
Quadrant C |
| Plot type | Count rate plots | Images |
|---|---|---|
| Comparison with Poisson distribution Blue bars denote a histogram of data divided into 1 sec bins. Red curve is a Poisson curve with rate = median count rate of data. |
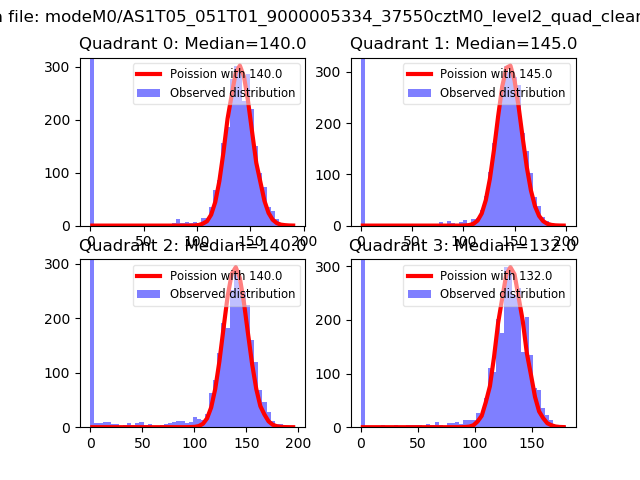 |
 |
| Quadrant-wise count rates Data is divided into 100 sec bins |
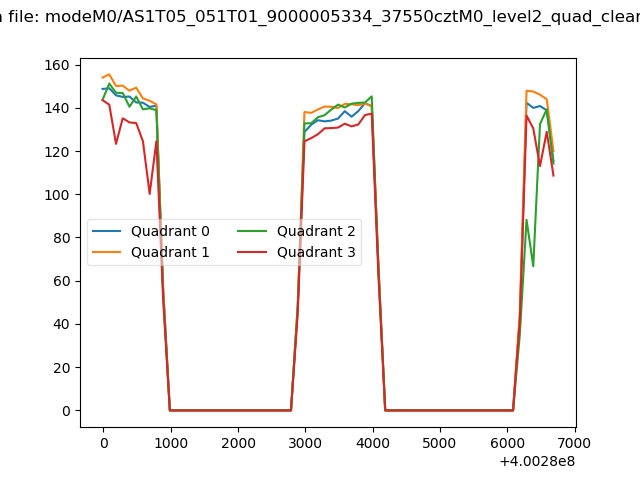 |
|
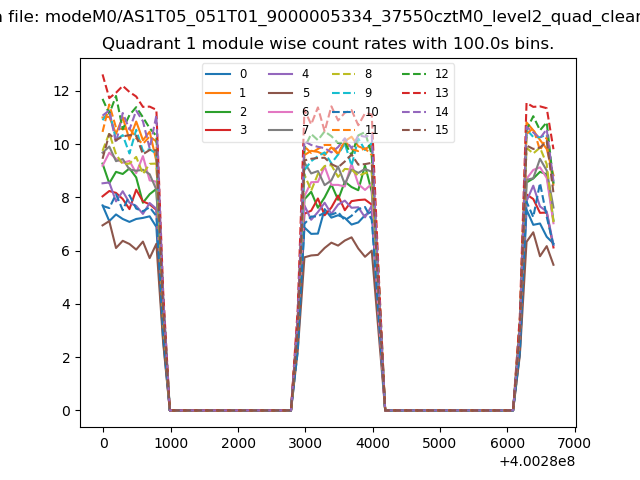
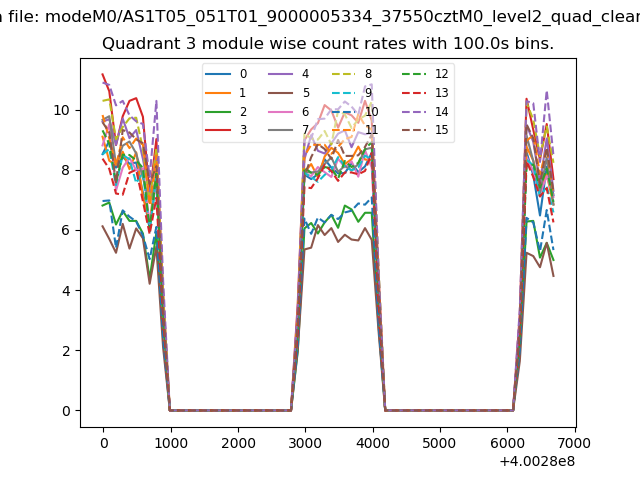
| Module-wise count rates for Quadrant A Data is divided into 100 sec bins |
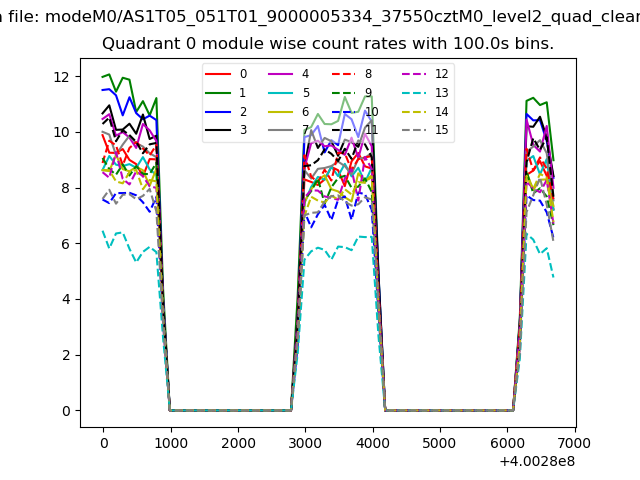 |
 |
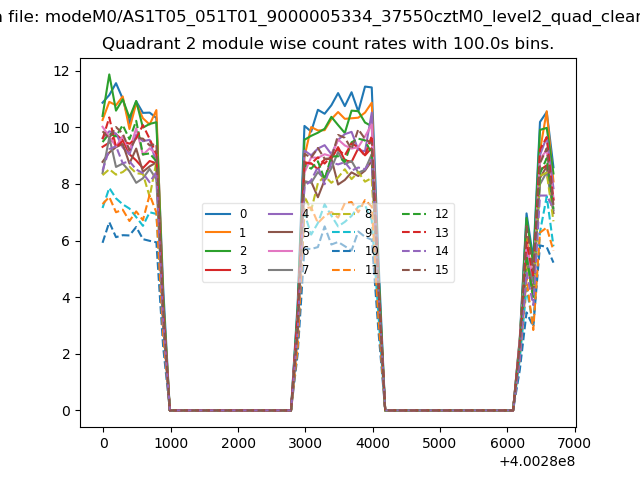
| Module-wise count rates for Quadrant B Data is divided into 100 sec bins |
 |
 |
| Module-wise count rates for Quadrant C Data is divided into 100 sec bins |
 |
 |
| Module-wise count rates for Quadrant D Data is divided into 100 sec bins |
 |
 |
| Parameter | Plot |
|---|---|
| CZT HV Monitor |  |
| D_VDD | 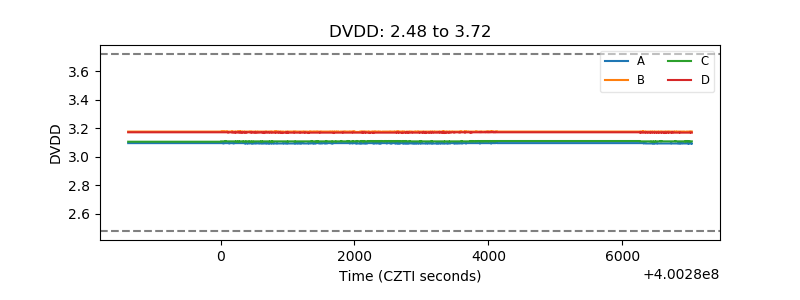 |
| Temperature 1 | 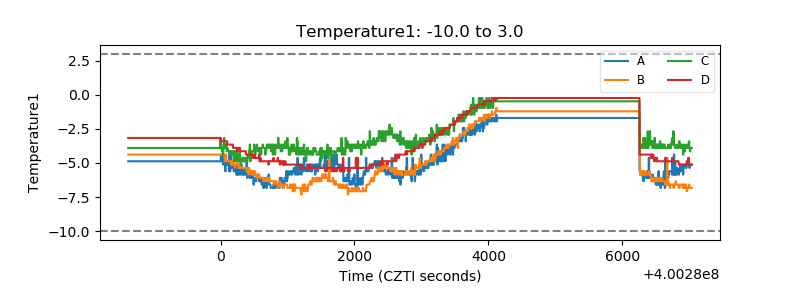 |
| Veto HV Monitor | 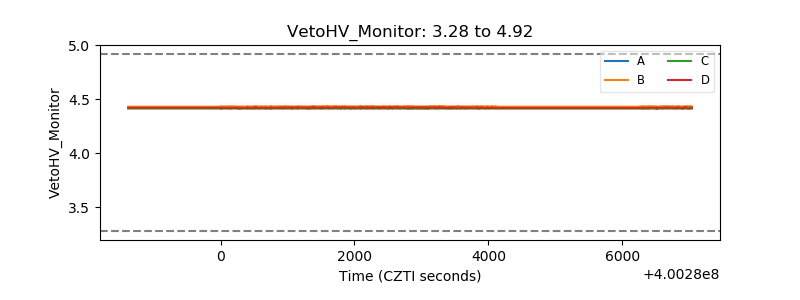 |
| Veto LLD | 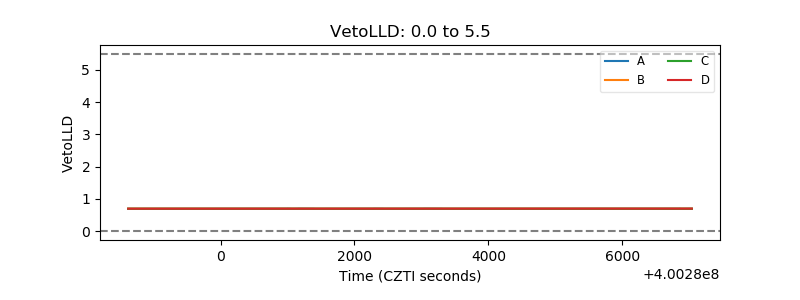 |
| Alpha Counter | 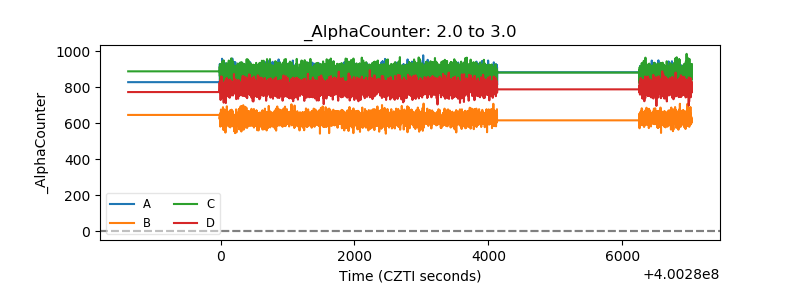 |
| _CPM_Rate | 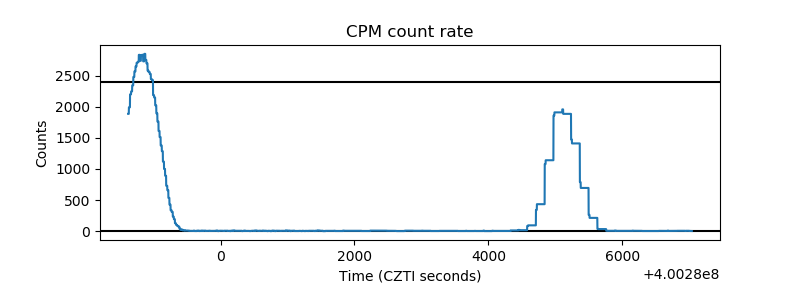 |
| CZT Counter | 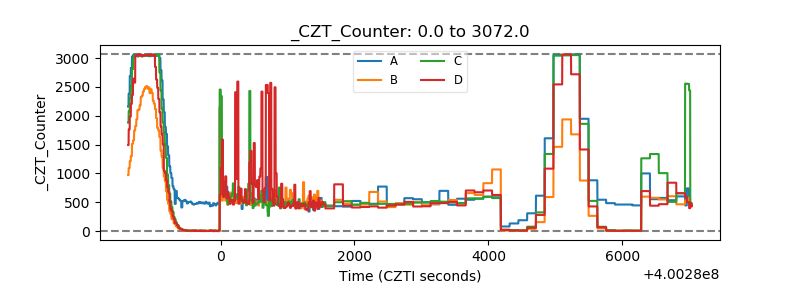 |
| +2.5 Volts monitor | 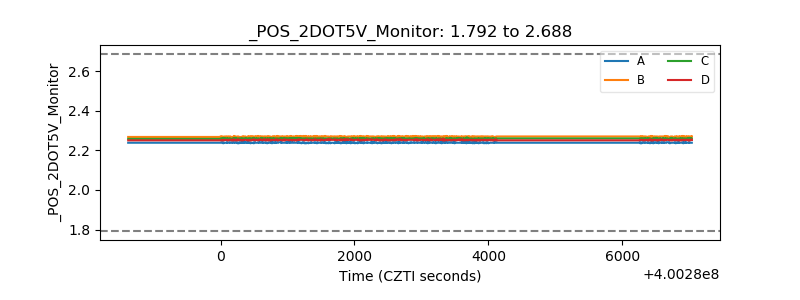 |
| +5 Volts monitor | 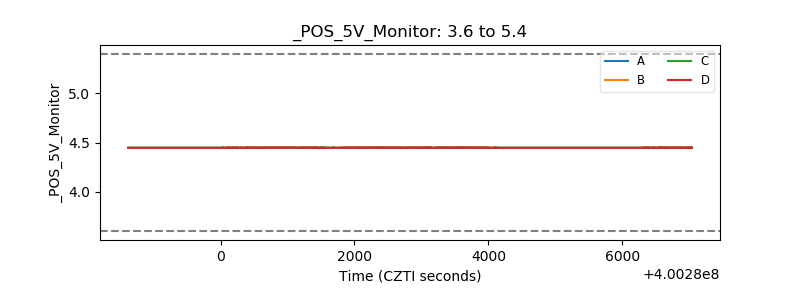 |
| _ROLL_ROT | 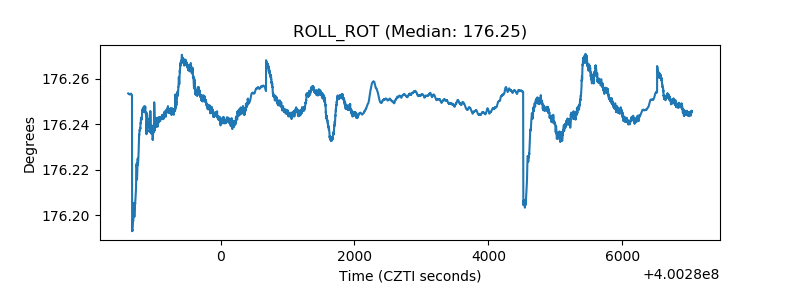 |
| _Roll_DEC | 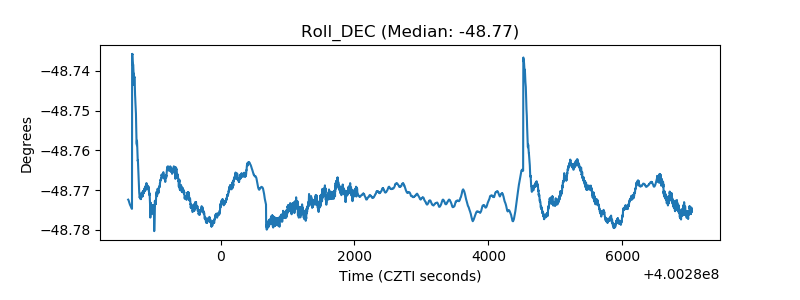 |
| _Roll_RA | 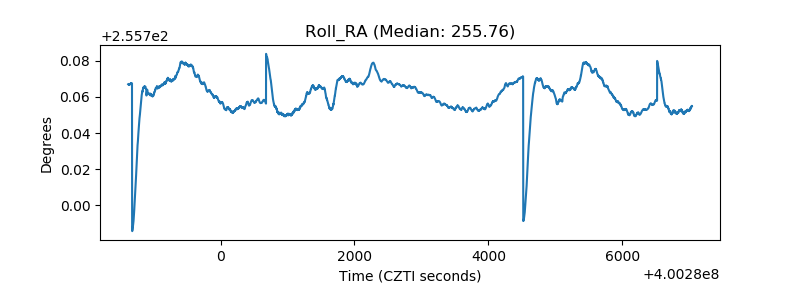 |
| Veto Counter | 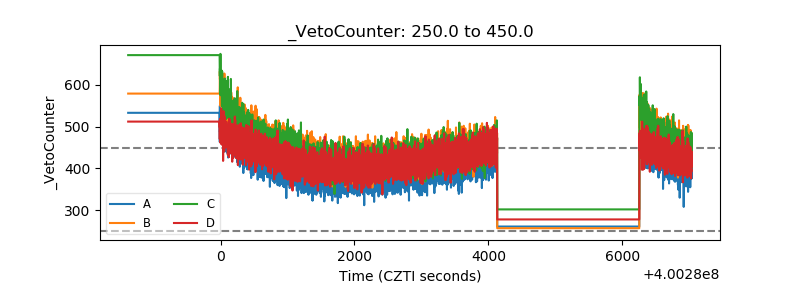 |