| Param | Original file | Final file |
|---|---|---|
| Filename | modeM0/AS1T05_051T01_9000005334_37551cztM0_level2.evt | modeM0/AS1T05_051T01_9000005334_37551cztM0_level2_quad_clean.evt |
| Size (bytes) | 381,006,720 | 50,077,440 |
| Size | 363.4 MB | 47.8 MB |
| Events in quadrant A | 2,601,762 | 298,792 |
| Events in quadrant B | 2,730,051 | 307,328 |
| Events in quadrant C | 3,191,798 | 288,357 |
| Events in quadrant D | 2,687,826 | 283,517 |
| Mode M9 | |||
|---|---|---|---|
| Quadrant | BADHDUFLAG | Total packets | Discarded packets |
| A | 0 | 32 | 0 |
| B | 0 | 32 | 0 |
| C | 0 | 32 | 0 |
| D | 0 | 33 | 0 |
| Mode M0 | |||
|---|---|---|---|
| Quadrant | BADHDUFLAG | Total packets | Discarded packets |
| A | 0 | 10610 | 3 |
| B | 0 | 11193 | 2 |
| C | 0 | 12310 | 2 |
| D | 0 | 11265 | 2 |
| Mode SS | |||
|---|---|---|---|
| Quadrant | BADHDUFLAG | Total packets | Discarded packets |
| A | 0 | 96 | 0 |
| B | 0 | 96 | 0 |
| C | 0 | 96 | 0 |
| D | 0 | 96 | 0 |
| Quadrant | Total seconds | Saturated seconds | Saturation percentage |
|---|---|---|---|
| A | 4820 | 12 | 0.248963% |
| B | 4820 | 41 | 0.850622% |
| C | 4820 | 301 | 6.244813% |
| D | 4820 | 62 | 1.286307% |
Noise dominated data is calculated using 1-second bins in cleaned event files. If a bin has >2000 counts, and if more than 50% of those come from <1% of pixels, then it is considered to be noise-dominated and hence unusable.
| Quadrant | # 1 sec bins | Bins with >0 counts | Bins with >2000 counts | High rate bins dominated by noise | Noise dominated (total time) | Noise dominated (detector-on time) | Marked lightcurve |
|---|---|---|---|---|---|---|---|
| A | 6943 | 4821 | 5 | 5 | 0.07% | 0.10% |  |
| B | 6943 | 4821 | 22 | 22 | 0.32% | 0.46% | 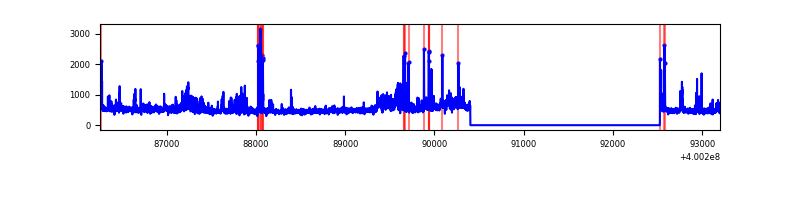 |
| C | 6943 | 4821 | 285 | 285 | 4.10% | 5.91% | 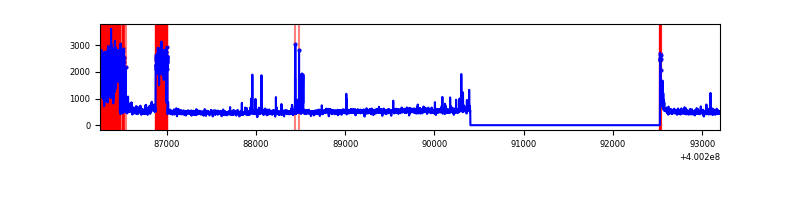 |
| D | 6943 | 4821 | 61 | 61 | 0.88% | 1.27% |  |
Top three noisy pixels from each quadrant. If the there are fewer than three noisy pixels in the level2.evt file, extra rows are filled as -1
| Pixel properties | Quadrant properties | ||||||
|---|---|---|---|---|---|---|---|
| Quadrant | DetID | PixID | Counts | Sigma | Mean | Median | Sigma |
| A | 10 | 83 | 271574 | 2363.05 | 566 | 556 | 114.7 |
| A | 15 | 222 | 70126 | 606.59 | 566 | 556 | 114.7 |
| A | 6 | 10 | 30358 | 259.85 | 566 | 556 | 114.7 |
| B | 0 | 189 | 175769 | 1619.0 | 567 | 552 | 108.2 |
| B | 5 | 172 | 81256 | 745.7 | 567 | 552 | 108.2 |
| B | 5 | 255 | 76632 | 702.97 | 567 | 552 | 108.2 |
| C | 14 | 254 | 758395 | 6074.51 | 537 | 541 | 124.8 |
| C | 15 | 214 | 200219 | 1600.5 | 537 | 541 | 124.8 |
| C | 0 | 10 | 111939 | 892.9 | 537 | 541 | 124.8 |
| D | 2 | 249 | 191325 | 1440.69 | 544 | 530 | 132.4 |
| D | 12 | 217 | 113437 | 852.56 | 544 | 530 | 132.4 |
| D | 13 | 249 | 61560 | 460.84 | 544 | 530 | 132.4 |
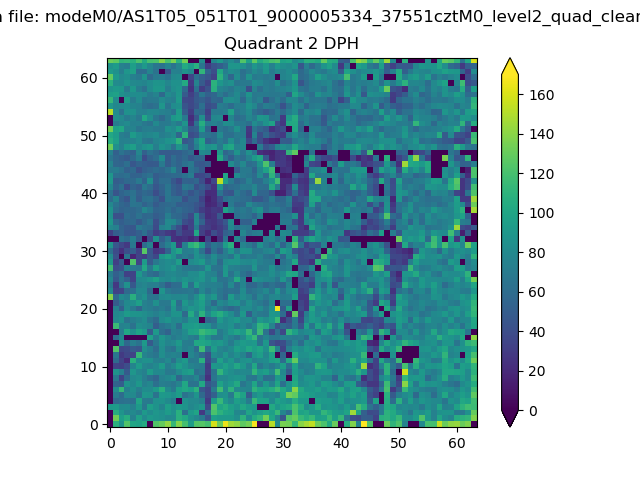
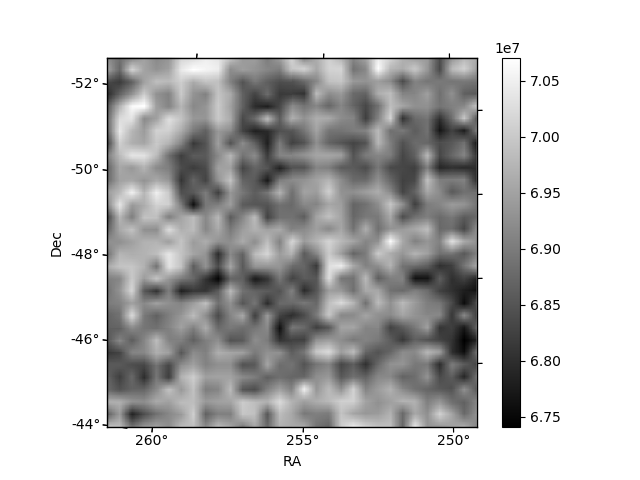
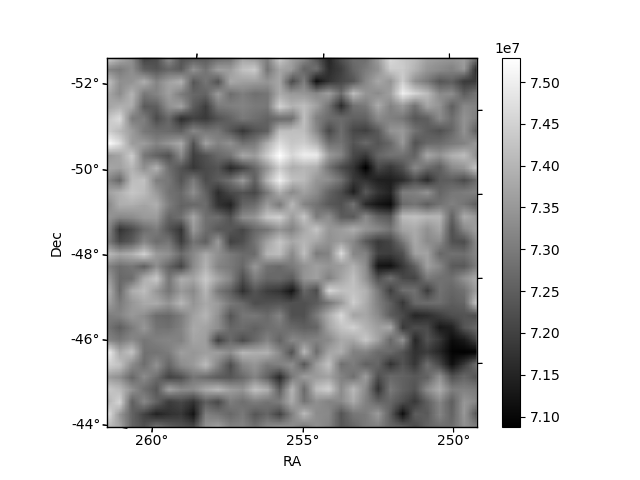
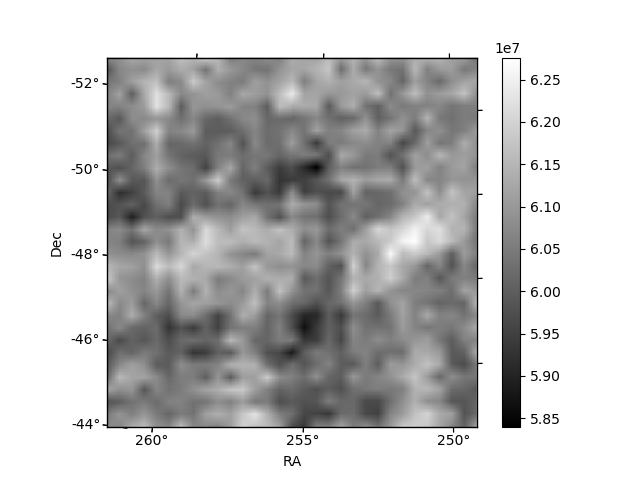
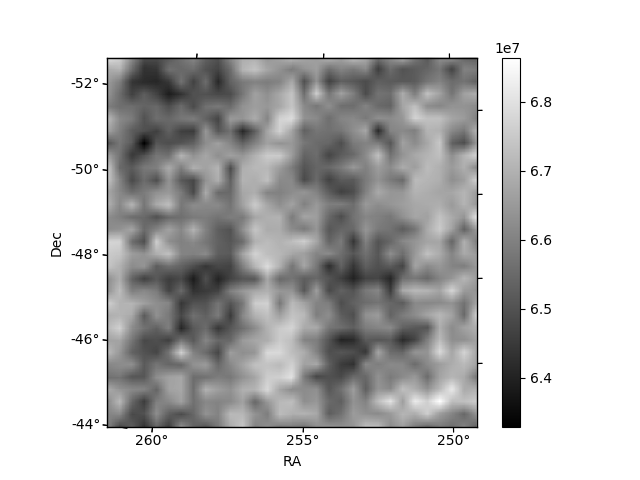
Histogram calculated using DETX and DETY for each event in the final _common_clean file
| Quadrant A | 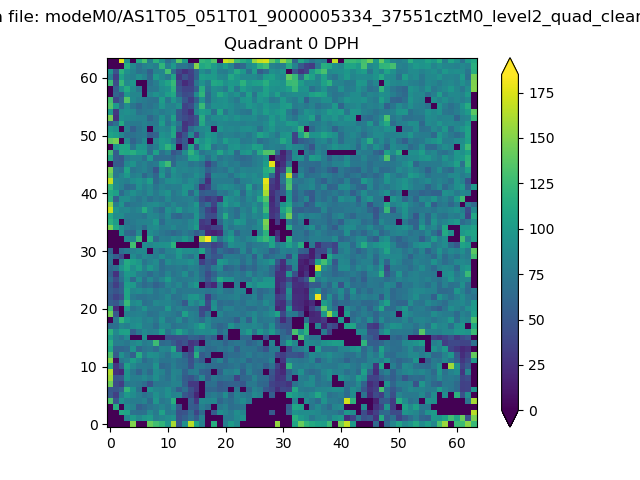 |
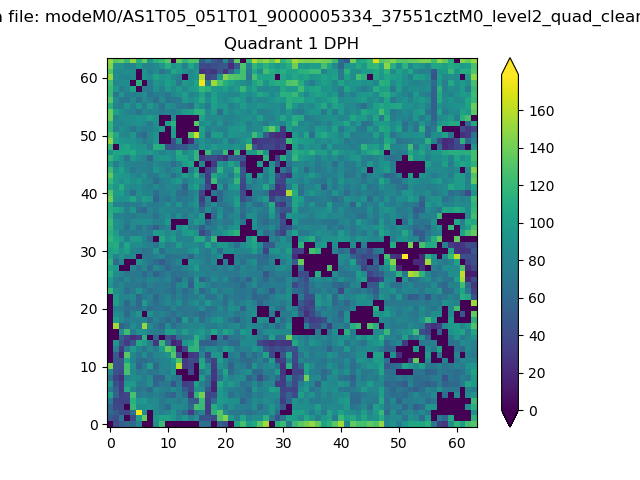 |
Quadrant B |
|---|---|---|---|
| Quadrant D |  |
 |
Quadrant C |
| Plot type | Count rate plots | Images |
|---|---|---|
| Comparison with Poisson distribution Blue bars denote a histogram of data divided into 1 sec bins. Red curve is a Poisson curve with rate = median count rate of data. |
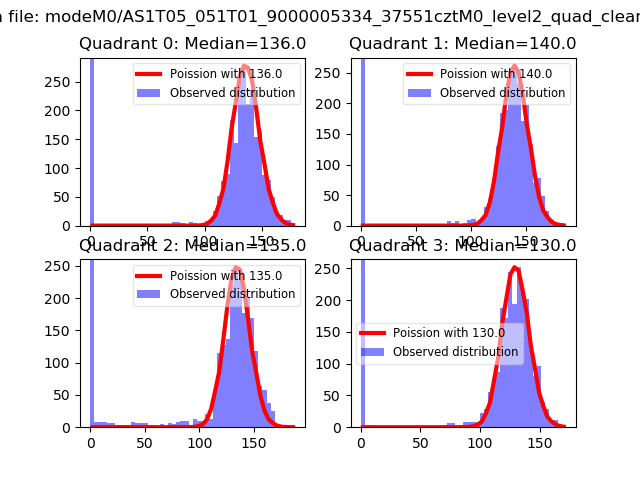 |
 |
| Quadrant-wise count rates Data is divided into 100 sec bins |
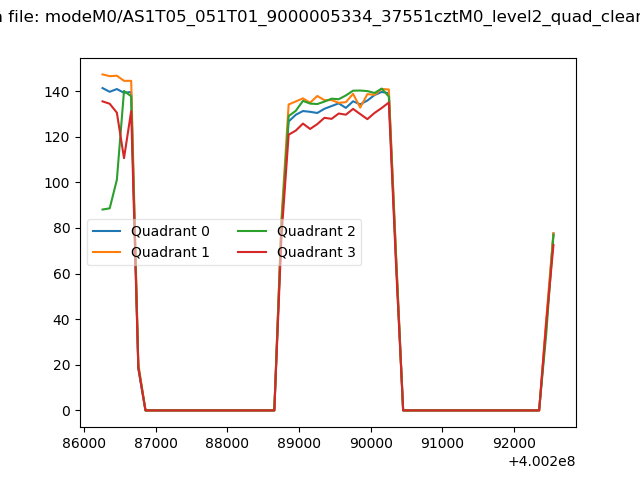 |
|
| Module-wise count rates for Quadrant A Data is divided into 100 sec bins |
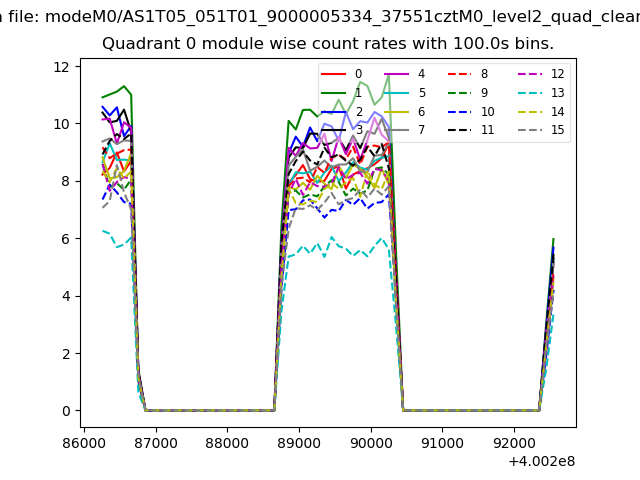 |
 |
| Module-wise count rates for Quadrant B Data is divided into 100 sec bins |
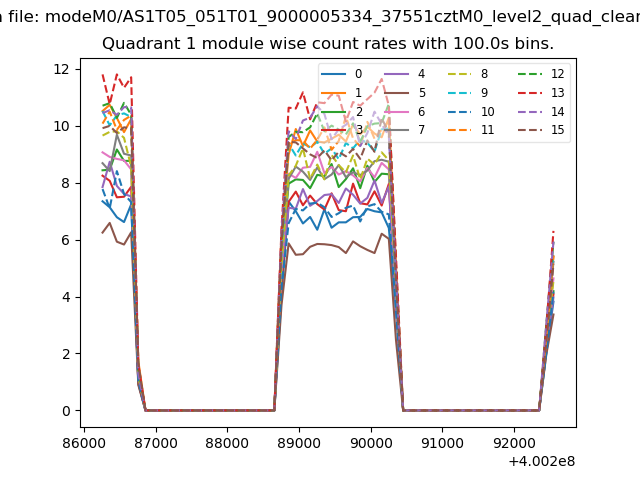 |
 |
| Module-wise count rates for Quadrant C Data is divided into 100 sec bins |
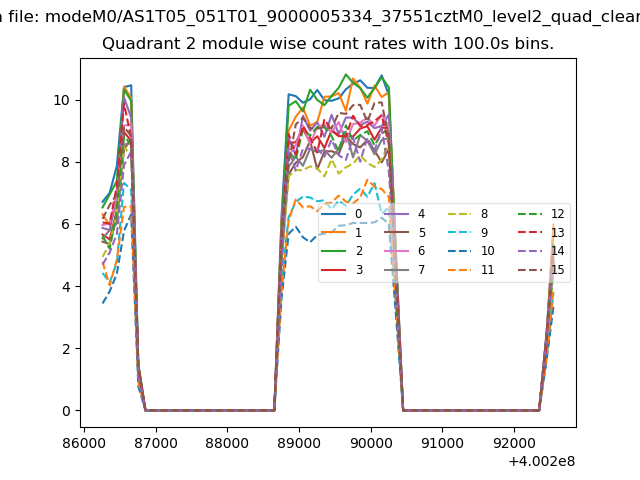 |
 |
| Module-wise count rates for Quadrant D Data is divided into 100 sec bins |
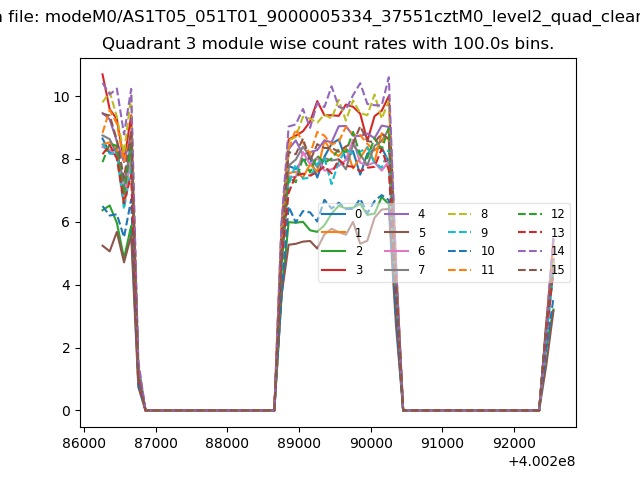 |
 |
| Parameter | Plot |
|---|---|
| CZT HV Monitor | 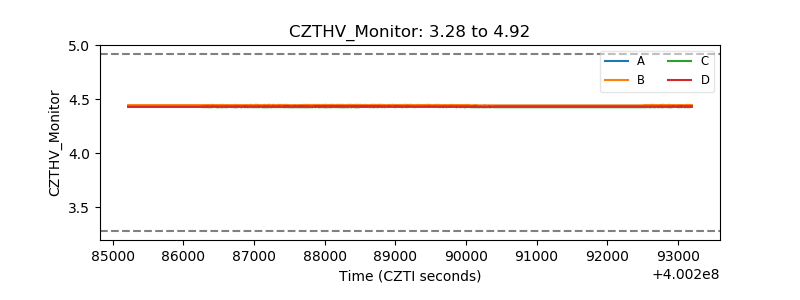 |
| D_VDD | 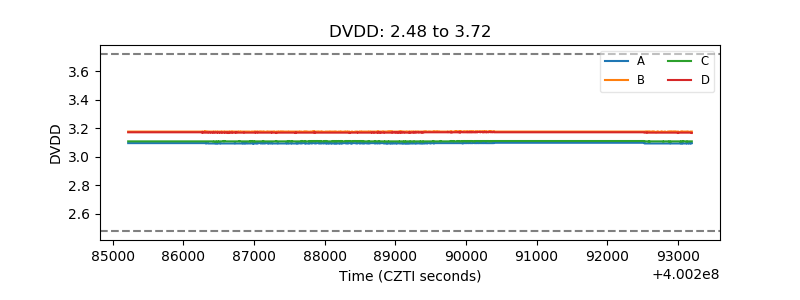 |
| Temperature 1 | 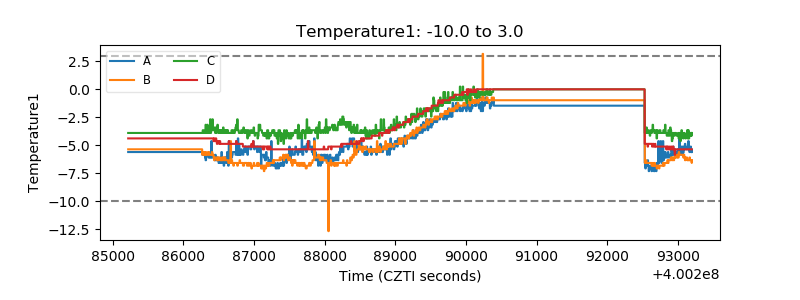 |
| Veto HV Monitor | 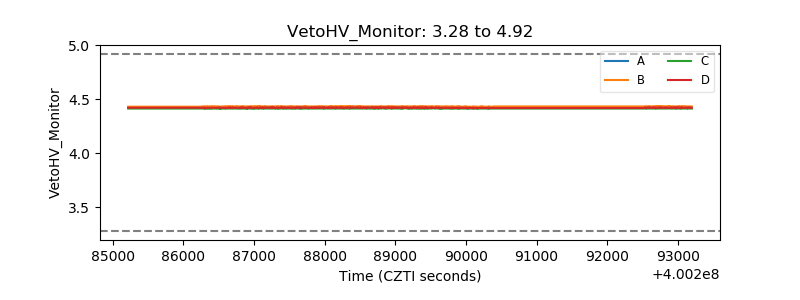 |
| Veto LLD | 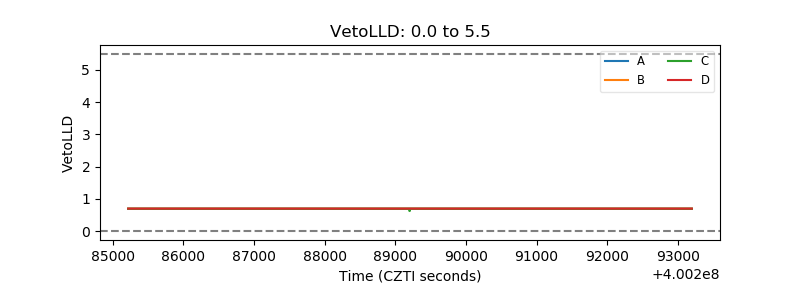 |
| Alpha Counter | 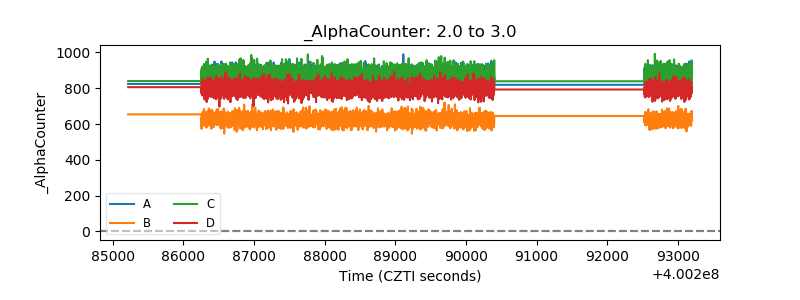 |
| _CPM_Rate | 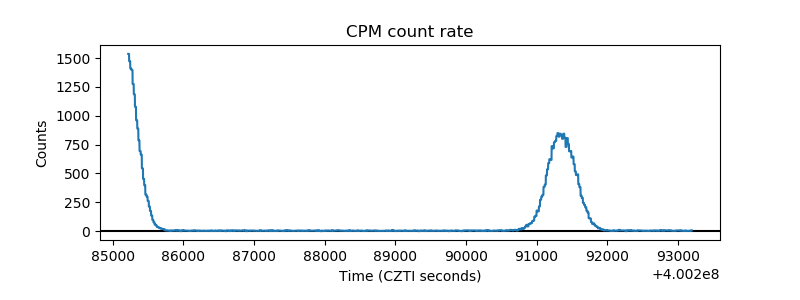 |
| CZT Counter | 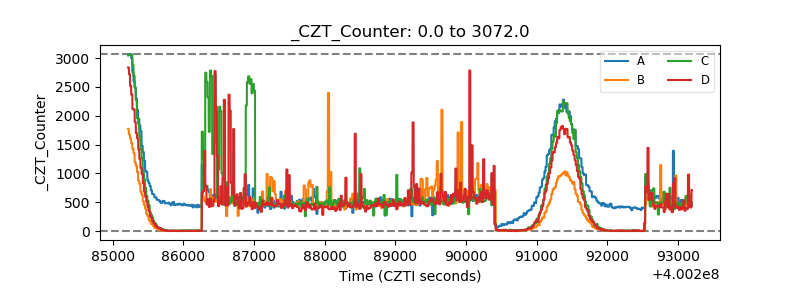 |
| +2.5 Volts monitor | 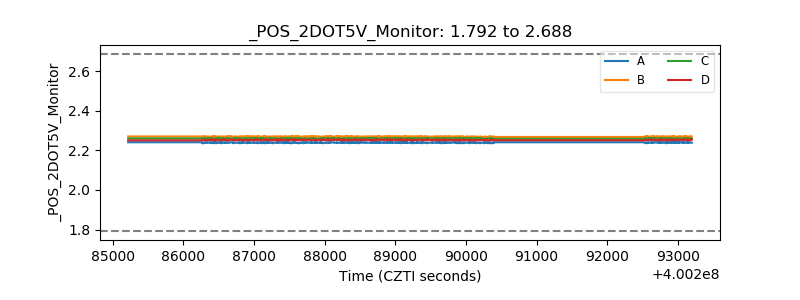 |
| +5 Volts monitor | 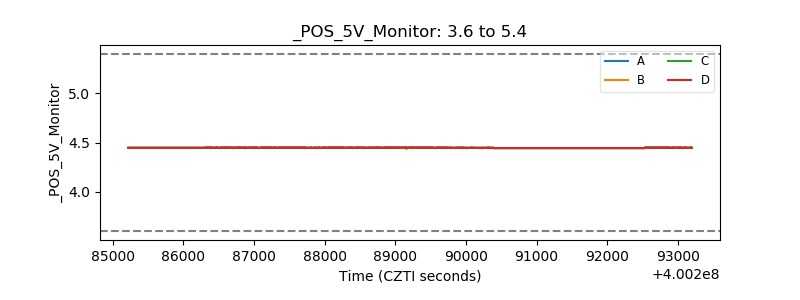 |
| _ROLL_ROT | 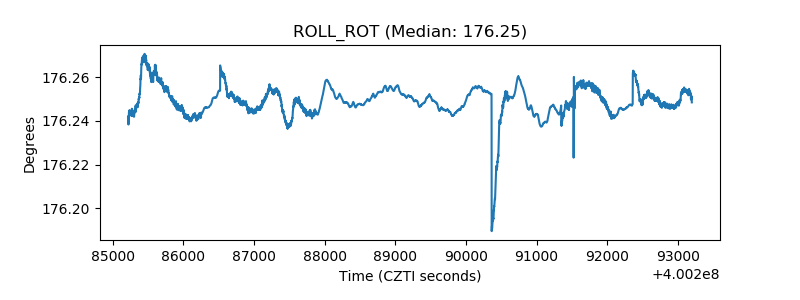 |
| _Roll_DEC | 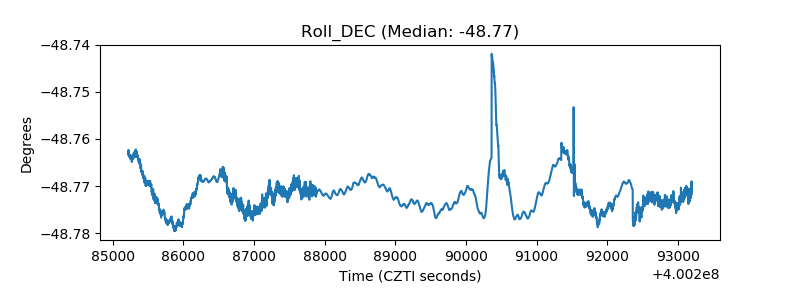 |
| _Roll_RA | 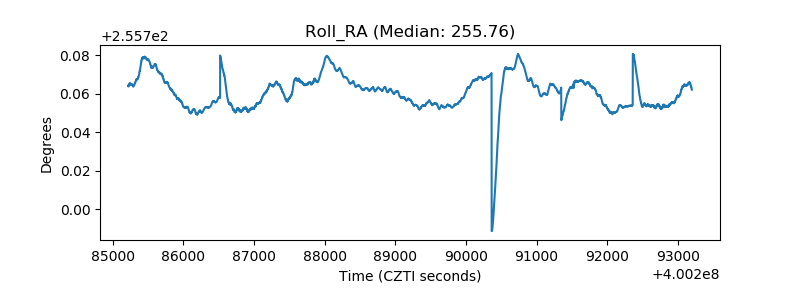 |
| Veto Counter | 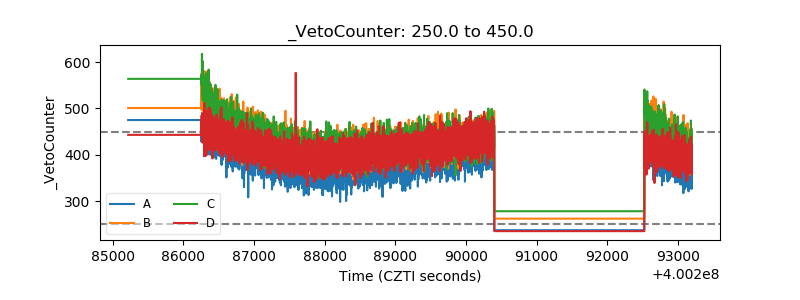 |