| Param | Original file | Final file |
|---|---|---|
| Filename | modeM0/AS1T05_051T01_9000005334_37552cztM0_level2.evt | modeM0/AS1T05_051T01_9000005334_37552cztM0_level2_quad_clean.evt |
| Size (bytes) | 384,341,760 | 50,771,520 |
| Size | 366.5 MB | 48.4 MB |
| Events in quadrant A | 2,691,816 | 292,533 |
| Events in quadrant B | 3,071,996 | 296,526 |
| Events in quadrant C | 2,884,931 | 297,487 |
| Events in quadrant D | 2,633,202 | 281,959 |
| Mode M9 | |||
|---|---|---|---|
| Quadrant | BADHDUFLAG | Total packets | Discarded packets |
| A | 0 | 39 | 0 |
| B | 0 | 39 | 0 |
| C | 0 | 39 | 0 |
| D | 0 | 40 | 0 |
| Mode M0 | |||
|---|---|---|---|
| Quadrant | BADHDUFLAG | Total packets | Discarded packets |
| A | 0 | 11094 | 3 |
| B | 0 | 12508 | 2 |
| C | 0 | 11629 | 2 |
| D | 0 | 11512 | 2 |
| Mode SS | |||
|---|---|---|---|
| Quadrant | BADHDUFLAG | Total packets | Discarded packets |
| A | 0 | 106 | 0 |
| B | 0 | 106 | 0 |
| C | 0 | 106 | 0 |
| D | 0 | 106 | 0 |
| Quadrant | Total seconds | Saturated seconds | Saturation percentage |
|---|---|---|---|
| A | 5265 | 7 | 0.132953% |
| B | 5265 | 95 | 1.804368% |
| C | 5265 | 55 | 1.044634% |
| D | 5265 | 36 | 0.683761% |
Noise dominated data is calculated using 1-second bins in cleaned event files. If a bin has >2000 counts, and if more than 50% of those come from <1% of pixels, then it is considered to be noise-dominated and hence unusable.
| Quadrant | # 1 sec bins | Bins with >0 counts | Bins with >2000 counts | High rate bins dominated by noise | Noise dominated (total time) | Noise dominated (detector-on time) | Marked lightcurve |
|---|---|---|---|---|---|---|---|
| A | 7268 | 5266 | 1 | 1 | 0.01% | 0.02% | 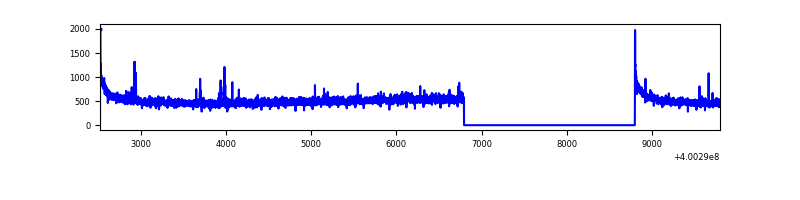 |
| B | 7268 | 5266 | 63 | 63 | 0.87% | 1.20% | 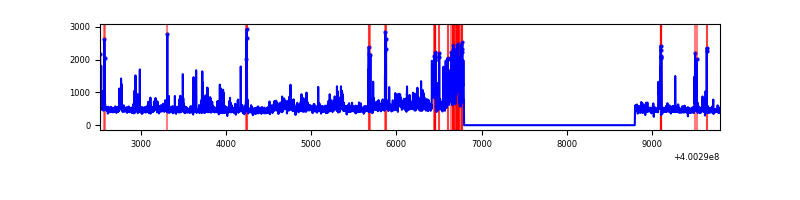 |
| C | 7268 | 5266 | 52 | 52 | 0.72% | 0.99% | 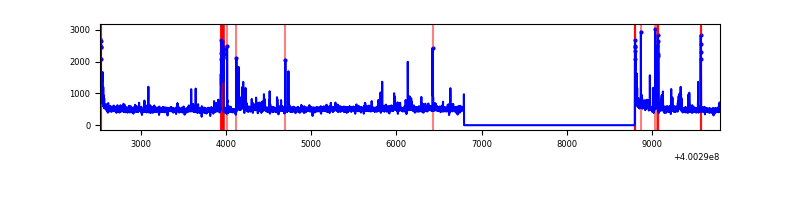 |
| D | 7268 | 5266 | 30 | 30 | 0.41% | 0.57% | 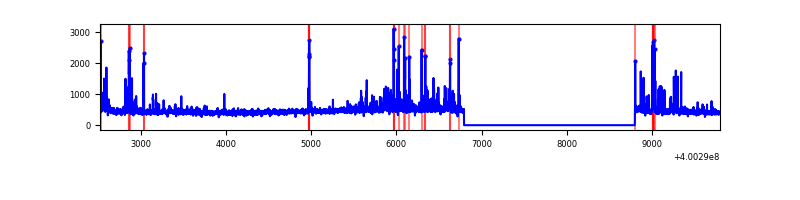 |
Top three noisy pixels from each quadrant. If the there are fewer than three noisy pixels in the level2.evt file, extra rows are filled as -1
| Pixel properties | Quadrant properties | ||||||
|---|---|---|---|---|---|---|---|
| Quadrant | DetID | PixID | Counts | Sigma | Mean | Median | Sigma |
| A | 10 | 83 | 289303 | 2362.16 | 603 | 591 | 122.2 |
| A | 7 | 3 | 18561 | 147.03 | 603 | 591 | 122.2 |
| A | 13 | 6 | 17322 | 136.89 | 603 | 591 | 122.2 |
| B | 3 | 112 | 227669 | 1972.13 | 603 | 588 | 115.1 |
| B | 0 | 189 | 106094 | 916.29 | 603 | 588 | 115.1 |
| B | 5 | 172 | 79522 | 685.52 | 603 | 588 | 115.1 |
| C | 15 | 214 | 226659 | 1629.91 | 593 | 598 | 138.7 |
| C | 14 | 254 | 178259 | 1280.94 | 593 | 598 | 138.7 |
| C | 0 | 10 | 74285 | 531.29 | 593 | 598 | 138.7 |
| D | 13 | 249 | 107800 | 747.87 | 587 | 571 | 143.4 |
| D | 2 | 249 | 93113 | 645.43 | 587 | 571 | 143.4 |
| D | 2 | 153 | 43032 | 296.14 | 587 | 571 | 143.4 |
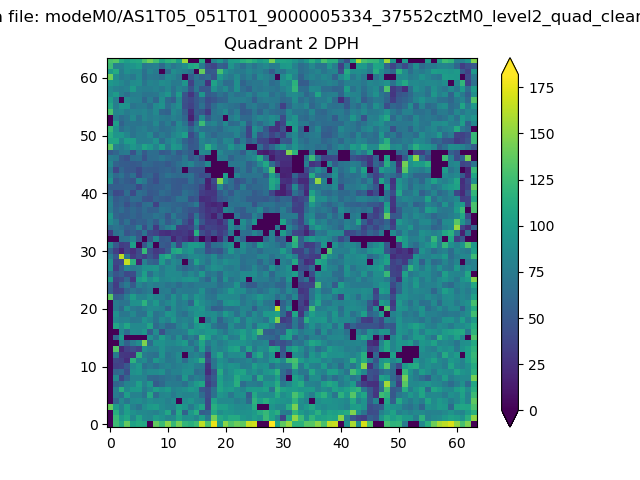
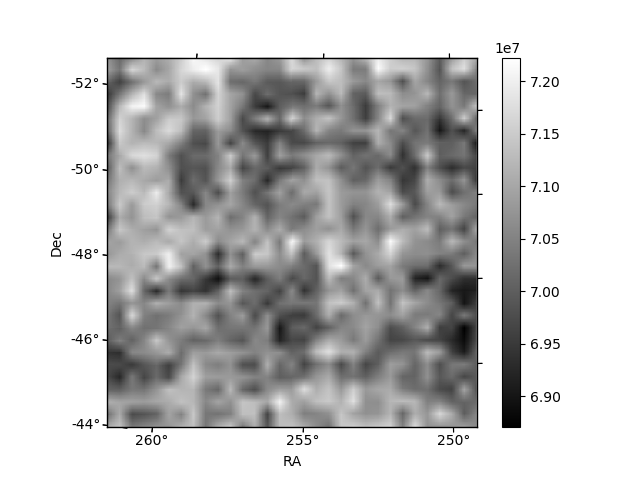
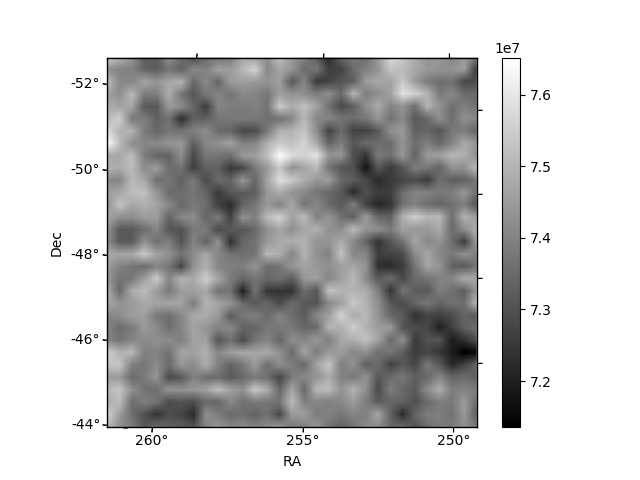
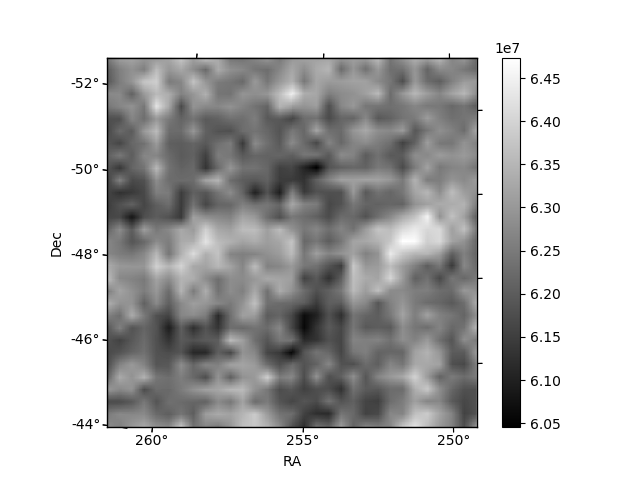
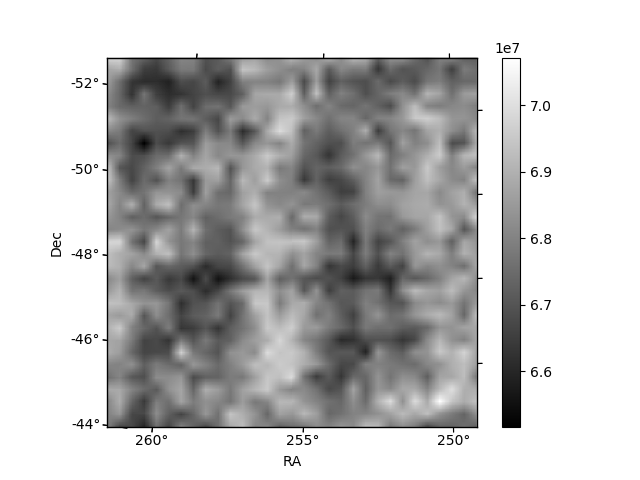
Histogram calculated using DETX and DETY for each event in the final _common_clean file
| Quadrant A | 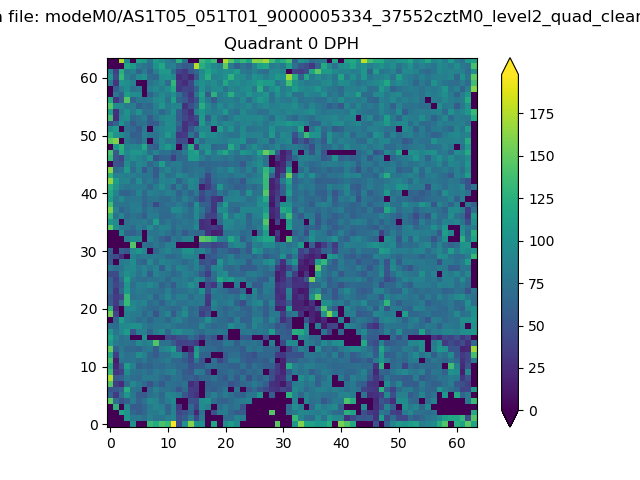 |
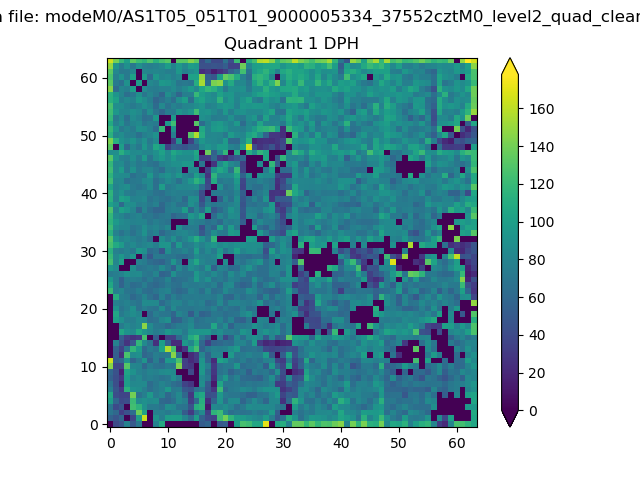 |
Quadrant B |
|---|---|---|---|
| Quadrant D | 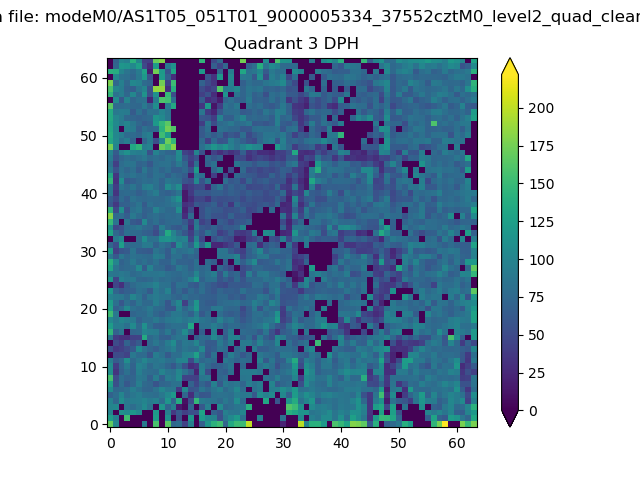 |
 |
Quadrant C |
| Plot type | Count rate plots | Images |
|---|---|---|
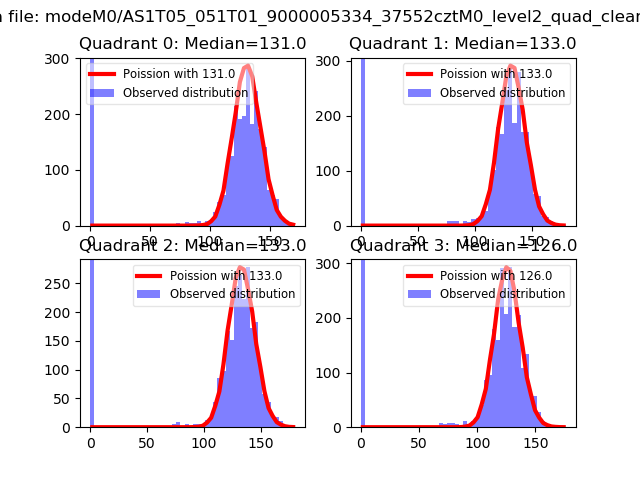
| Comparison with Poisson distribution Blue bars denote a histogram of data divided into 1 sec bins. Red curve is a Poisson curve with rate = median count rate of data. |
 |
 |
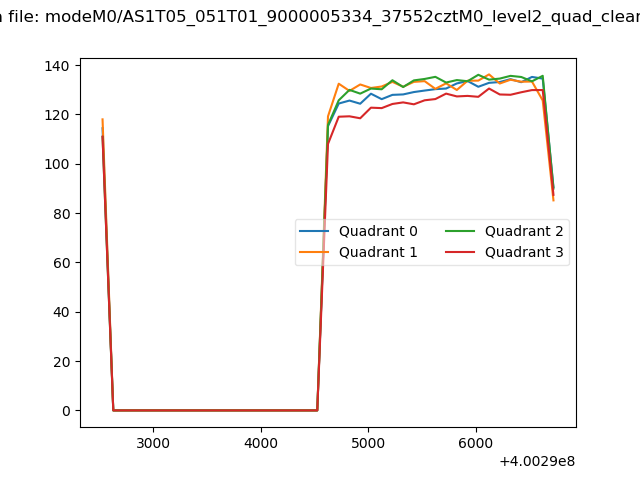
| Quadrant-wise count rates Data is divided into 100 sec bins |
 |
|
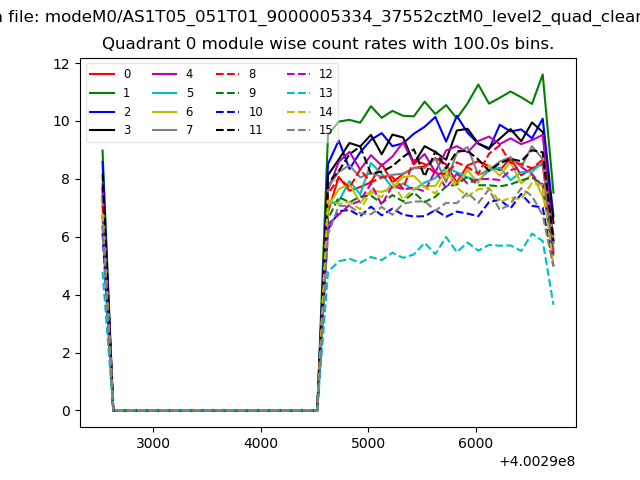
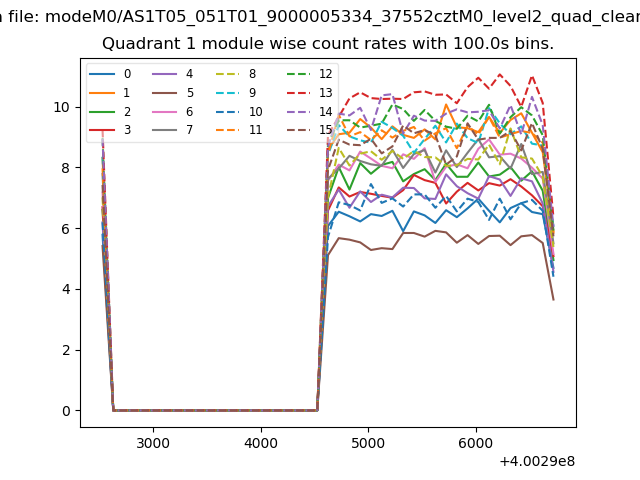
| Module-wise count rates for Quadrant A Data is divided into 100 sec bins |
 |
 |
| Module-wise count rates for Quadrant B Data is divided into 100 sec bins |
 |
 |
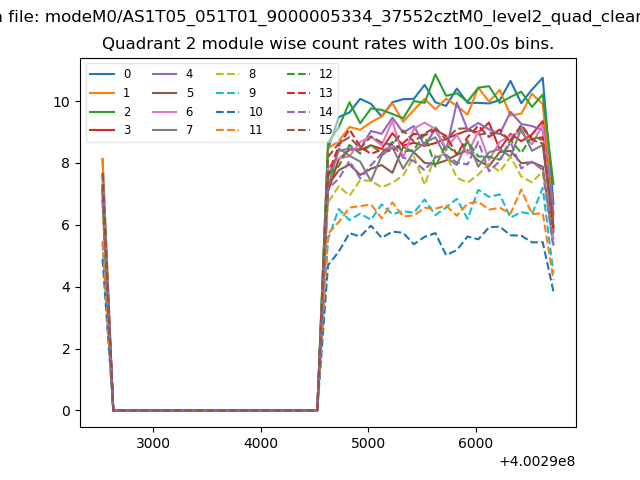
| Module-wise count rates for Quadrant C Data is divided into 100 sec bins |
 |
 |
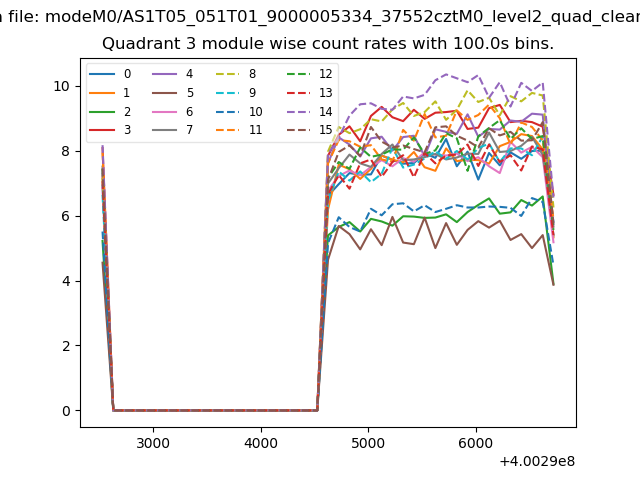
| Module-wise count rates for Quadrant D Data is divided into 100 sec bins |
 |
 |
| Parameter | Plot |
|---|---|
| CZT HV Monitor | 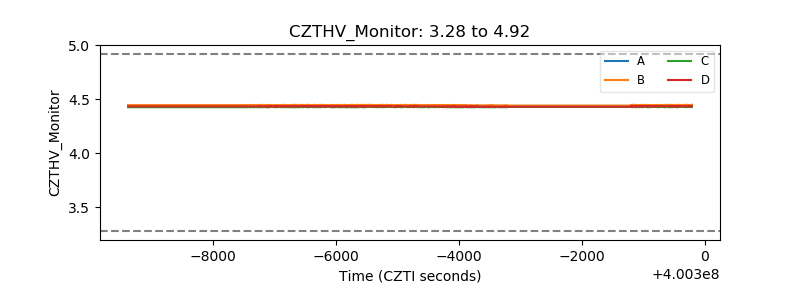 |
| D_VDD | 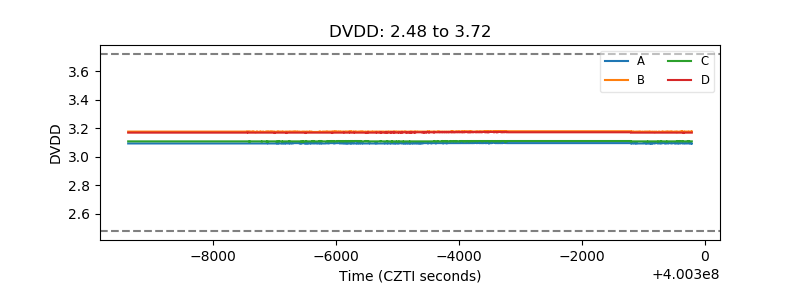 |
| Temperature 1 | 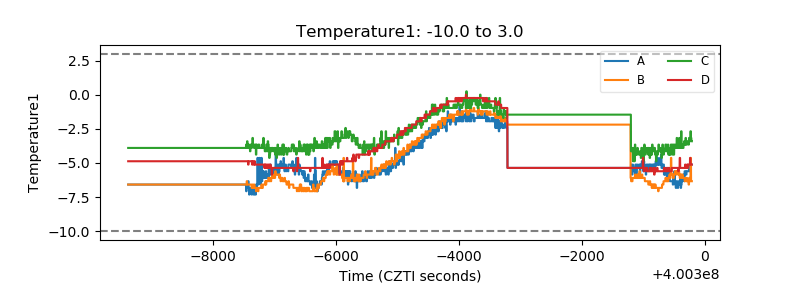 |
| Veto HV Monitor | 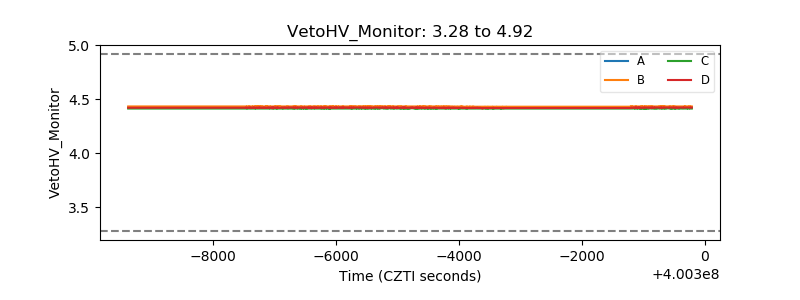 |
| Veto LLD | 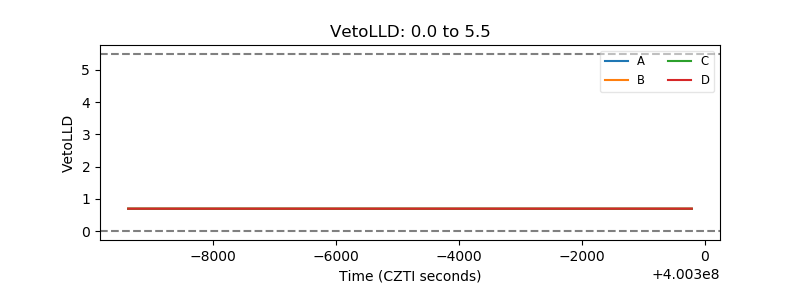 |
| Alpha Counter | 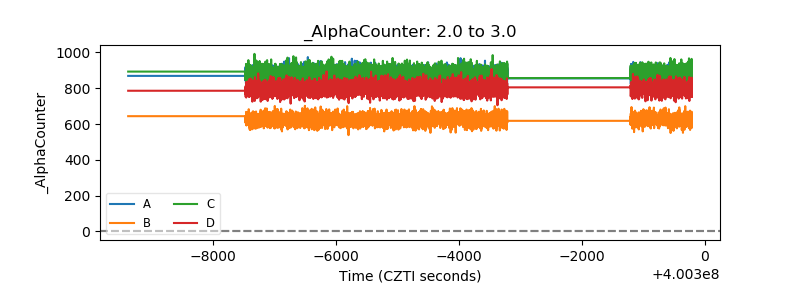 |
| _CPM_Rate | 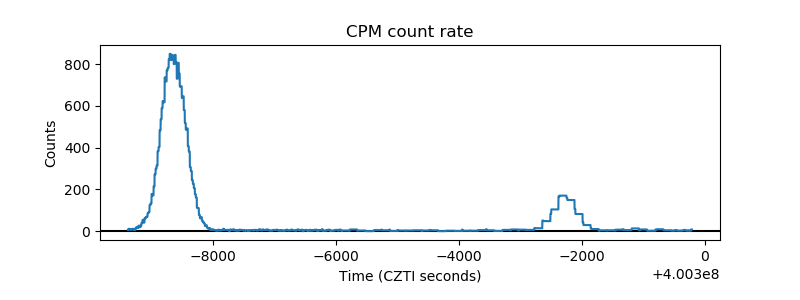 |
| CZT Counter | 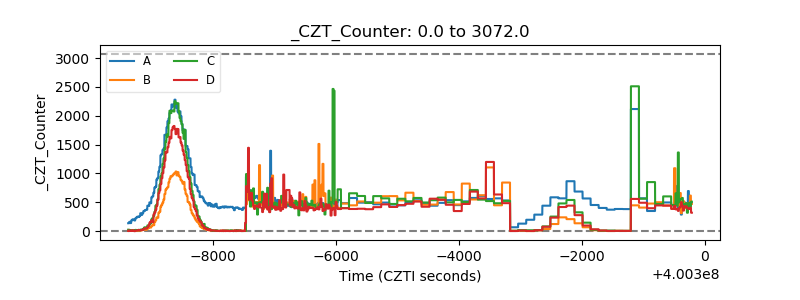 |
| +2.5 Volts monitor |  |
| +5 Volts monitor | 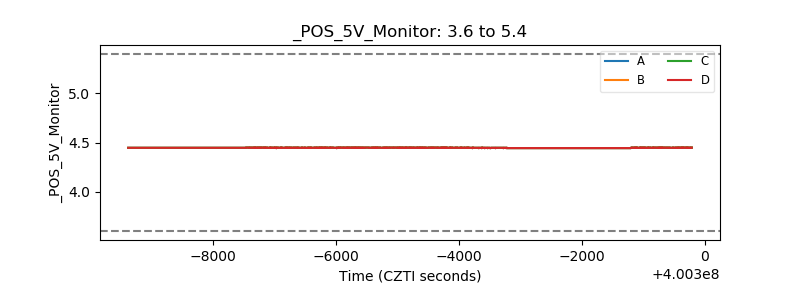 |
| _ROLL_ROT | 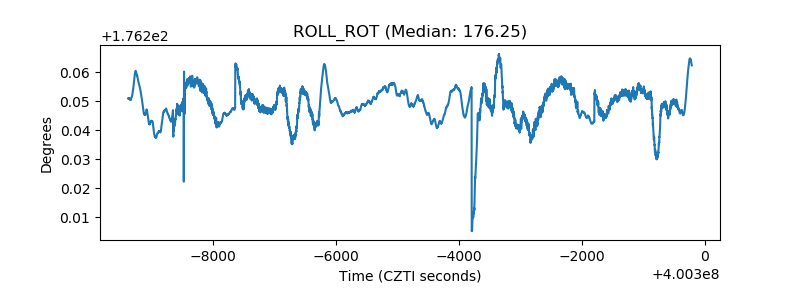 |
| _Roll_DEC | 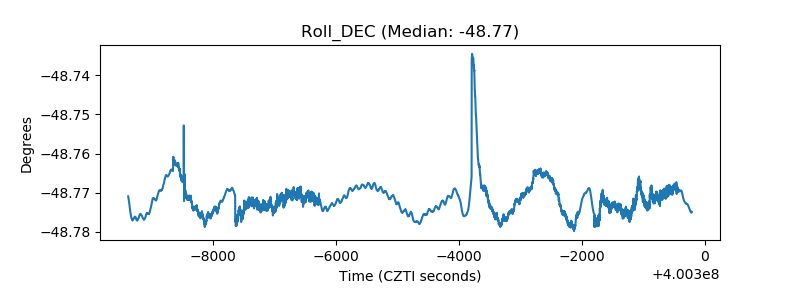 |
| _Roll_RA | 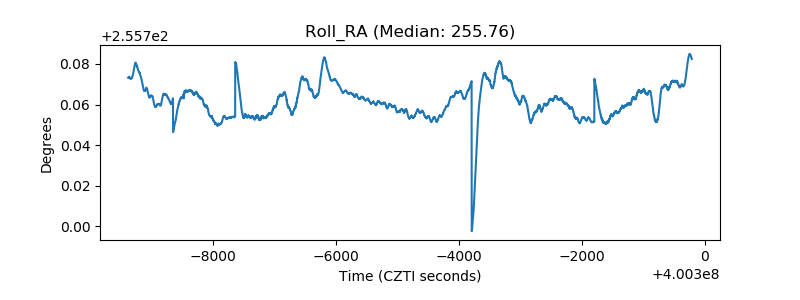 |
| Veto Counter | 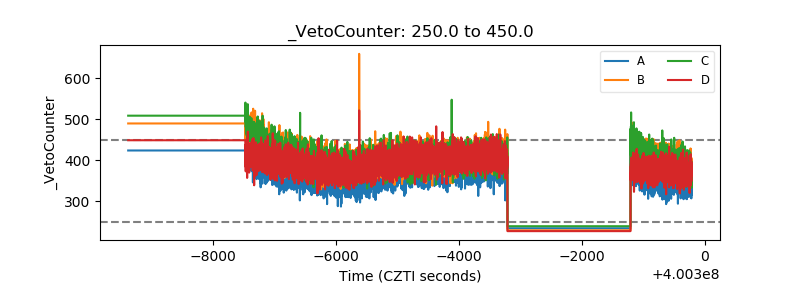 |