| Param | Original file | Final file |
|---|---|---|
| Filename | modeM0/AS1T05_051T01_9000005334_37553cztM0_level2.evt | modeM0/AS1T05_051T01_9000005334_37553cztM0_level2_quad_clean.evt |
| Size (bytes) | 422,674,560 | 60,693,120 |
| Size | 403.1 MB | 57.9 MB |
| Events in quadrant A | 2,774,562 | 368,782 |
| Events in quadrant B | 2,973,977 | 372,946 |
| Events in quadrant C | 3,443,476 | 360,789 |
| Events in quadrant D | 3,234,662 | 349,776 |
| Mode M9 | |||
|---|---|---|---|
| Quadrant | BADHDUFLAG | Total packets | Discarded packets |
| A | 0 | 35 | 0 |
| B | 0 | 35 | 0 |
| C | 0 | 35 | 0 |
| D | 0 | 36 | 0 |
| Mode M0 | |||
|---|---|---|---|
| Quadrant | BADHDUFLAG | Total packets | Discarded packets |
| A | 0 | 11521 | 3 |
| B | 0 | 12341 | 2 |
| C | 0 | 13555 | 2 |
| D | 0 | 13434 | 2 |
| Mode SS | |||
|---|---|---|---|
| Quadrant | BADHDUFLAG | Total packets | Discarded packets |
| A | 0 | 112 | 0 |
| B | 0 | 112 | 0 |
| C | 0 | 112 | 0 |
| D | 0 | 112 | 0 |
| Quadrant | Total seconds | Saturated seconds | Saturation percentage |
|---|---|---|---|
| A | 5504 | 15 | 0.272529% |
| B | 5504 | 86 | 1.562500% |
| C | 5504 | 225 | 4.087936% |
| D | 5504 | 177 | 3.215843% |
Noise dominated data is calculated using 1-second bins in cleaned event files. If a bin has >2000 counts, and if more than 50% of those come from <1% of pixels, then it is considered to be noise-dominated and hence unusable.
| Quadrant | # 1 sec bins | Bins with >0 counts | Bins with >2000 counts | High rate bins dominated by noise | Noise dominated (total time) | Noise dominated (detector-on time) | Marked lightcurve |
|---|---|---|---|---|---|---|---|
| A | 7177 | 5505 | 10 | 10 | 0.14% | 0.18% | 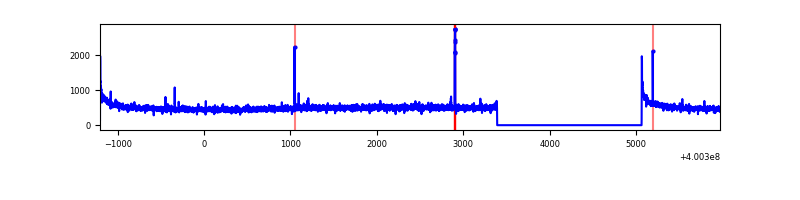 |
| B | 7177 | 5505 | 68 | 68 | 0.95% | 1.24% | 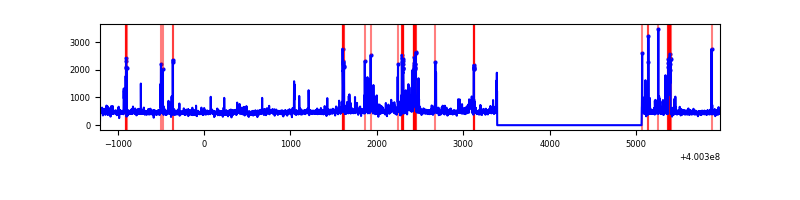 |
| C | 7177 | 5505 | 200 | 200 | 2.79% | 3.63% | 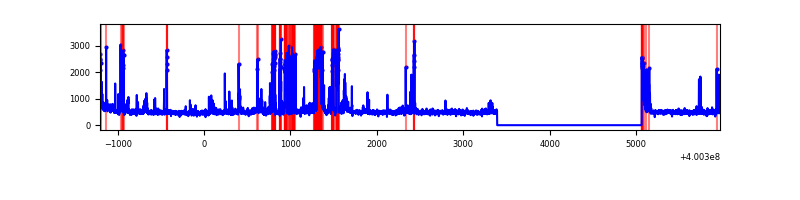 |
| D | 7177 | 5505 | 171 | 171 | 2.38% | 3.11% | 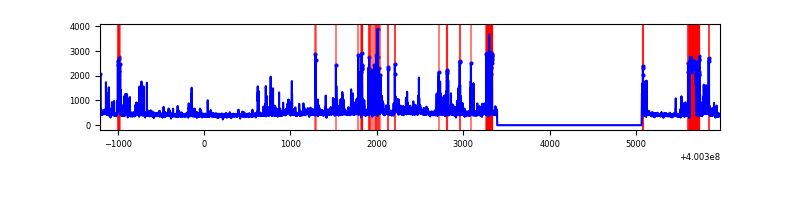 |
Top three noisy pixels from each quadrant. If the there are fewer than three noisy pixels in the level2.evt file, extra rows are filled as -1
| Pixel properties | Quadrant properties | ||||||
|---|---|---|---|---|---|---|---|
| Quadrant | DetID | PixID | Counts | Sigma | Mean | Median | Sigma |
| A | 10 | 83 | 308048 | 2436.76 | 623 | 609 | 126.2 |
| A | 15 | 222 | 19593 | 150.47 | 623 | 609 | 126.2 |
| A | 13 | 6 | 13564 | 102.68 | 623 | 609 | 126.2 |
| B | 0 | 221 | 119259 | 998.02 | 621 | 604 | 118.9 |
| B | 5 | 172 | 103545 | 865.85 | 621 | 604 | 118.9 |
| B | 3 | 112 | 98883 | 826.64 | 621 | 604 | 118.9 |
| C | 14 | 254 | 721380 | 5196.29 | 597 | 602 | 138.7 |
| C | 15 | 214 | 231711 | 1666.13 | 597 | 602 | 138.7 |
| C | 0 | 10 | 99775 | 714.97 | 597 | 602 | 138.7 |
| D | 2 | 249 | 433646 | 2957.54 | 598 | 580 | 146.4 |
| D | 7 | 55 | 117566 | 798.93 | 598 | 580 | 146.4 |
| D | 12 | 233 | 87310 | 592.3 | 598 | 580 | 146.4 |
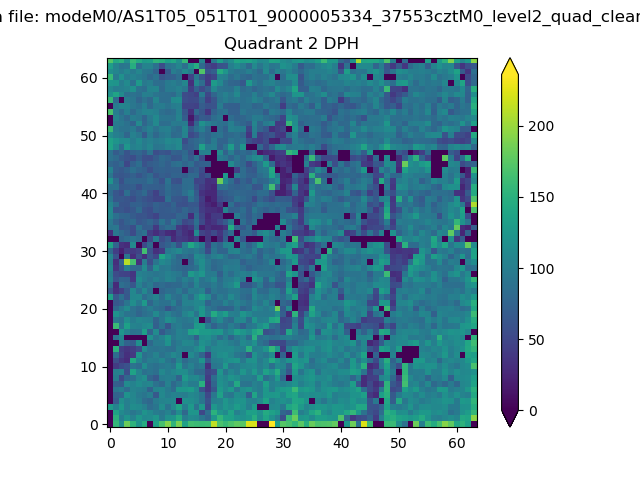
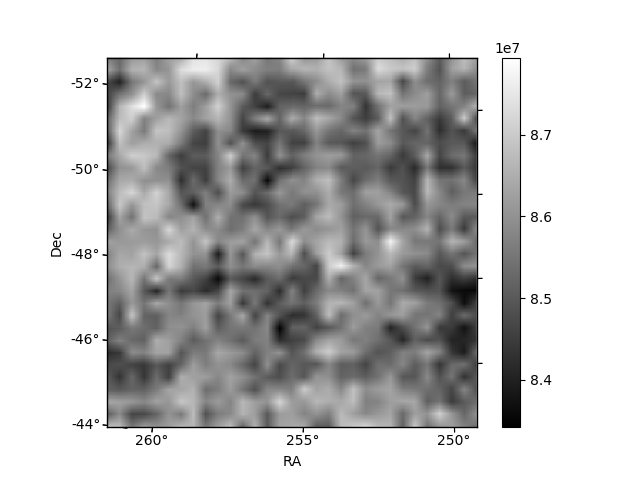
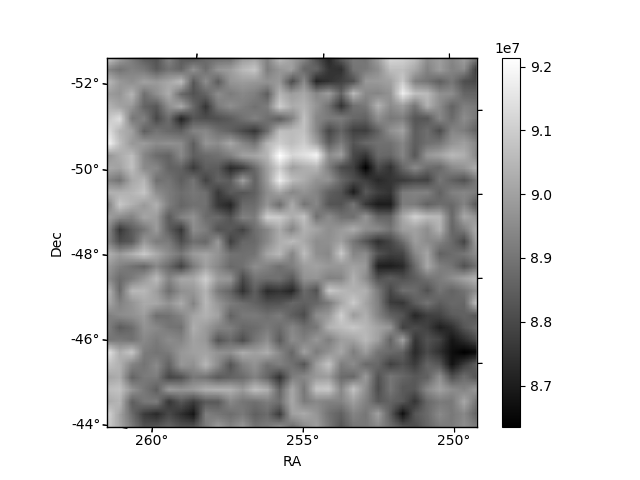
Histogram calculated using DETX and DETY for each event in the final _common_clean file
| Quadrant A | 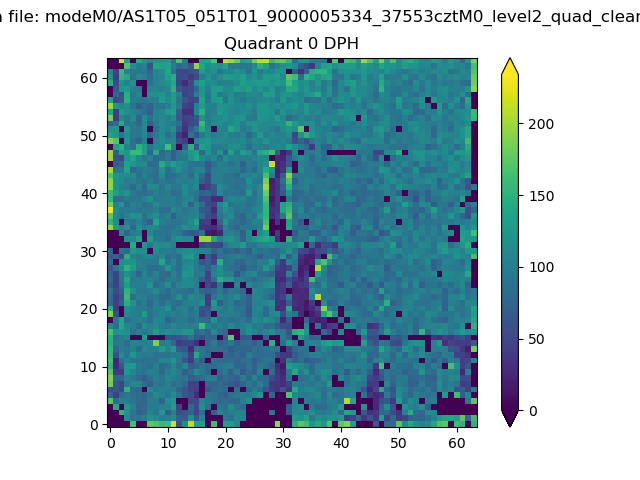 |
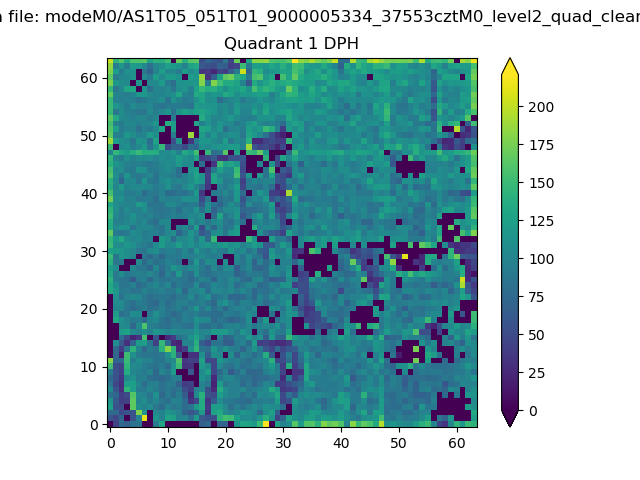 |
Quadrant B |
|---|---|---|---|
| Quadrant D | 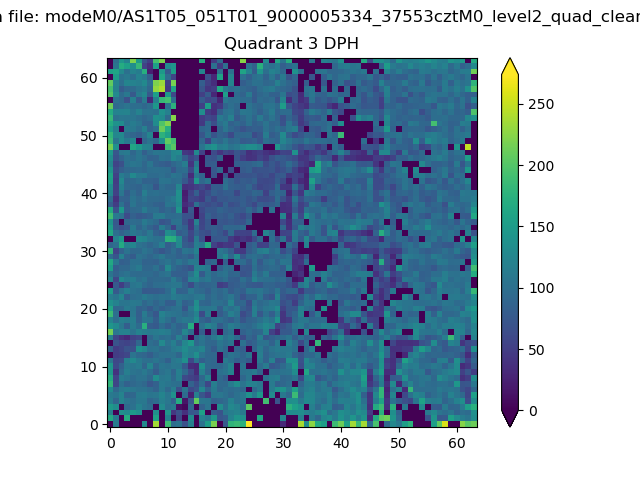 |
 |
Quadrant C |
| Plot type | Count rate plots | Images |
|---|---|---|
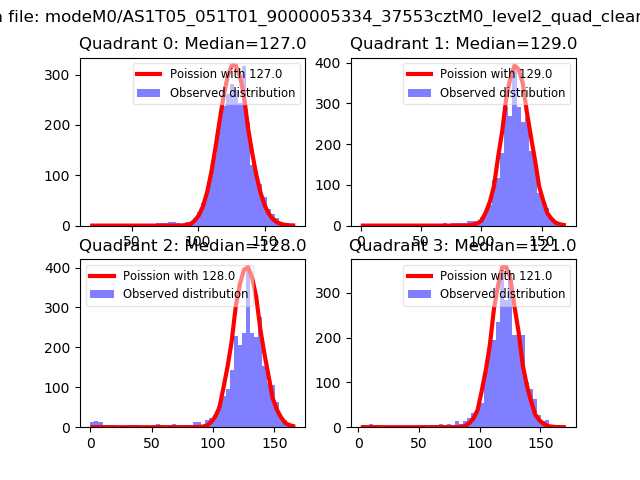
| Comparison with Poisson distribution Blue bars denote a histogram of data divided into 1 sec bins. Red curve is a Poisson curve with rate = median count rate of data. |
 |
 |
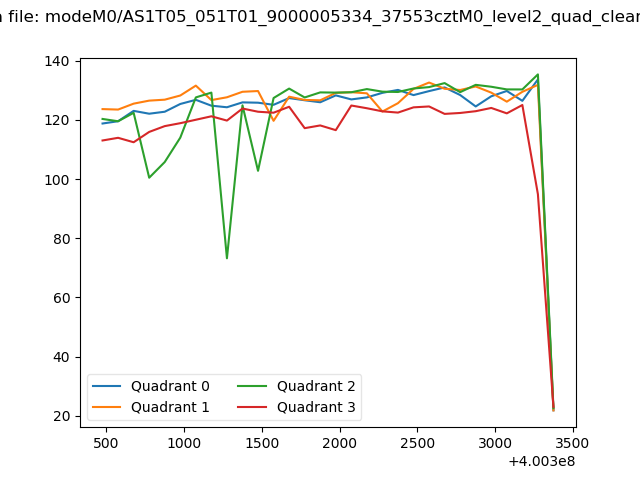
| Quadrant-wise count rates Data is divided into 100 sec bins |
 |
|
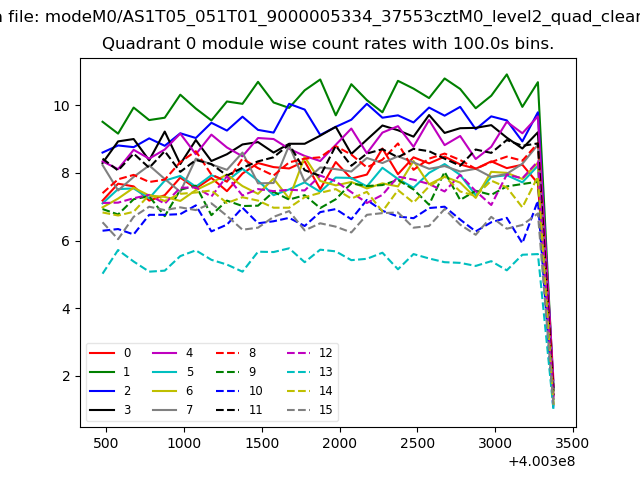
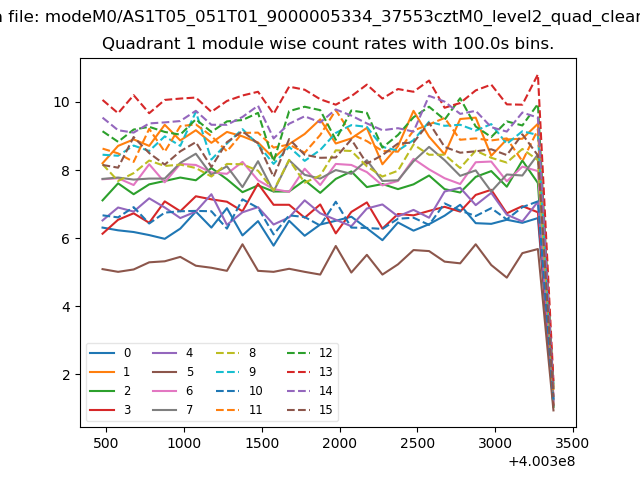
| Module-wise count rates for Quadrant A Data is divided into 100 sec bins |
 |
 |
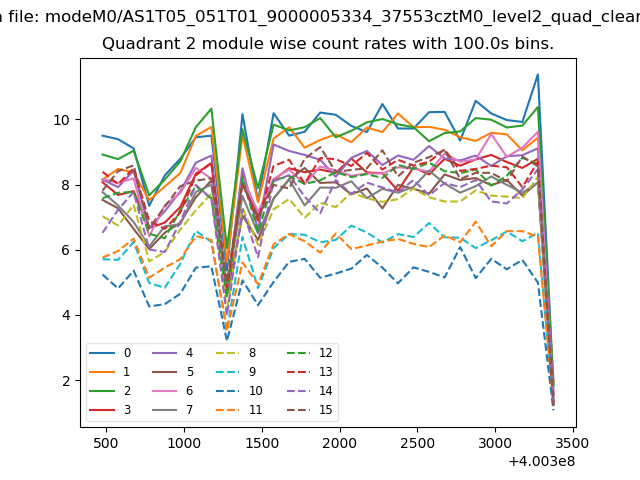
| Module-wise count rates for Quadrant B Data is divided into 100 sec bins |
 |
 |
| Module-wise count rates for Quadrant C Data is divided into 100 sec bins |
 |
 |
| Module-wise count rates for Quadrant D Data is divided into 100 sec bins |
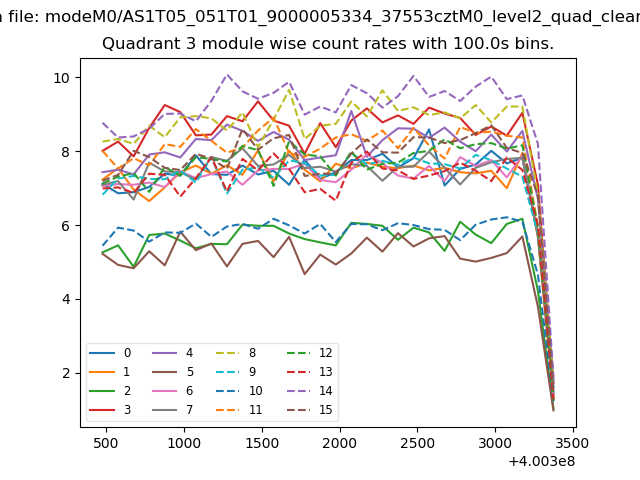 |
 |
| Parameter | Plot |
|---|---|
| CZT HV Monitor | 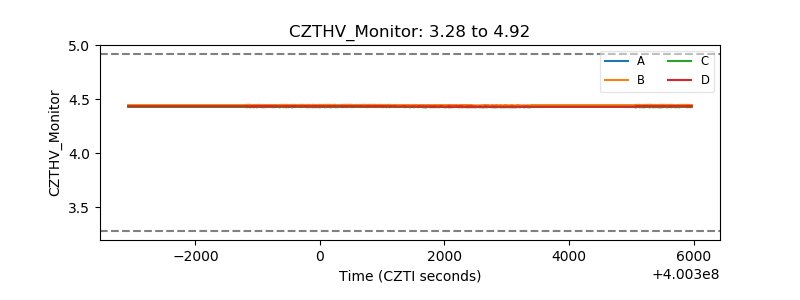 |
| D_VDD | 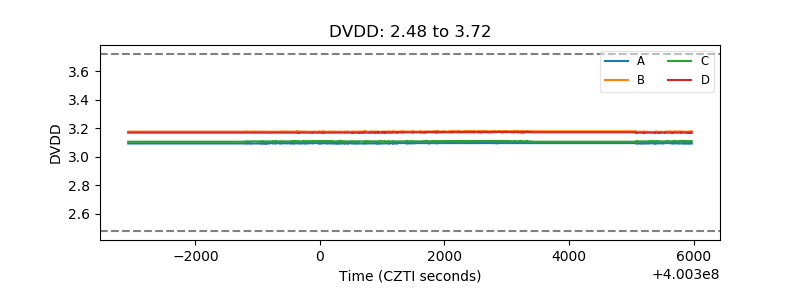 |
| Temperature 1 | 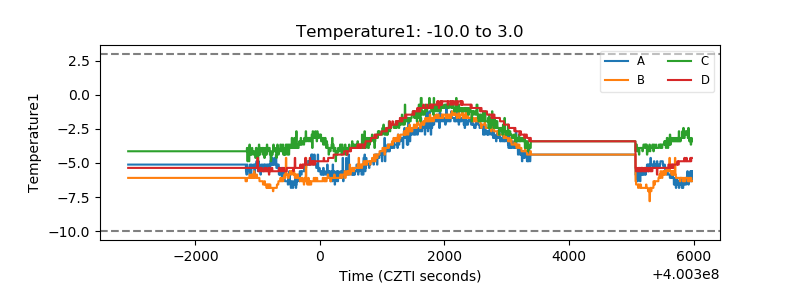 |
| Veto HV Monitor | 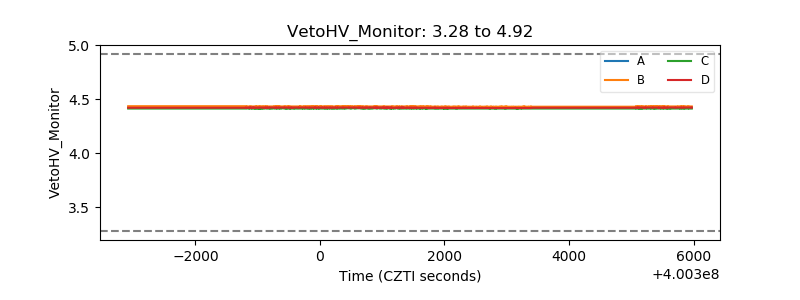 |
| Veto LLD | 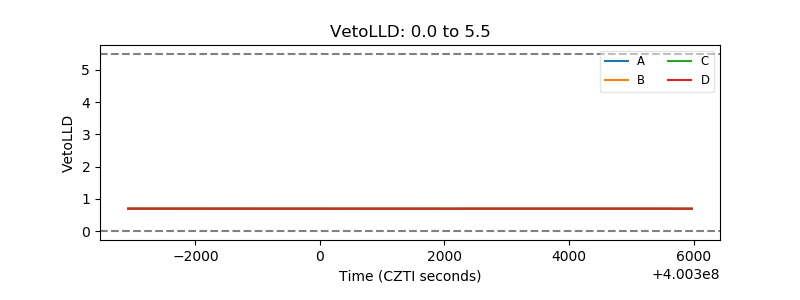 |
| Alpha Counter | 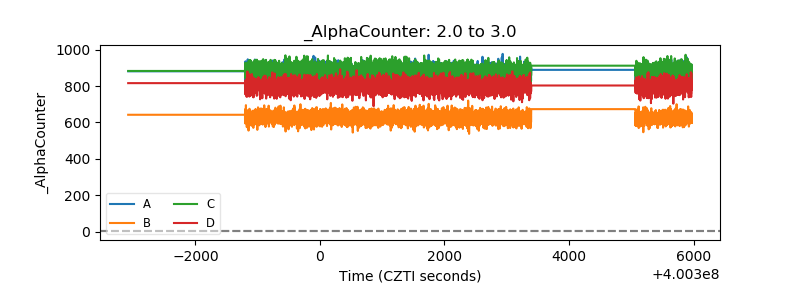 |
| _CPM_Rate | 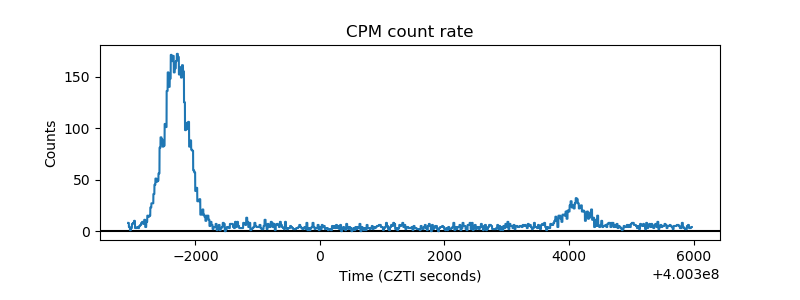 |
| CZT Counter | 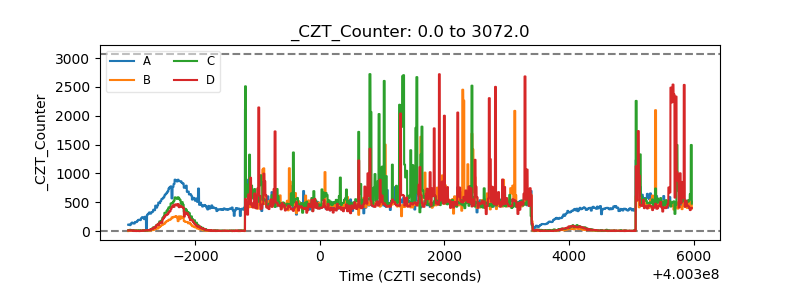 |
| +2.5 Volts monitor | 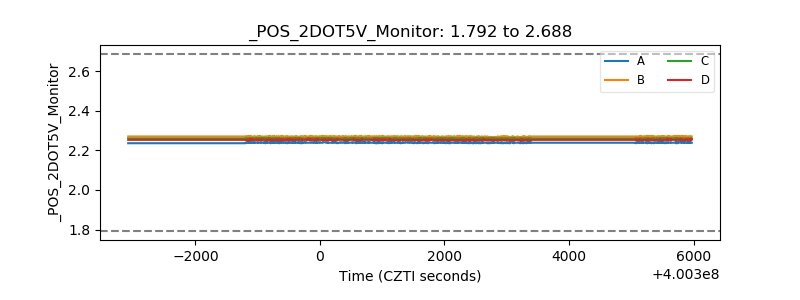 |
| +5 Volts monitor | 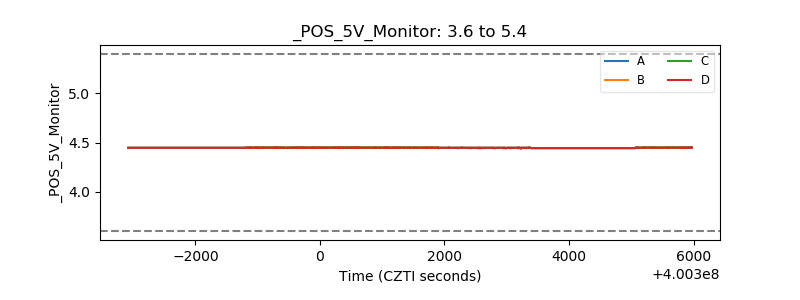 |
| _ROLL_ROT | 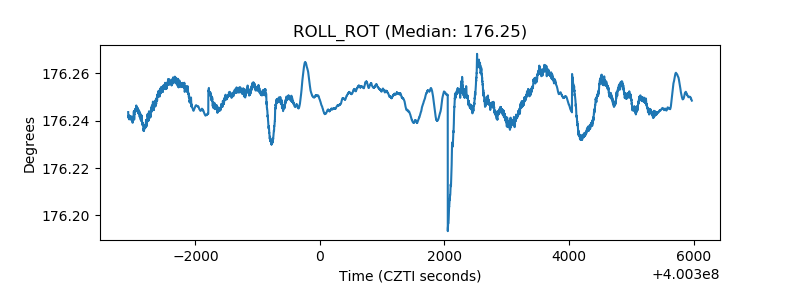 |
| _Roll_DEC | 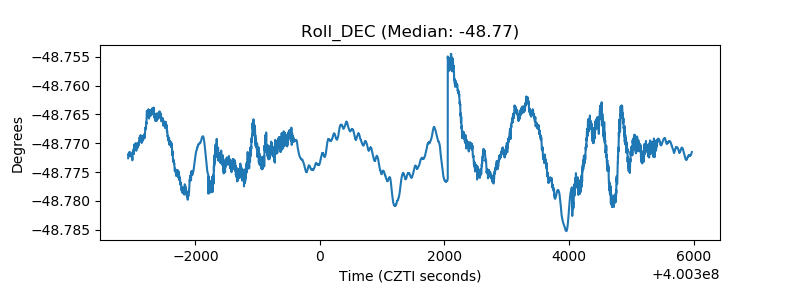 |
| _Roll_RA | 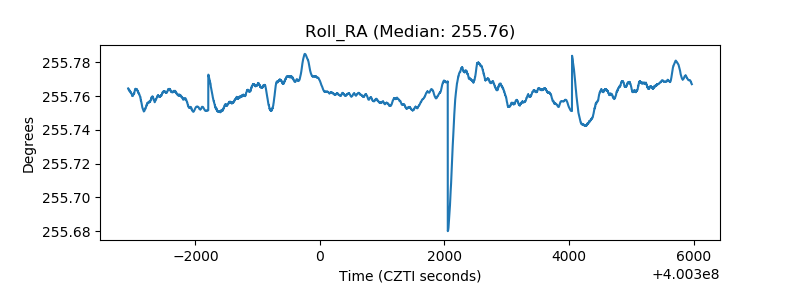 |
| Veto Counter | 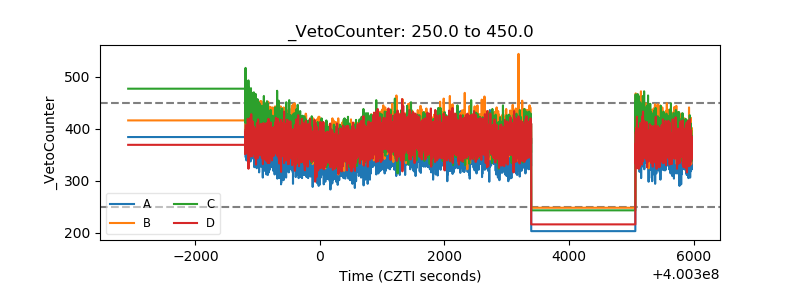 |