| Param | Original file | Final file |
|---|---|---|
| Filename | modeM0/AS1T05_051T01_9000005334_37554cztM0_level2.evt | modeM0/AS1T05_051T01_9000005334_37554cztM0_level2_quad_clean.evt |
| Size (bytes) | 430,436,160 | 73,494,720 |
| Size | 410.5 MB | 70.1 MB |
| Events in quadrant A | 3,016,899 | 455,932 |
| Events in quadrant B | 2,932,389 | 464,345 |
| Events in quadrant C | 2,979,601 | 466,282 |
| Events in quadrant D | 3,714,380 | 435,101 |
| Mode M9 | |||
|---|---|---|---|
| Quadrant | BADHDUFLAG | Total packets | Discarded packets |
| A | 0 | 24 | 0 |
| B | 0 | 24 | 0 |
| C | 0 | 24 | 0 |
| D | 0 | 25 | 0 |
| Mode M0 | |||
|---|---|---|---|
| Quadrant | BADHDUFLAG | Total packets | Discarded packets |
| A | 0 | 12367 | 3 |
| B | 0 | 12414 | 2 |
| C | 0 | 12282 | 2 |
| D | 0 | 15022 | 2 |
| Mode SS | |||
|---|---|---|---|
| Quadrant | BADHDUFLAG | Total packets | Discarded packets |
| A | 0 | 118 | 0 |
| B | 0 | 118 | 0 |
| C | 0 | 118 | 0 |
| D | 0 | 118 | 0 |
| Quadrant | Total seconds | Saturated seconds | Saturation percentage |
|---|---|---|---|
| A | 5773 | 45 | 0.779491% |
| B | 5773 | 57 | 0.987355% |
| C | 5773 | 53 | 0.918067% |
| D | 5773 | 274 | 4.746232% |
Noise dominated data is calculated using 1-second bins in cleaned event files. If a bin has >2000 counts, and if more than 50% of those come from <1% of pixels, then it is considered to be noise-dominated and hence unusable.
| Quadrant | # 1 sec bins | Bins with >0 counts | Bins with >2000 counts | High rate bins dominated by noise | Noise dominated (total time) | Noise dominated (detector-on time) | Marked lightcurve |
|---|---|---|---|---|---|---|---|
| A | 7176 | 5774 | 36 | 36 | 0.50% | 0.62% | 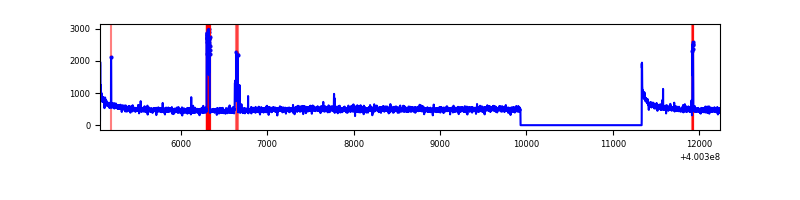 |
| B | 7176 | 5774 | 45 | 45 | 0.63% | 0.78% | 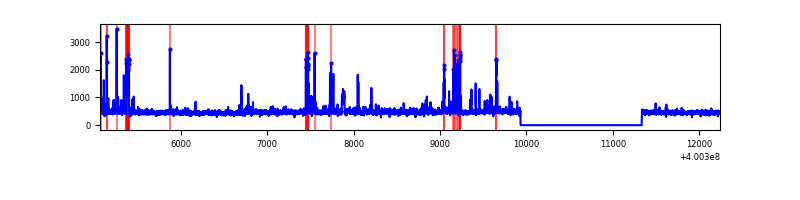 |
| C | 7176 | 5774 | 36 | 36 | 0.50% | 0.62% | 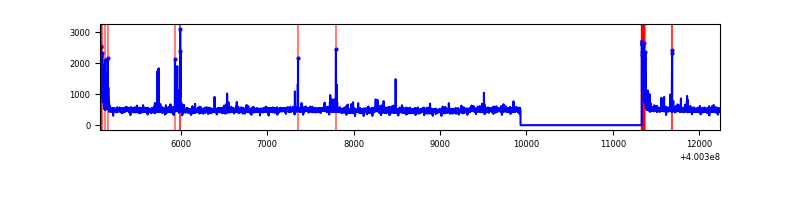 |
| D | 7176 | 5774 | 267 | 267 | 3.72% | 4.62% | 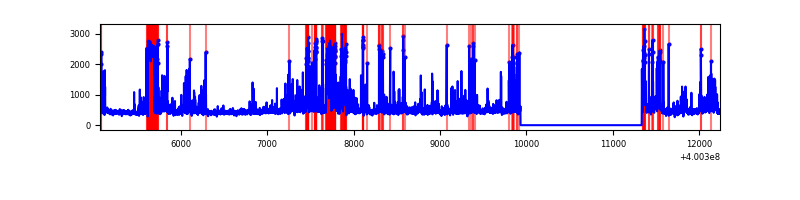 |
Top three noisy pixels from each quadrant. If the there are fewer than three noisy pixels in the level2.evt file, extra rows are filled as -1
| Pixel properties | Quadrant properties | ||||||
|---|---|---|---|---|---|---|---|
| Quadrant | DetID | PixID | Counts | Sigma | Mean | Median | Sigma |
| A | 10 | 83 | 324579 | 2455.84 | 652 | 638 | 131.9 |
| A | 15 | 222 | 131082 | 988.91 | 652 | 638 | 131.9 |
| A | 13 | 6 | 31851 | 236.63 | 652 | 638 | 131.9 |
| B | 0 | 221 | 83829 | 658.8 | 651 | 635 | 126.3 |
| B | 15 | 85 | 63472 | 497.6 | 651 | 635 | 126.3 |
| B | 5 | 172 | 46869 | 366.12 | 651 | 635 | 126.3 |
| C | 15 | 214 | 249671 | 1674.61 | 636 | 639 | 148.7 |
| C | 0 | 10 | 134782 | 902.04 | 636 | 639 | 148.7 |
| C | 14 | 254 | 57726 | 383.88 | 636 | 639 | 148.7 |
| D | 2 | 249 | 563836 | 3673.2 | 623 | 605 | 153.3 |
| D | 13 | 249 | 242872 | 1579.98 | 623 | 605 | 153.3 |
| D | 12 | 233 | 234510 | 1525.44 | 623 | 605 | 153.3 |
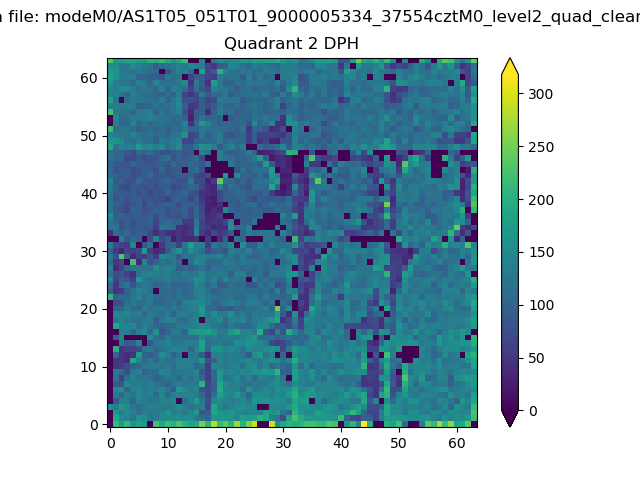
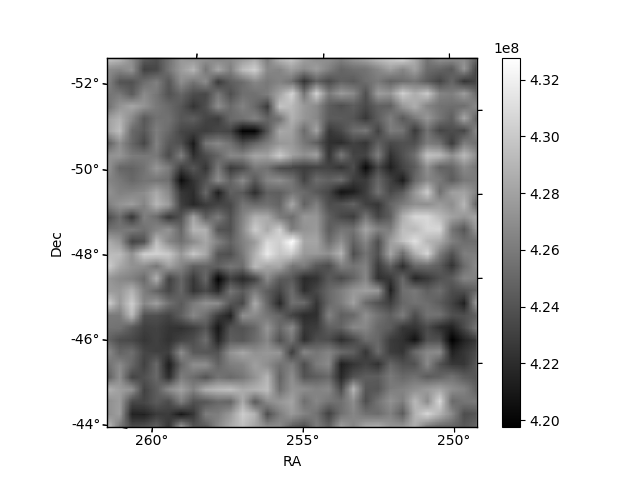
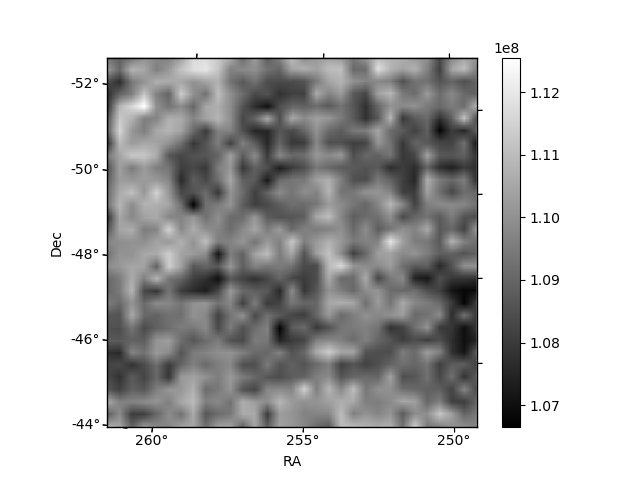
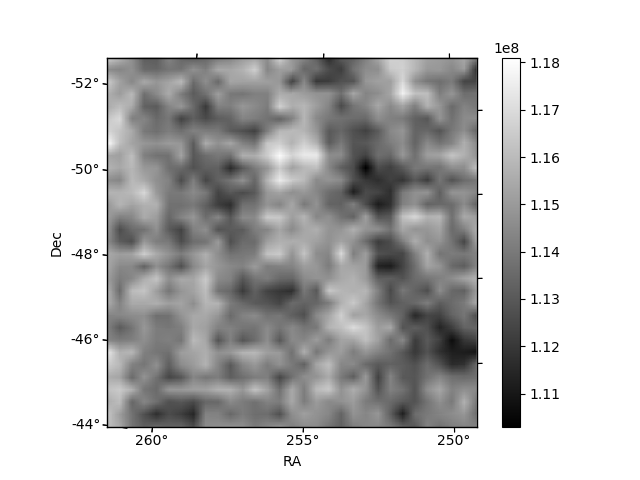
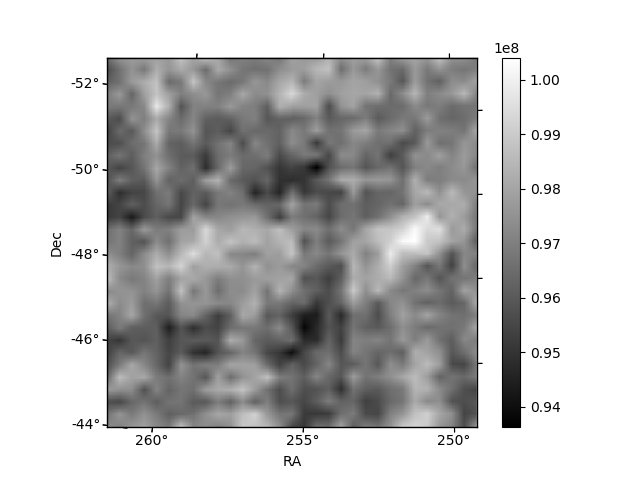
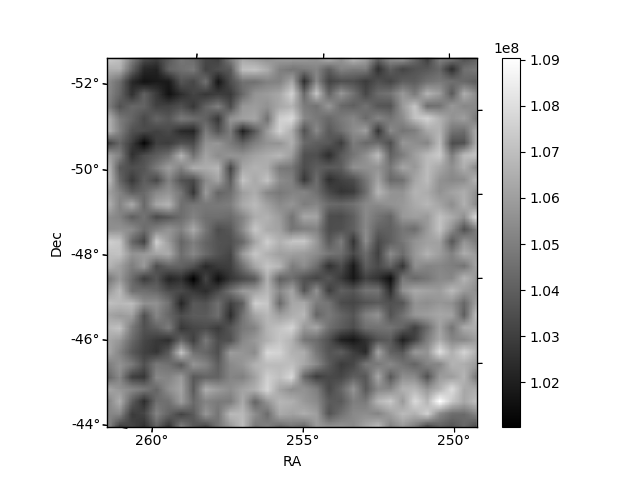
Histogram calculated using DETX and DETY for each event in the final _common_clean file
| Quadrant A | 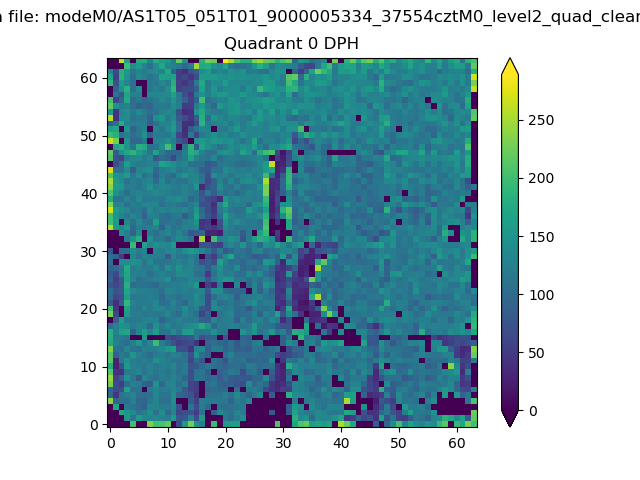 |
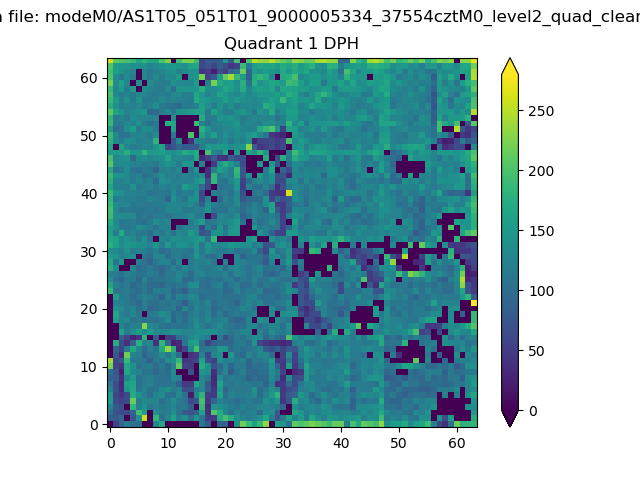 |
Quadrant B |
|---|---|---|---|
| Quadrant D | 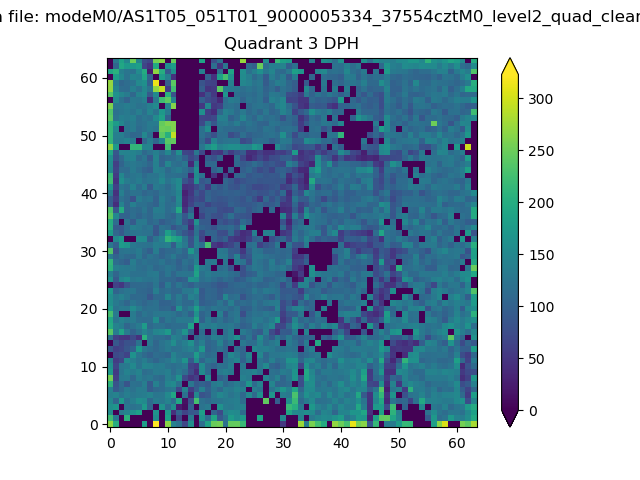 |
 |
Quadrant C |
| Plot type | Count rate plots | Images |
|---|---|---|
| Comparison with Poisson distribution Blue bars denote a histogram of data divided into 1 sec bins. Red curve is a Poisson curve with rate = median count rate of data. |
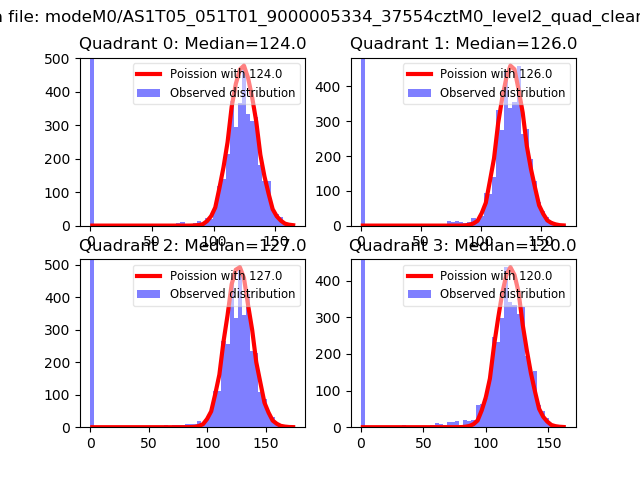 |
 |
| Quadrant-wise count rates Data is divided into 100 sec bins |
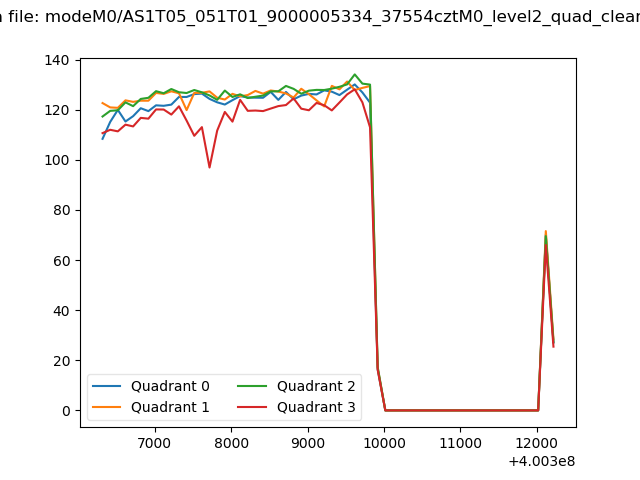 |
|
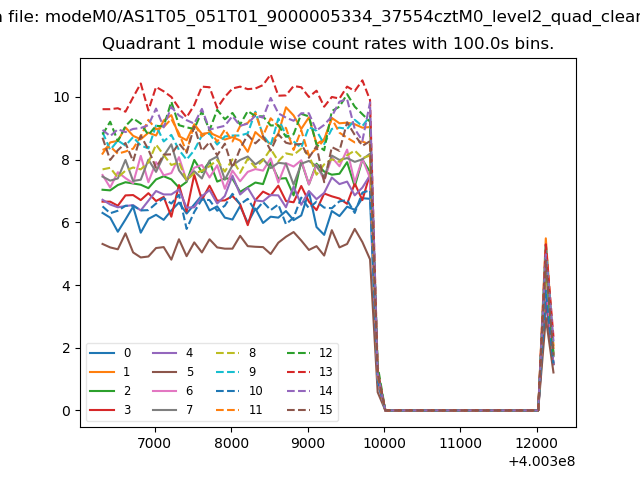
| Module-wise count rates for Quadrant A Data is divided into 100 sec bins |
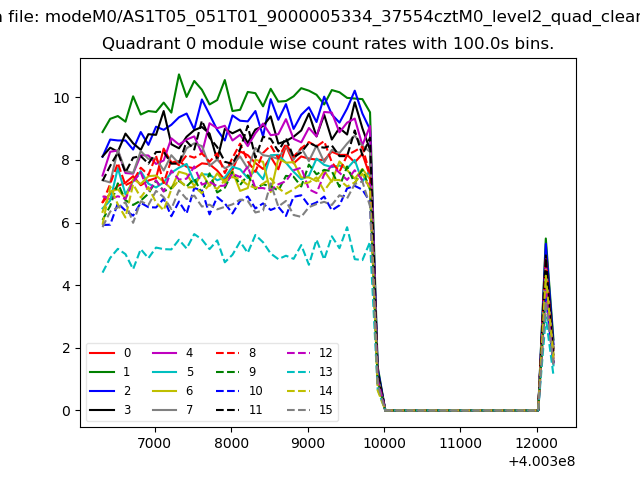 |
 |
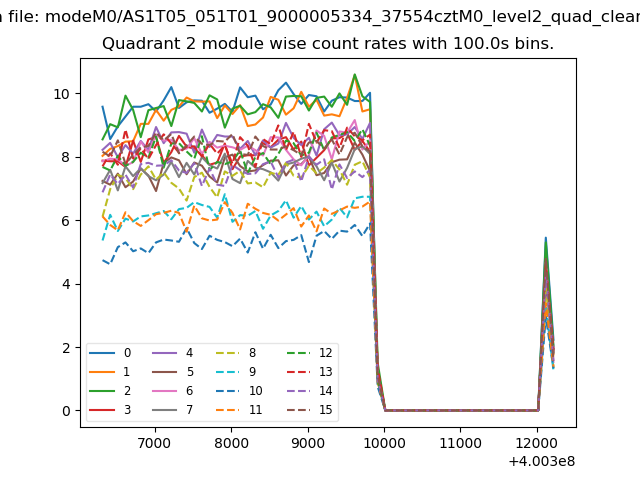
| Module-wise count rates for Quadrant B Data is divided into 100 sec bins |
 |
 |
| Module-wise count rates for Quadrant C Data is divided into 100 sec bins |
 |
 |
| Module-wise count rates for Quadrant D Data is divided into 100 sec bins |
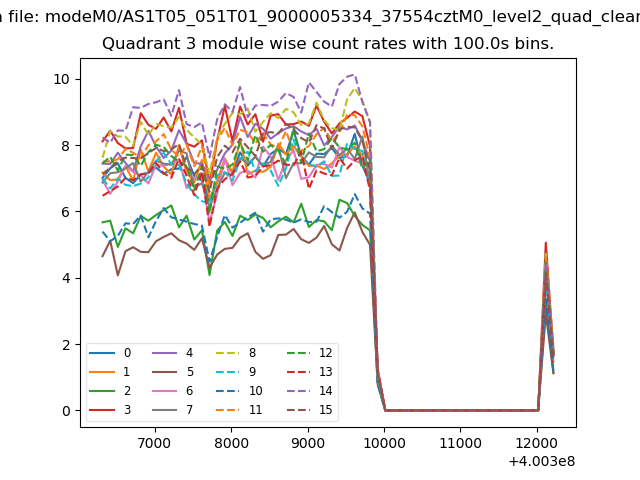 |
 |
| Parameter | Plot |
|---|---|
| CZT HV Monitor | 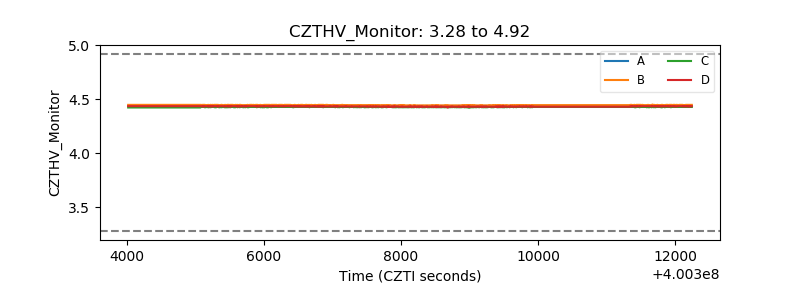 |
| D_VDD | 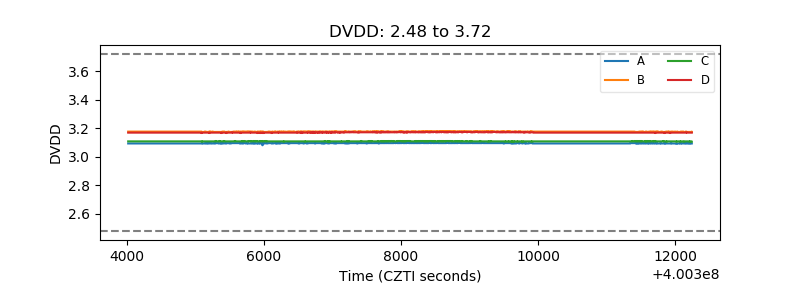 |
| Temperature 1 | 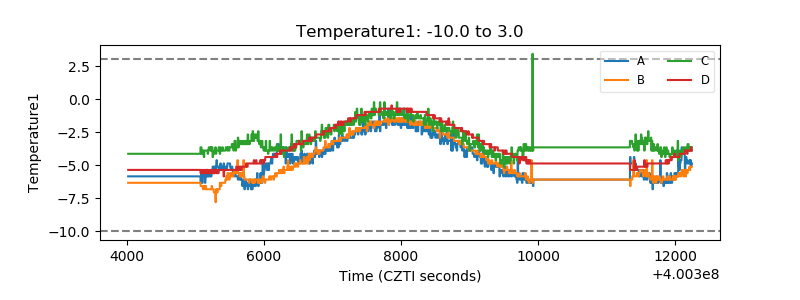 |
| Veto HV Monitor | 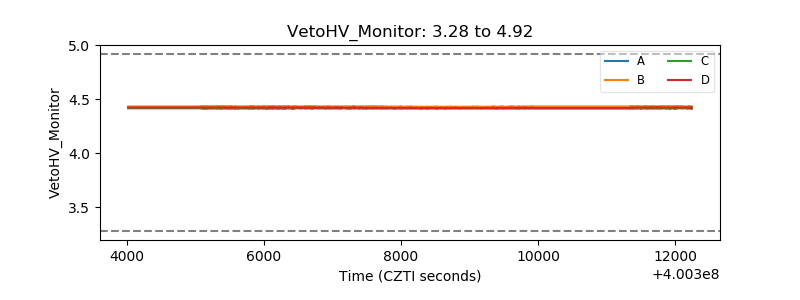 |
| Veto LLD | 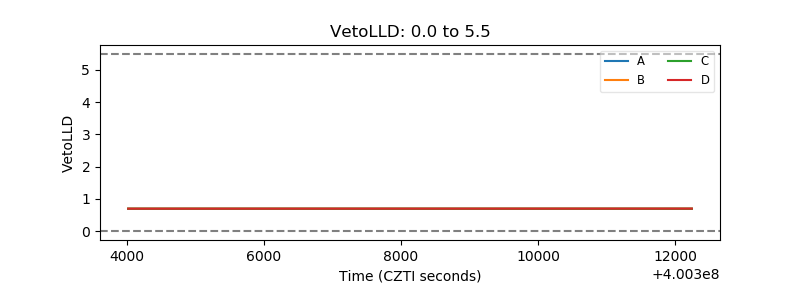 |
| Alpha Counter | 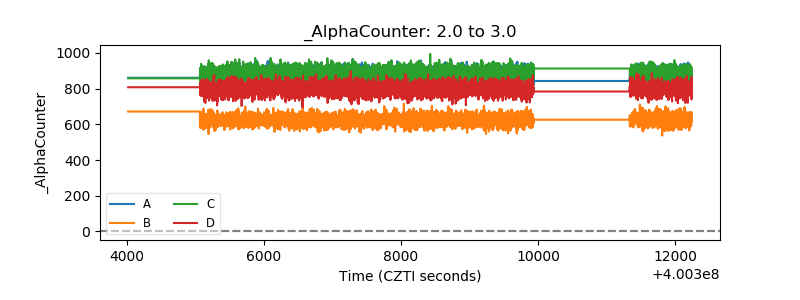 |
| _CPM_Rate | 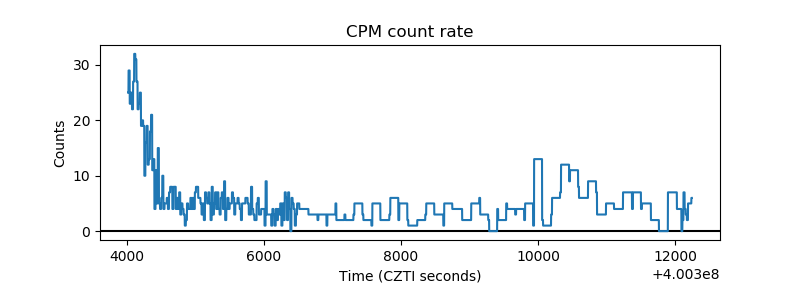 |
| CZT Counter | 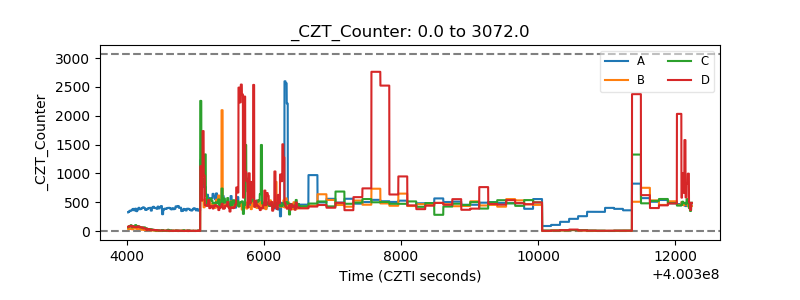 |
| +2.5 Volts monitor | 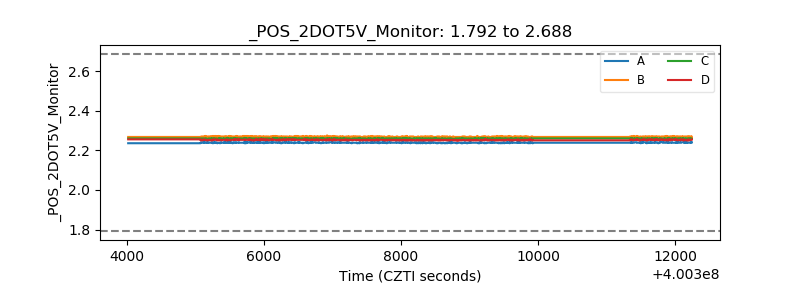 |
| +5 Volts monitor | 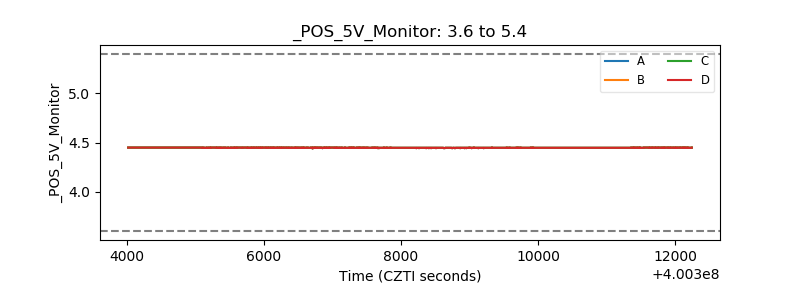 |
| _ROLL_ROT | 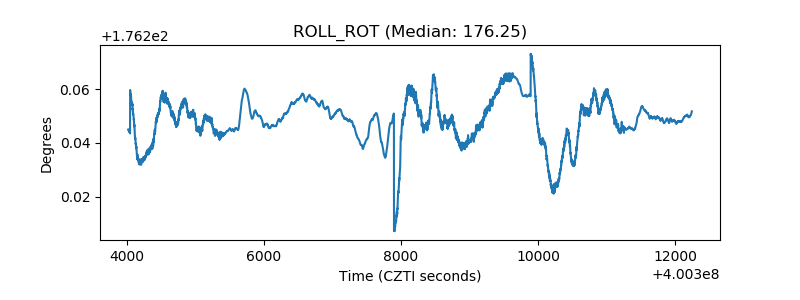 |
| _Roll_DEC | 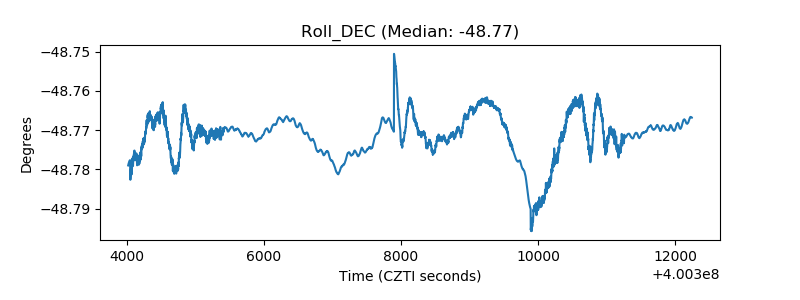 |
| _Roll_RA | 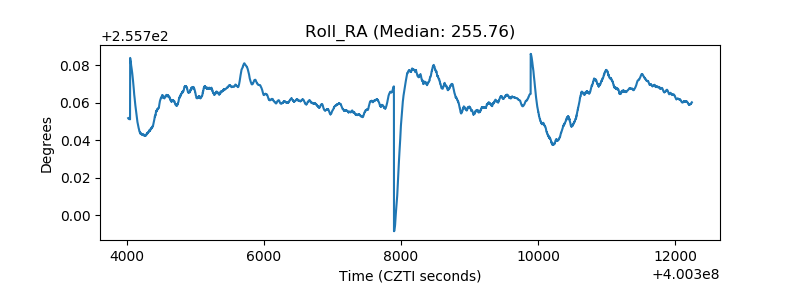 |
| Veto Counter | 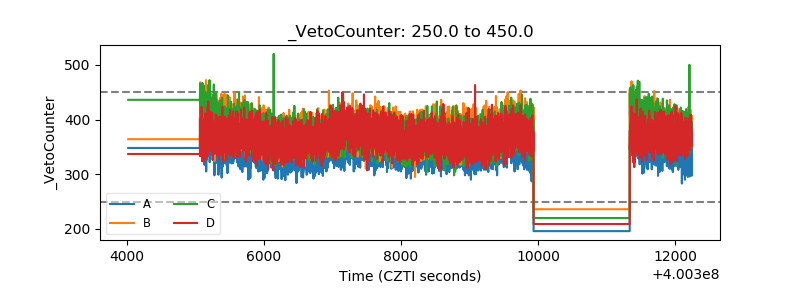 |