| Param | Original file | Final file |
|---|---|---|
| Filename | modeM0/AS1T05_051T01_9000005334_37555cztM0_level2.evt | modeM0/AS1T05_051T01_9000005334_37555cztM0_level2_quad_clean.evt |
| Size (bytes) | 427,141,440 | 85,276,800 |
| Size | 407.4 MB | 81.3 MB |
| Events in quadrant A | 3,130,674 | 543,841 |
| Events in quadrant B | 2,943,613 | 550,228 |
| Events in quadrant C | 3,132,181 | 550,755 |
| Events in quadrant D | 3,324,588 | 521,377 |
| Mode M9 | |||
|---|---|---|---|
| Quadrant | BADHDUFLAG | Total packets | Discarded packets |
| A | 0 | 21 | 0 |
| B | 0 | 21 | 0 |
| C | 0 | 21 | 0 |
| D | 0 | 22 | 0 |
| Mode M0 | |||
|---|---|---|---|
| Quadrant | BADHDUFLAG | Total packets | Discarded packets |
| A | 0 | 12861 | 3 |
| B | 0 | 12537 | 2 |
| C | 0 | 12829 | 2 |
| D | 0 | 13949 | 2 |
| Mode SS | |||
|---|---|---|---|
| Quadrant | BADHDUFLAG | Total packets | Discarded packets |
| A | 0 | 120 | 0 |
| B | 0 | 120 | 0 |
| C | 0 | 120 | 0 |
| D | 0 | 120 | 0 |
| Quadrant | Total seconds | Saturated seconds | Saturation percentage |
|---|---|---|---|
| A | 5962 | 36 | 0.603824% |
| B | 5962 | 43 | 0.721234% |
| C | 5962 | 42 | 0.704462% |
| D | 5962 | 101 | 1.694062% |
Noise dominated data is calculated using 1-second bins in cleaned event files. If a bin has >2000 counts, and if more than 50% of those come from <1% of pixels, then it is considered to be noise-dominated and hence unusable.
| Quadrant | # 1 sec bins | Bins with >0 counts | Bins with >2000 counts | High rate bins dominated by noise | Noise dominated (total time) | Noise dominated (detector-on time) | Marked lightcurve |
|---|---|---|---|---|---|---|---|
| A | 7275 | 5963 | 20 | 20 | 0.27% | 0.34% |  |
| B | 7275 | 5963 | 36 | 36 | 0.49% | 0.60% |  |
| C | 7275 | 5963 | 38 | 38 | 0.52% | 0.64% | 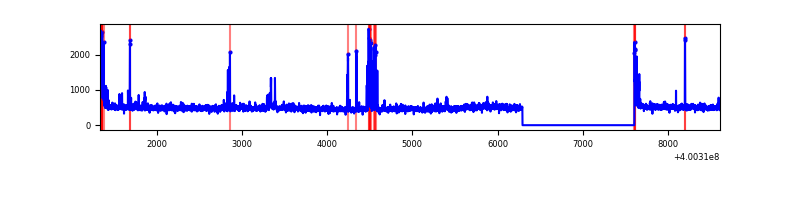 |
| D | 7275 | 5963 | 112 | 112 | 1.54% | 1.88% | 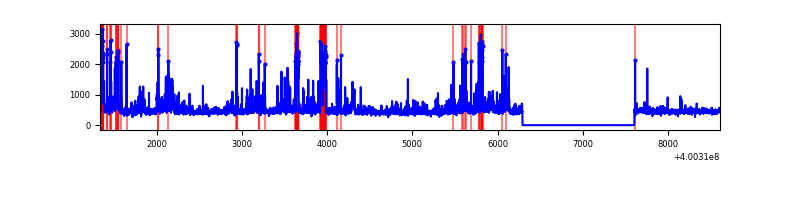 |
Top three noisy pixels from each quadrant. If the there are fewer than three noisy pixels in the level2.evt file, extra rows are filled as -1
| Pixel properties | Quadrant properties | ||||||
|---|---|---|---|---|---|---|---|
| Quadrant | DetID | PixID | Counts | Sigma | Mean | Median | Sigma |
| A | 10 | 83 | 325911 | 2380.43 | 679 | 666 | 136.6 |
| A | 5 | 168 | 93984 | 682.98 | 679 | 666 | 136.6 |
| A | 15 | 222 | 52391 | 378.57 | 679 | 666 | 136.6 |
| B | 5 | 172 | 68985 | 530.66 | 672 | 655 | 128.8 |
| B | 5 | 255 | 50497 | 387.08 | 672 | 655 | 128.8 |
| B | 5 | 200 | 46693 | 357.54 | 672 | 655 | 128.8 |
| C | 15 | 214 | 261535 | 1684.84 | 662 | 666 | 154.8 |
| C | 15 | 208 | 136782 | 879.12 | 662 | 666 | 154.8 |
| C | 0 | 10 | 88305 | 566.02 | 662 | 666 | 154.8 |
| D | 2 | 249 | 316302 | 1973.67 | 657 | 640 | 159.9 |
| D | 13 | 249 | 121549 | 755.98 | 657 | 640 | 159.9 |
| D | 2 | 153 | 115186 | 716.2 | 657 | 640 | 159.9 |
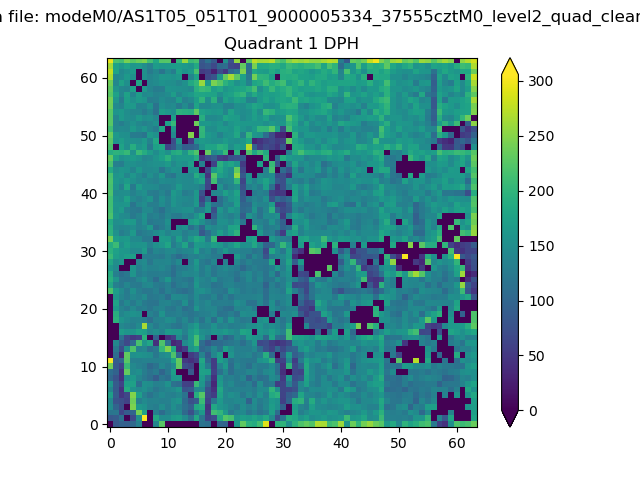
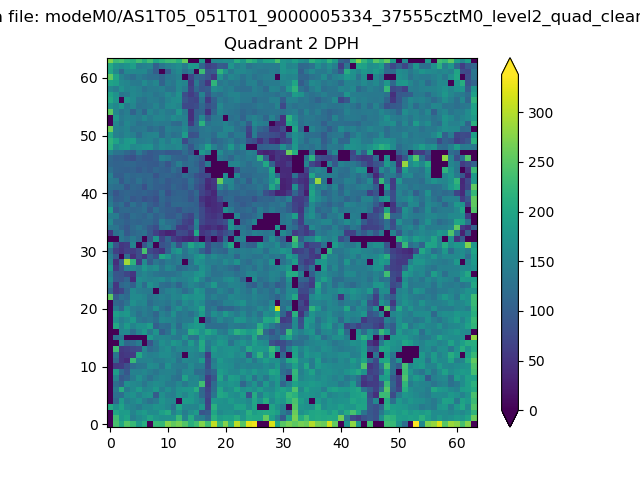
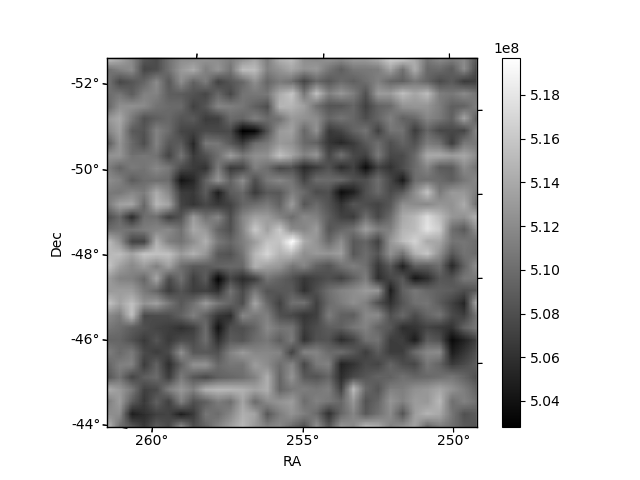
Histogram calculated using DETX and DETY for each event in the final _common_clean file
| Quadrant A |  |
 |
Quadrant B |
|---|---|---|---|
| Quadrant D |  |
 |
Quadrant C |
| Plot type | Count rate plots | Images |
|---|---|---|
| Comparison with Poisson distribution Blue bars denote a histogram of data divided into 1 sec bins. Red curve is a Poisson curve with rate = median count rate of data. |
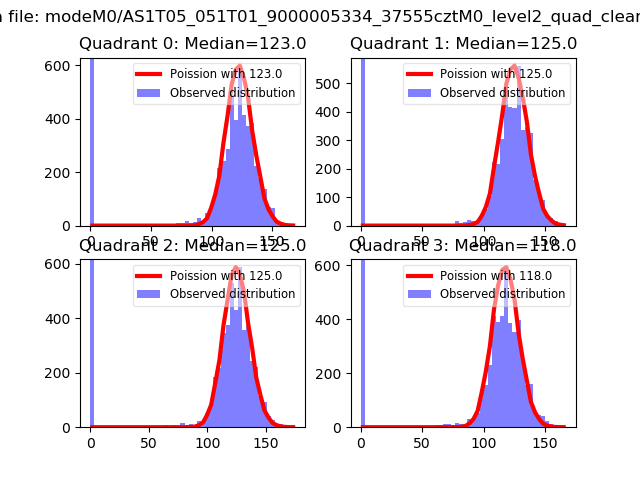 |
 |
| Quadrant-wise count rates Data is divided into 100 sec bins |
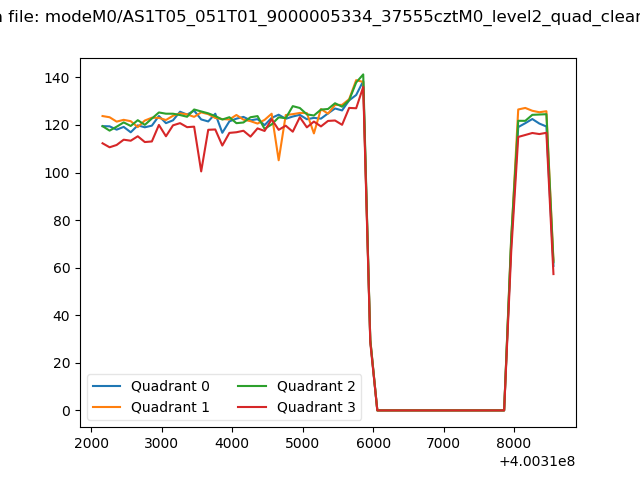 |
|
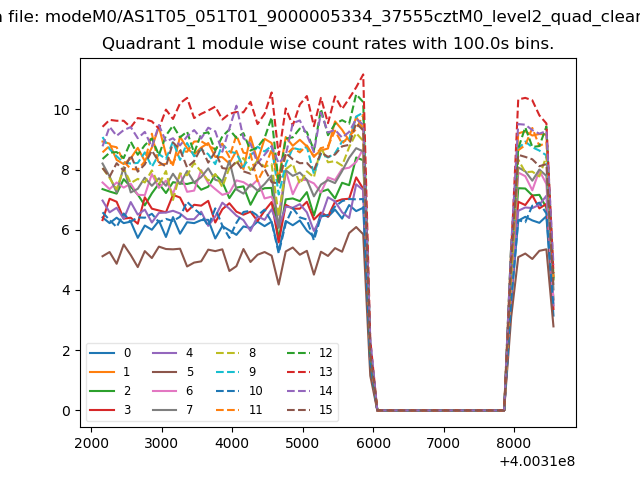
| Module-wise count rates for Quadrant A Data is divided into 100 sec bins |
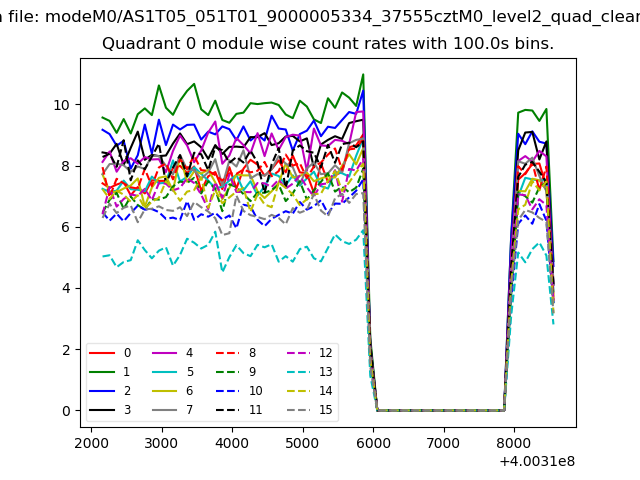 |
 |
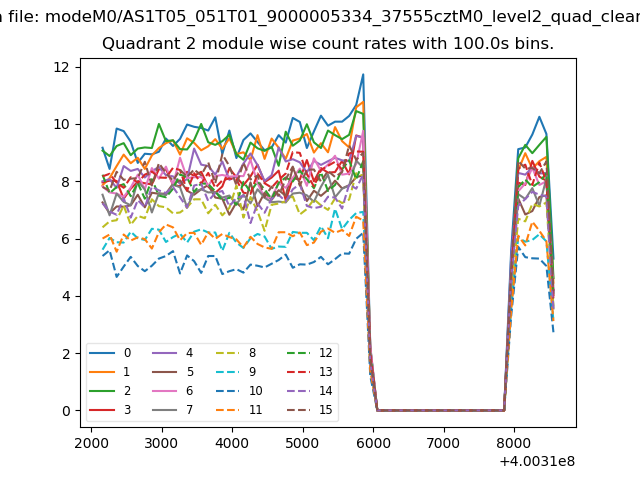
| Module-wise count rates for Quadrant B Data is divided into 100 sec bins |
 |
 |
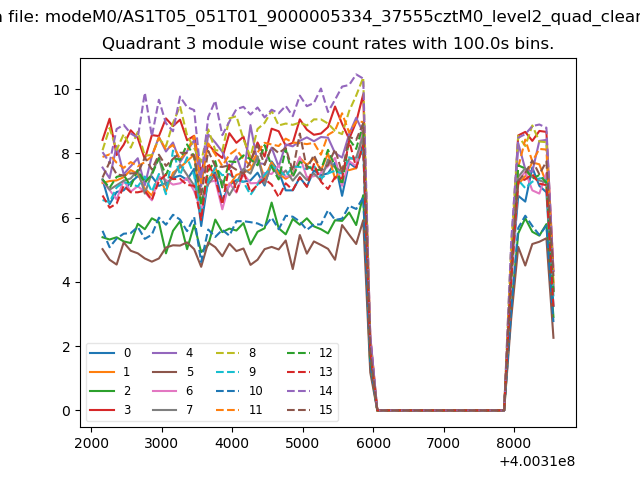
| Module-wise count rates for Quadrant C Data is divided into 100 sec bins |
 |
 |
| Module-wise count rates for Quadrant D Data is divided into 100 sec bins |
 |
 |
| Parameter | Plot |
|---|---|
| CZT HV Monitor | 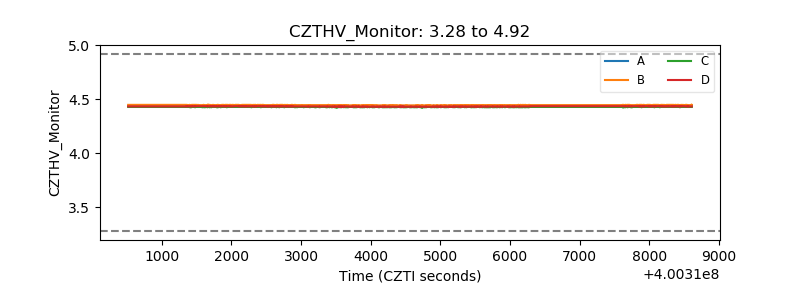 |
| D_VDD | 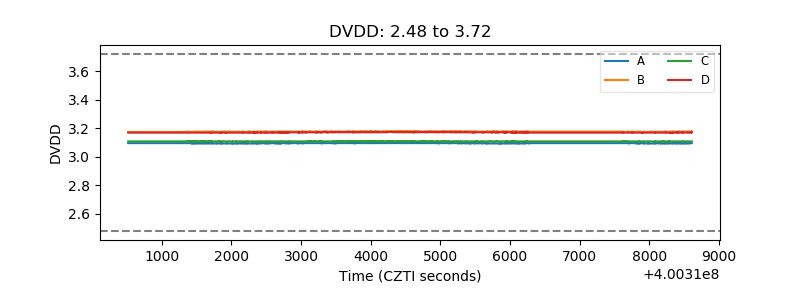 |
| Temperature 1 | 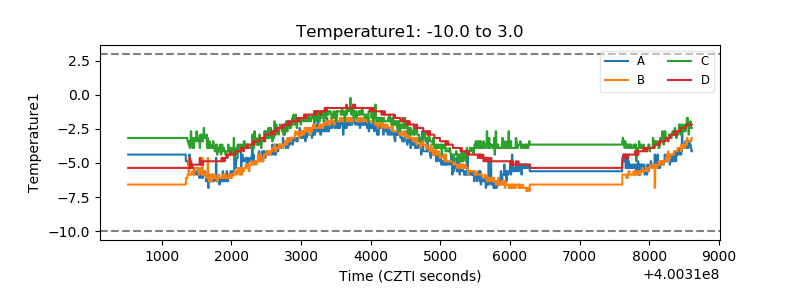 |
| Veto HV Monitor |  |
| Veto LLD | 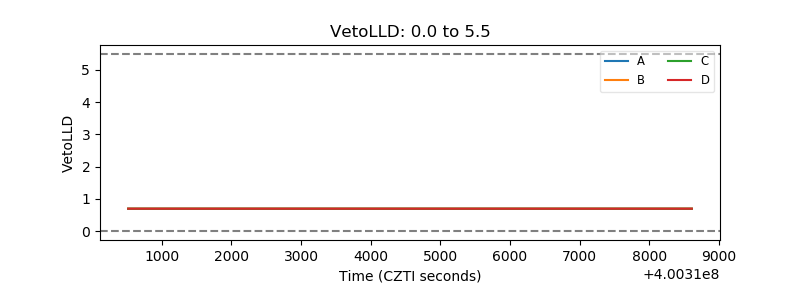 |
| Alpha Counter | 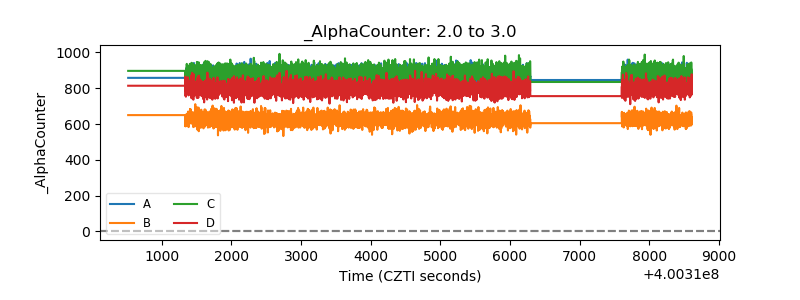 |
| _CPM_Rate | 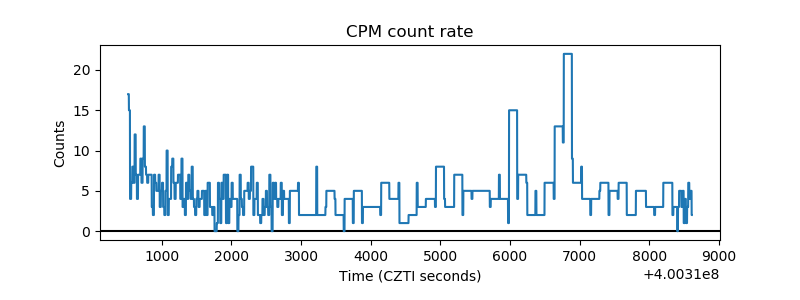 |
| CZT Counter | 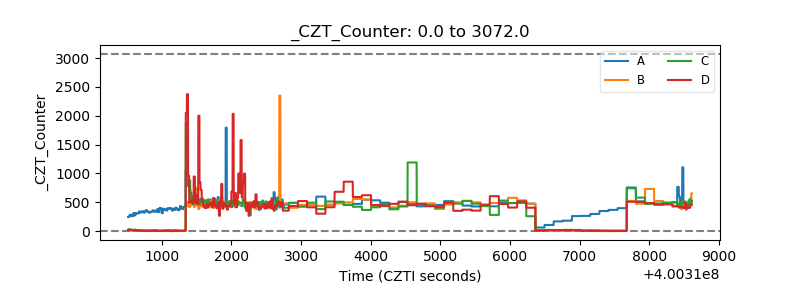 |
| +2.5 Volts monitor | 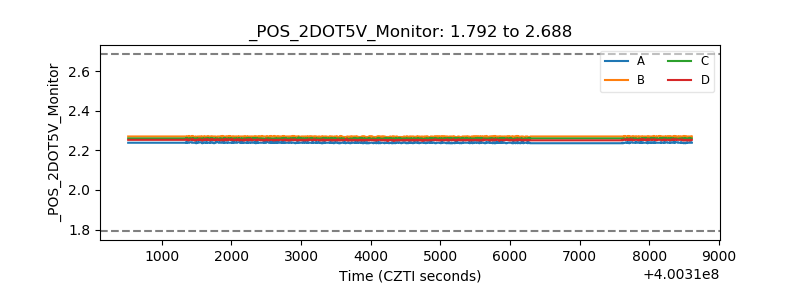 |
| +5 Volts monitor | 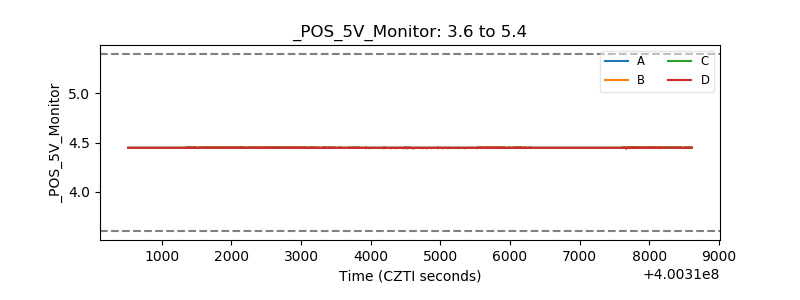 |
| _ROLL_ROT | 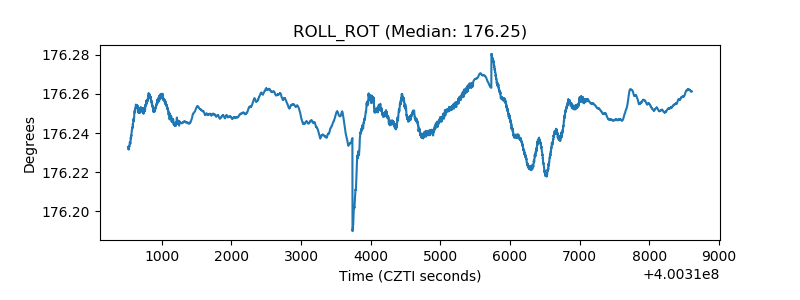 |
| _Roll_DEC | 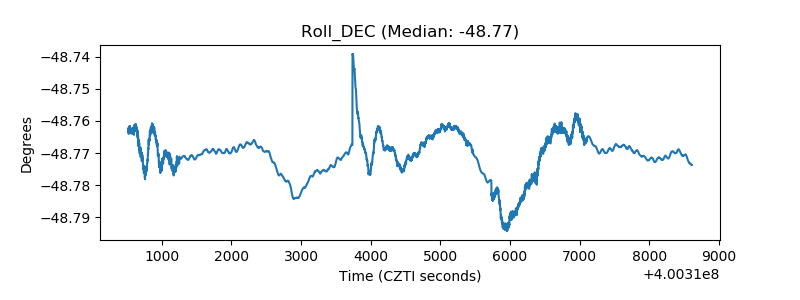 |
| _Roll_RA | 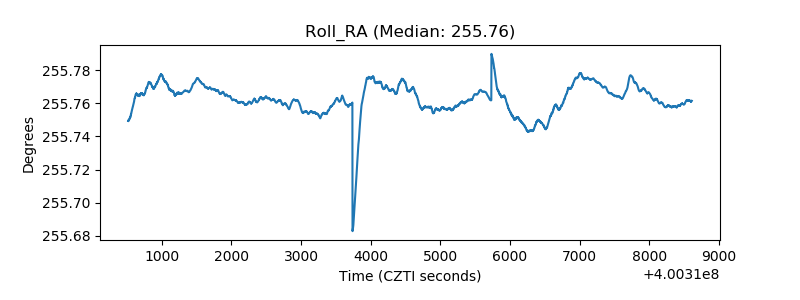 |
| Veto Counter | 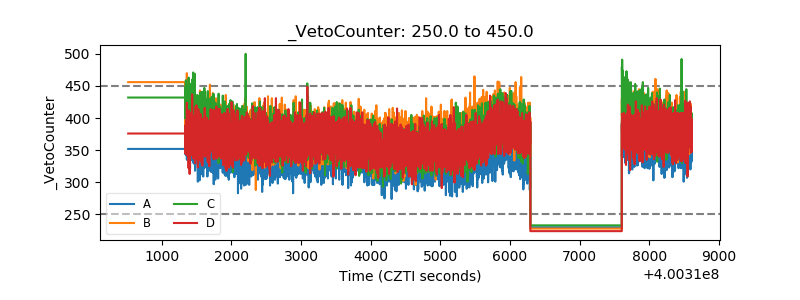 |