| Param | Original file | Final file |
|---|---|---|
| Filename | modeM0/AS1T05_051T01_9000005334_37558cztM0_level2.evt | modeM0/AS1T05_051T01_9000005334_37558cztM0_level2_quad_clean.evt |
| Size (bytes) | 571,933,440 | 100,653,120 |
| Size | 545.4 MB | 96.0 MB |
| Events in quadrant A | 5,430,899 | 640,102 |
| Events in quadrant B | 3,606,964 | 664,050 |
| Events in quadrant C | 3,398,549 | 668,633 |
| Events in quadrant D | 4,441,487 | 618,980 |
| Mode M9 | |||
|---|---|---|---|
| Quadrant | BADHDUFLAG | Total packets | Discarded packets |
| A | 0 | 18 | 0 |
| B | 0 | 18 | 0 |
| C | 0 | 18 | 0 |
| D | 0 | 19 | 0 |
| Mode M0 | |||
|---|---|---|---|
| Quadrant | BADHDUFLAG | Total packets | Discarded packets |
| A | 0 | 20350 | 2 |
| B | 0 | 14766 | 2 |
| C | 0 | 13947 | 2 |
| D | 0 | 17491 | 2 |
| Mode SS | |||
|---|---|---|---|
| Quadrant | BADHDUFLAG | Total packets | Discarded packets |
| A | 0 | 134 | 0 |
| B | 0 | 134 | 0 |
| C | 0 | 134 | 0 |
| D | 0 | 134 | 0 |
| Quadrant | Total seconds | Saturated seconds | Saturation percentage |
|---|---|---|---|
| A | 6540 | 300 | 4.587156% |
| B | 6540 | 119 | 1.819572% |
| C | 6540 | 40 | 0.611621% |
| D | 6540 | 233 | 3.562691% |
Noise dominated data is calculated using 1-second bins in cleaned event files. If a bin has >2000 counts, and if more than 50% of those come from <1% of pixels, then it is considered to be noise-dominated and hence unusable.
| Quadrant | # 1 sec bins | Bins with >0 counts | Bins with >2000 counts | High rate bins dominated by noise | Noise dominated (total time) | Noise dominated (detector-on time) | Marked lightcurve |
|---|---|---|---|---|---|---|---|
| A | 7853 | 6541 | 294 | 294 | 3.74% | 4.49% | 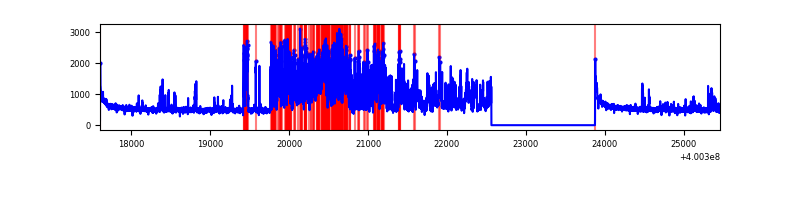 |
| B | 7853 | 6541 | 90 | 90 | 1.15% | 1.38% | 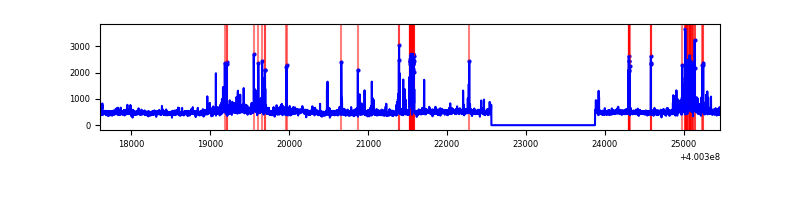 |
| C | 7853 | 6541 | 26 | 26 | 0.33% | 0.40% | 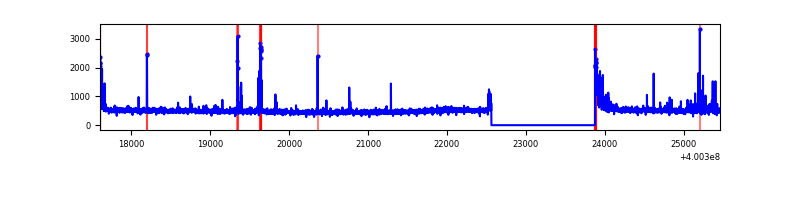 |
| D | 7853 | 6541 | 216 | 216 | 2.75% | 3.30% |  |
Top three noisy pixels from each quadrant. If the there are fewer than three noisy pixels in the level2.evt file, extra rows are filled as -1
| Pixel properties | Quadrant properties | ||||||
|---|---|---|---|---|---|---|---|
| Quadrant | DetID | PixID | Counts | Sigma | Mean | Median | Sigma |
| A | 15 | 222 | 2105489 | 13993.52 | 744 | 730 | 150.4 |
| A | 10 | 83 | 346731 | 2300.39 | 744 | 730 | 150.4 |
| A | 9 | 143 | 34651 | 225.52 | 744 | 730 | 150.4 |
| B | 5 | 172 | 186191 | 1302.71 | 742 | 724 | 142.4 |
| B | 5 | 200 | 119056 | 831.16 | 742 | 724 | 142.4 |
| B | 0 | 213 | 98345 | 685.68 | 742 | 724 | 142.4 |
| C | 15 | 214 | 300484 | 1753.84 | 730 | 735 | 170.9 |
| C | 0 | 10 | 95095 | 552.1 | 730 | 735 | 170.9 |
| C | 15 | 208 | 65269 | 377.59 | 730 | 735 | 170.9 |
| D | 13 | 249 | 478588 | 2708.47 | 723 | 703 | 176.4 |
| D | 2 | 249 | 435635 | 2465.03 | 723 | 703 | 176.4 |
| D | 5 | 222 | 191882 | 1083.53 | 723 | 703 | 176.4 |
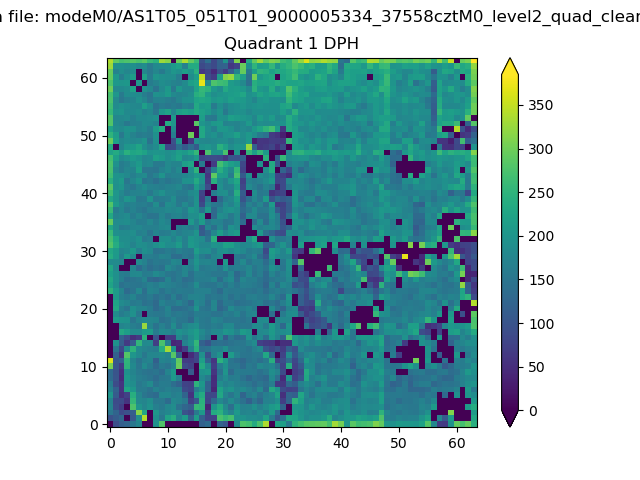
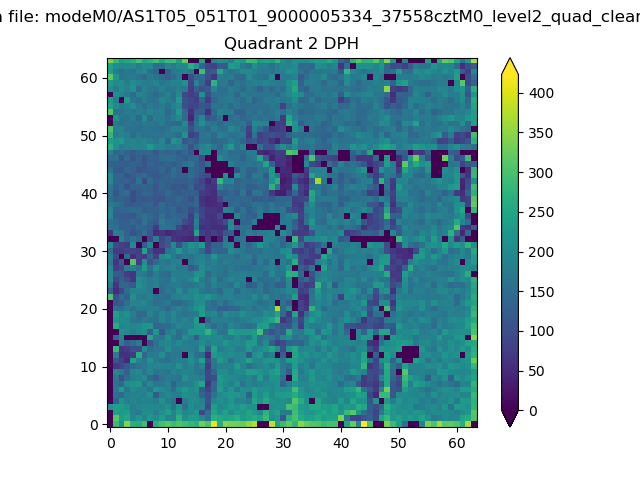
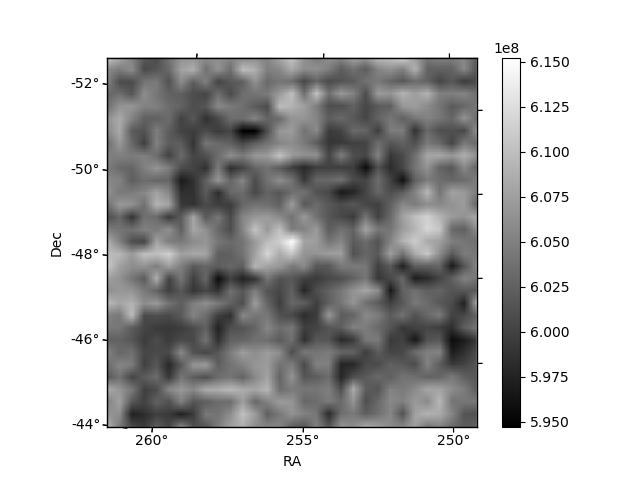
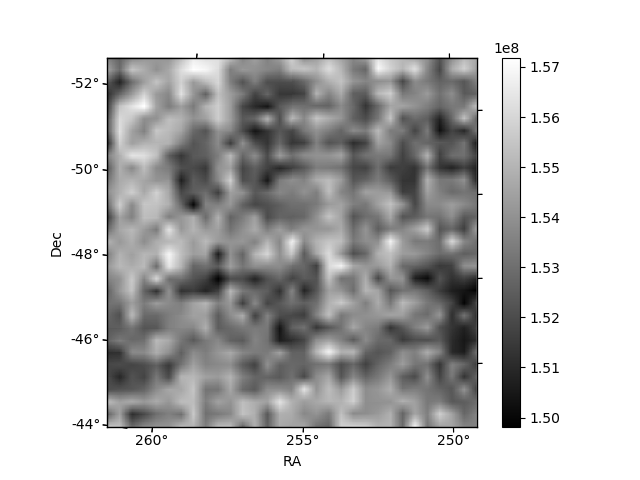
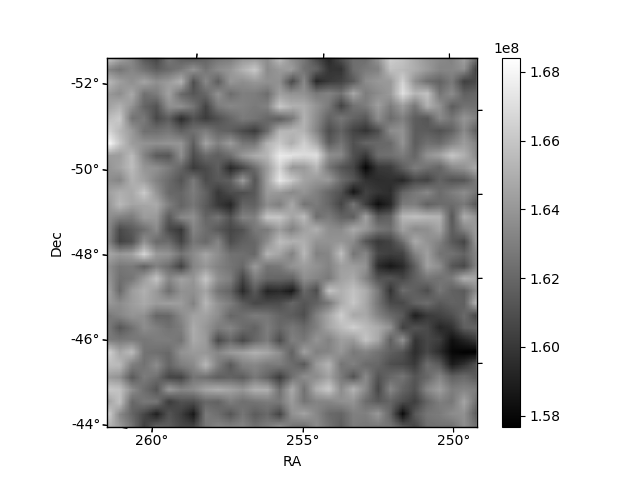
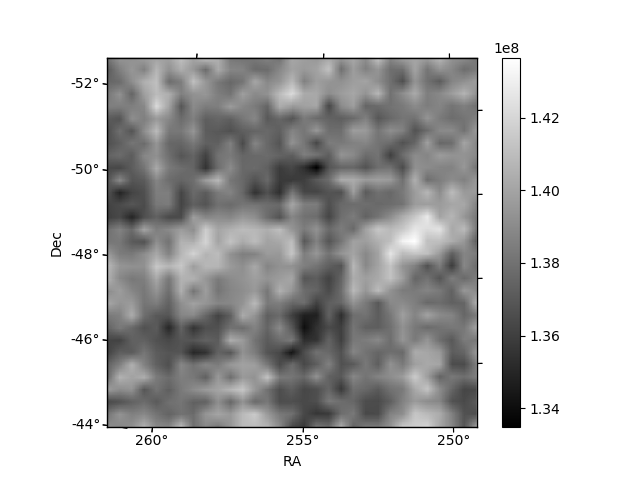
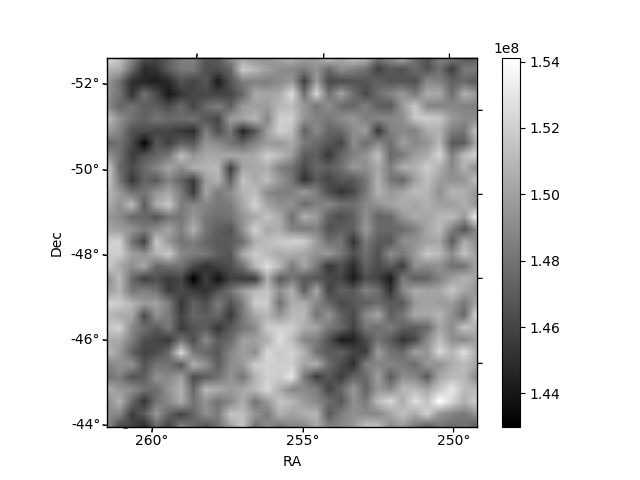
Histogram calculated using DETX and DETY for each event in the final _common_clean file
| Quadrant A | 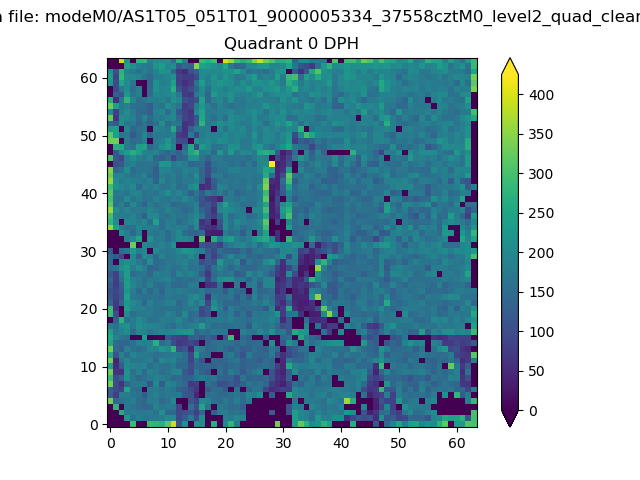 |
 |
Quadrant B |
|---|---|---|---|
| Quadrant D | 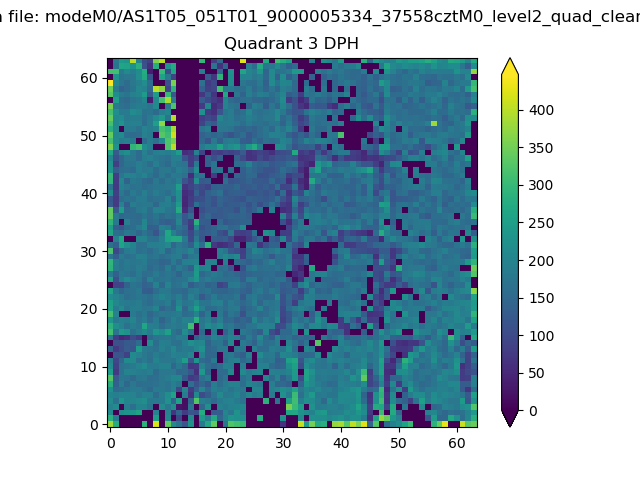 |
 |
Quadrant C |
| Plot type | Count rate plots | Images |
|---|---|---|
| Comparison with Poisson distribution Blue bars denote a histogram of data divided into 1 sec bins. Red curve is a Poisson curve with rate = median count rate of data. |
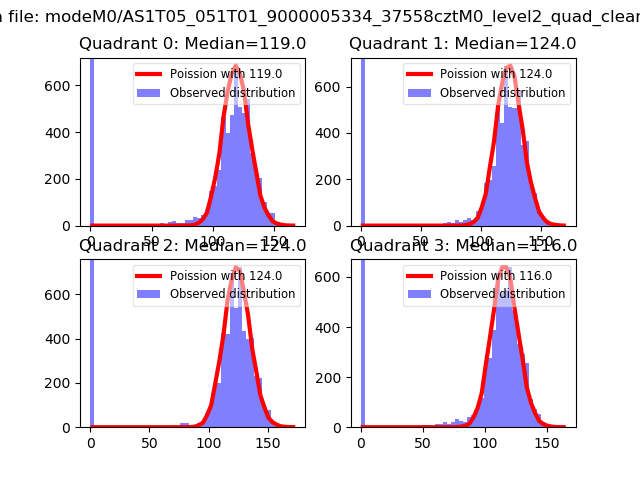 |
 |
| Quadrant-wise count rates Data is divided into 100 sec bins |
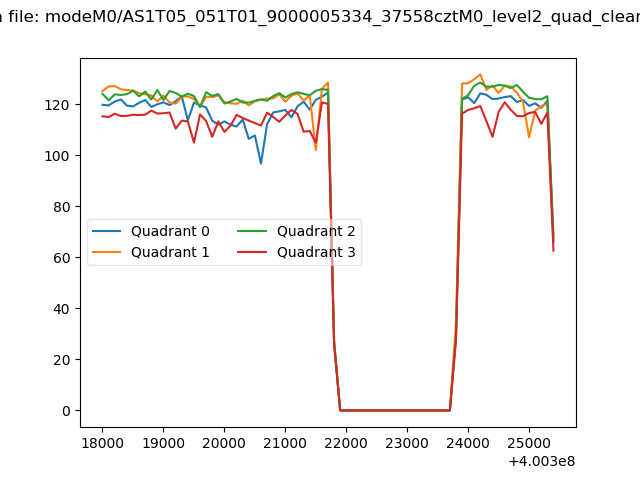 |
|
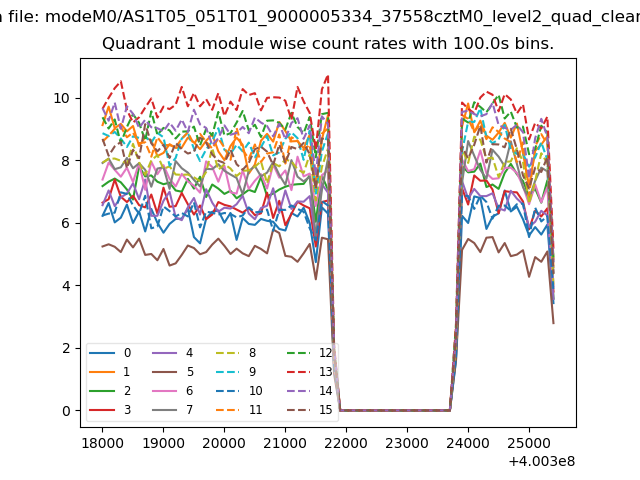
| Module-wise count rates for Quadrant A Data is divided into 100 sec bins |
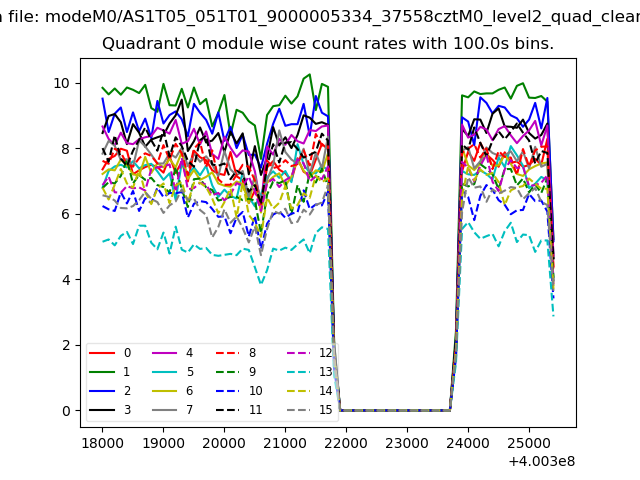 |
 |
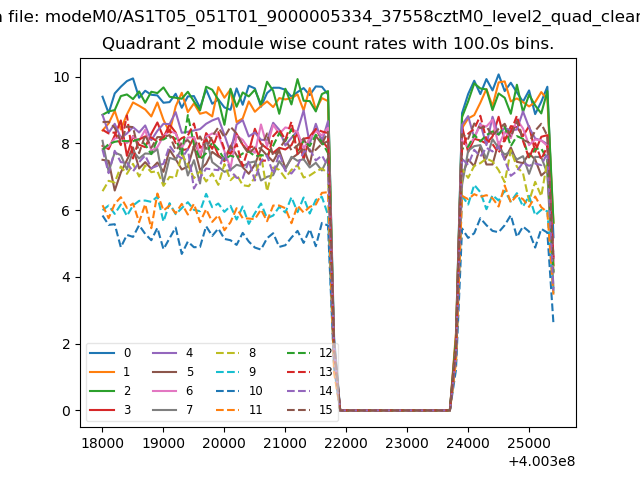
| Module-wise count rates for Quadrant B Data is divided into 100 sec bins |
 |
 |
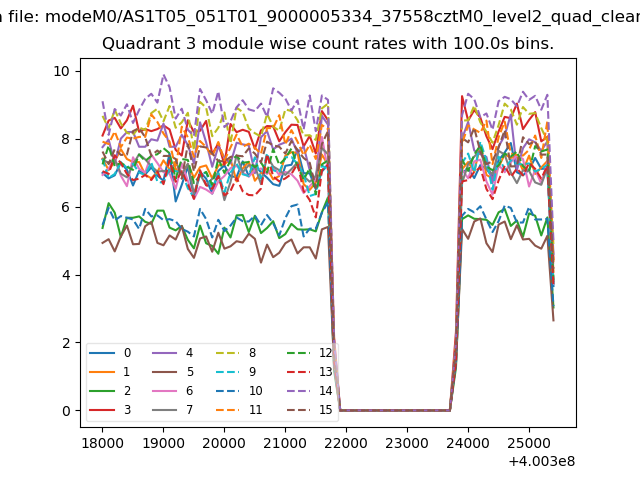
| Module-wise count rates for Quadrant C Data is divided into 100 sec bins |
 |
 |
| Module-wise count rates for Quadrant D Data is divided into 100 sec bins |
 |
 |
| Parameter | Plot |
|---|---|
| CZT HV Monitor |  |
| D_VDD | 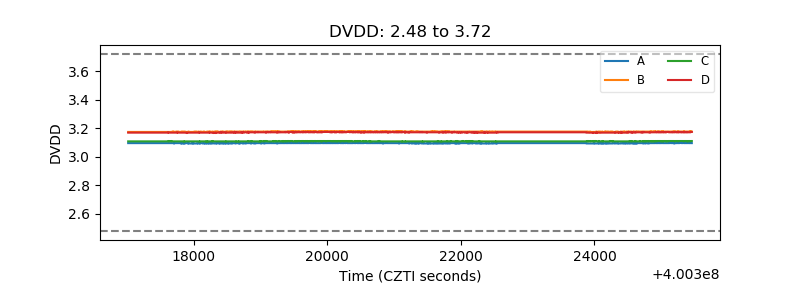 |
| Temperature 1 | 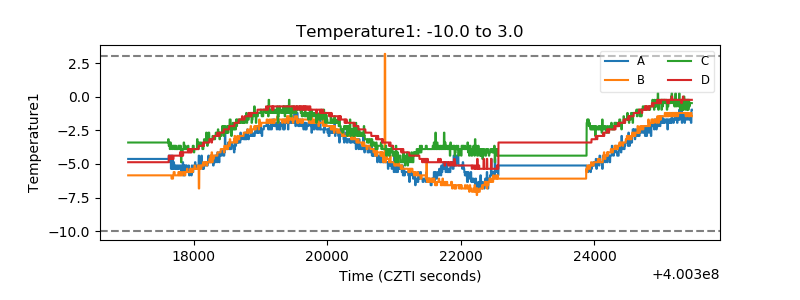 |
| Veto HV Monitor | 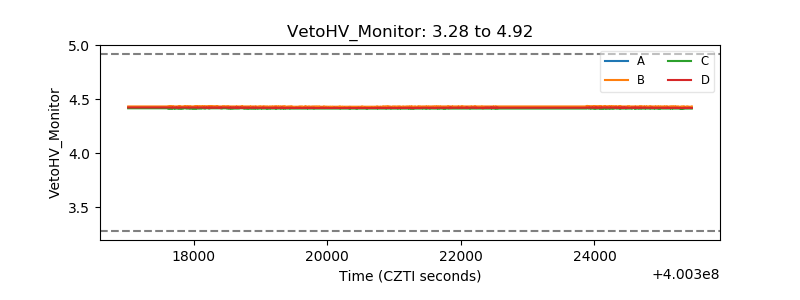 |
| Veto LLD | 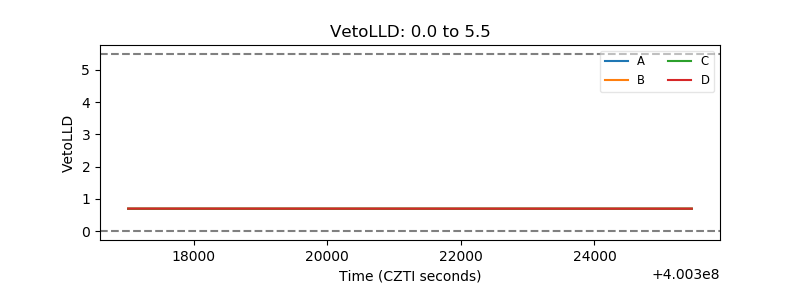 |
| Alpha Counter | 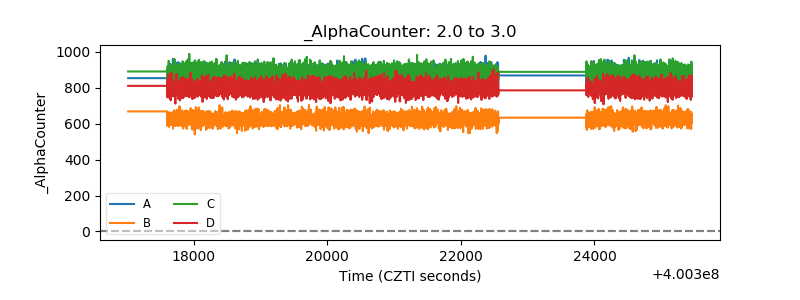 |
| _CPM_Rate | 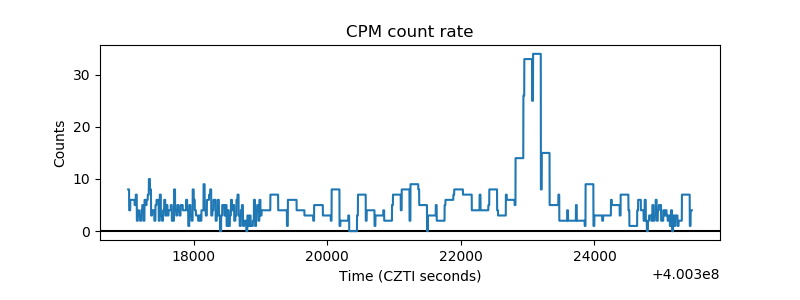 |
| CZT Counter | 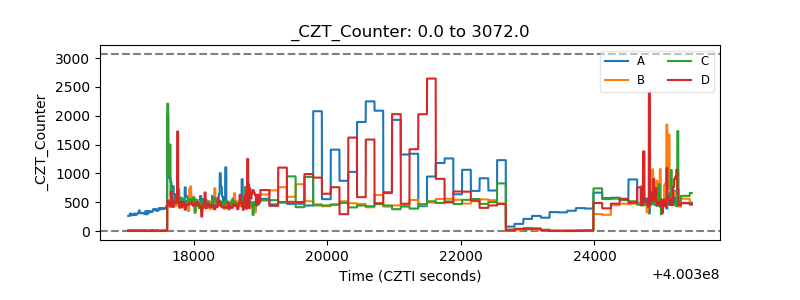 |
| +2.5 Volts monitor | 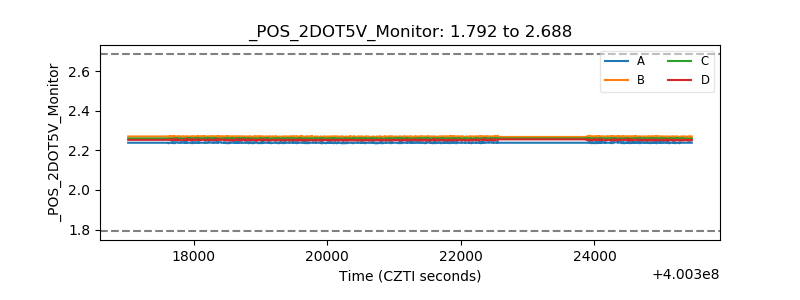 |
| +5 Volts monitor | 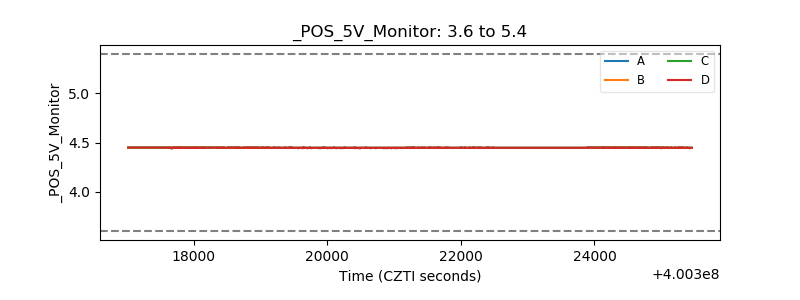 |
| _ROLL_ROT | 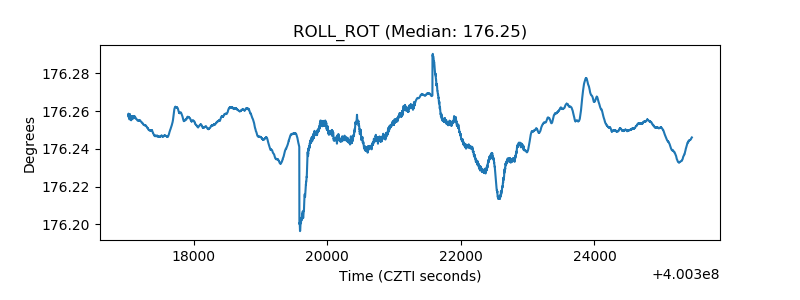 |
| _Roll_DEC | 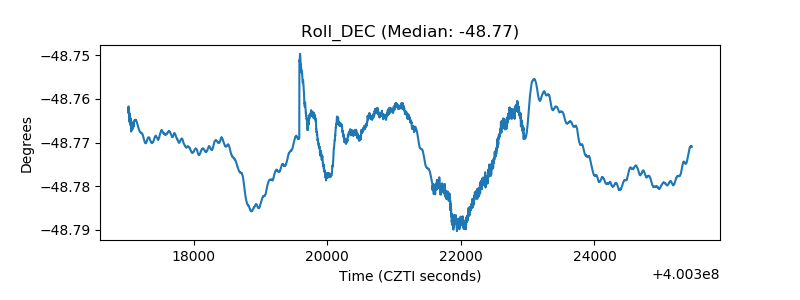 |
| _Roll_RA | 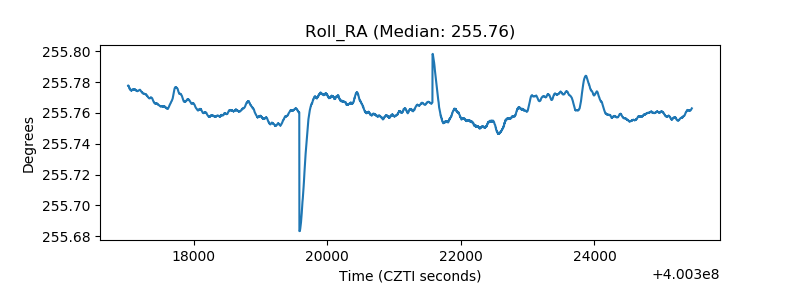 |
| Veto Counter | 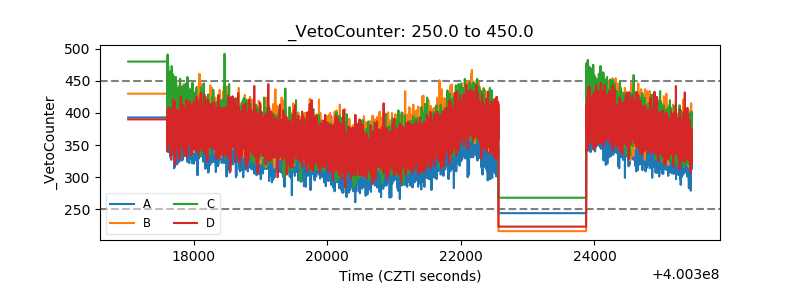 |