| Param | Original file | Final file |
|---|---|---|
| Filename | modeM0/AS1C07_001T11_9000005336cztM0_level2.fits | modeM0/AS1C07_001T11_9000005336cztM0_level2_quad_clean.evt |
| Size (bytes) | 525,081,600 | 775,033,920 |
| Size | 500.8 MB | 739.1 MB |
| Events in quadrant A | 3,190,626 | 5,193,310 |
| Events in quadrant B | 3,027,896 | 5,137,476 |
| Events in quadrant C | 3,168,078 | 5,031,778 |
| Events in quadrant D | 2,514,978 | 4,116,146 |
| Mode M0 | |||
|---|---|---|---|
| Quadrant | BADHDUFLAG | Total packets | Discarded packets |
| A | 0 | 123636 | 0 |
| B | 0 | 140459 | 0 |
| C | 0 | 123721 | 0 |
| D | 0 | 205942 | 0 |
| Mode M9 | |||
|---|---|---|---|
| Quadrant | BADHDUFLAG | Total packets | Discarded packets |
| A | 0 | 225 | 0 |
| B | 0 | 225 | 0 |
| C | 0 | 225 | 0 |
| D | 0 | 225 | 0 |
| Mode SS | |||
|---|---|---|---|
| Quadrant | BADHDUFLAG | Total packets | Discarded packets |
| A | 0 | 1192 | 0 |
| B | 0 | 1192 | 0 |
| C | 0 | 1192 | 0 |
| D | 0 | 1192 | 0 |
| Quadrant | Total seconds | Saturated seconds | Saturation percentage |
|---|---|---|---|
| A | 58257 | 153 | 0.262629% |
| B | 58257 | 1189 | 2.040956% |
| C | 58257 | 372 | 0.638550% |
| D | 58257 | 8842 | 15.177575% |
Noise dominated data is calculated using 1-second bins in cleaned event files. If a bin has >2000 counts, and if more than 50% of those come from <1% of pixels, then it is considered to be noise-dominated and hence unusable.
| Quadrant | # 1 sec bins | Bins with >0 counts | Bins with >2000 counts | High rate bins dominated by noise | Noise dominated (total time) | Noise dominated (detector-on time) | Marked lightcurve |
|---|---|---|---|---|---|---|---|
| A | 80807 | 58255 | 0 | 0 | 0.00% | 0.00% | 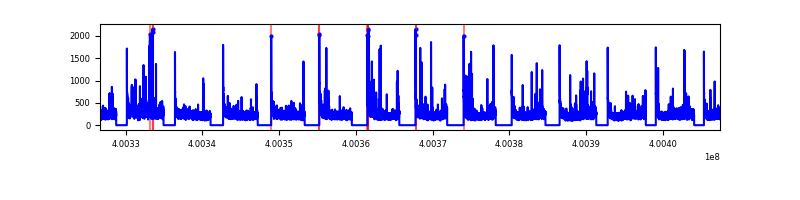 |
| B | 80807 | 58181 | 0 | 0 | 0.00% | 0.00% | 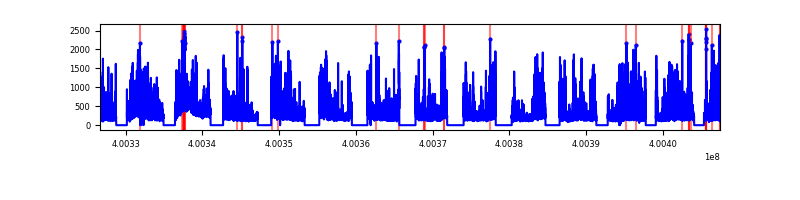 |
| C | 80808 | 58248 | 0 | 0 | 0.00% | 0.00% | 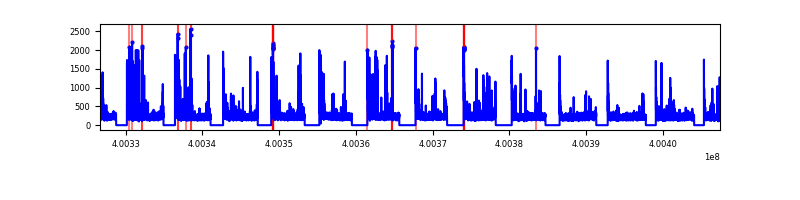 |
| D | 80808 | 58111 | 0 | 0 | 0.00% | 0.00% | 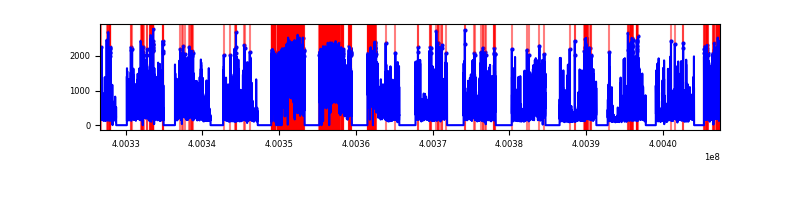 |
Top three noisy pixels from each quadrant. If the there are fewer than three noisy pixels in the level2.evt file, extra rows are filled as -1
| Pixel properties | Quadrant properties | ||||||
|---|---|---|---|---|---|---|---|
| Quadrant | DetID | PixID | Counts | Sigma | Mean | Median | Sigma |
| A | 0 | 29 | 2714 | 9.27 | 834 | 785 | 208.1 |
| A | 9 | 19 | 2647 | 8.95 | 834 | 785 | 208.1 |
| A | 7 | 110 | 2603 | 8.74 | 834 | 785 | 208.1 |
| B | 2 | 9 | 2666 | 12.18 | 805 | 773 | 155.5 |
| B | 3 | 80 | 2428 | 10.64 | 805 | 773 | 155.5 |
| B | 5 | 128 | 2170 | 8.99 | 805 | 773 | 155.5 |
| C | 1 | 81 | 2654 | 8.72 | 837 | 786 | 214.2 |
| C | 1 | 80 | 2600 | 8.47 | 837 | 786 | 214.2 |
| C | 3 | 203 | 2469 | 7.86 | 837 | 786 | 214.2 |
| D | 7 | 3 | 1915 | 6.5 | 718 | 654 | 193.9 |
| D | 10 | 189 | 1857 | 6.21 | 718 | 654 | 193.9 |
| D | 4 | 160 | 1849 | 6.16 | 718 | 654 | 193.9 |
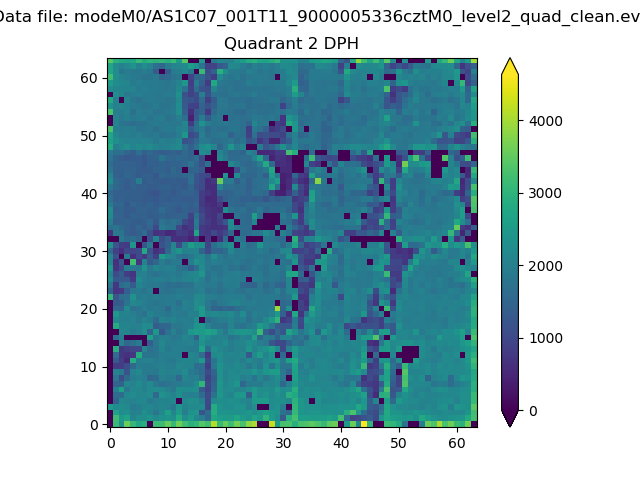
Histogram calculated using DETX and DETY for each event in the final _common_clean file
| Quadrant A | 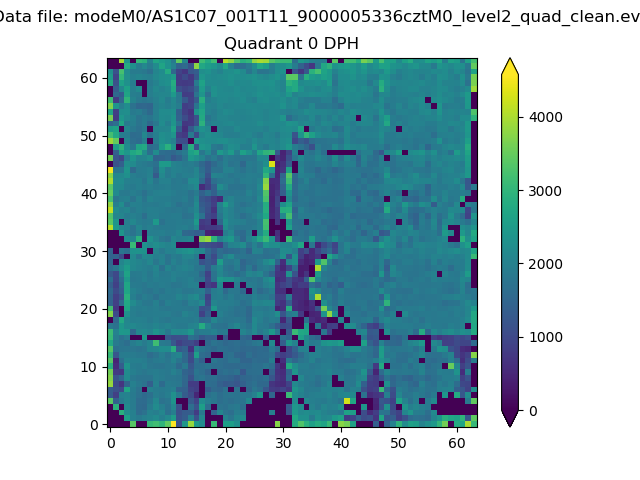 |
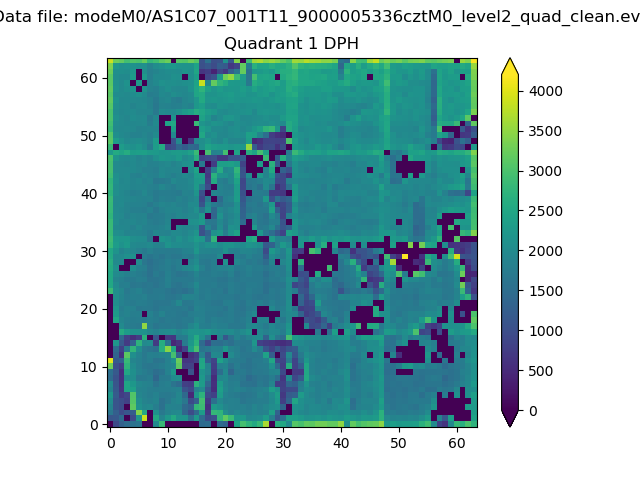 |
Quadrant B |
|---|---|---|---|
| Quadrant D | 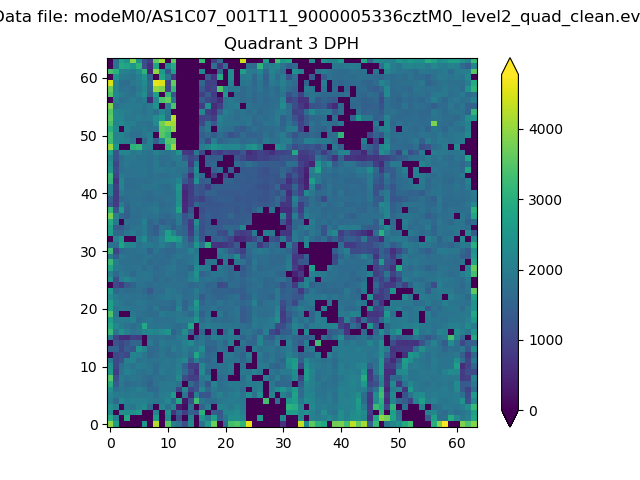 |
 |
Quadrant C |
| Plot type | Count rate plots | Images |
|---|---|---|
| Comparison with Poisson distribution Blue bars denote a histogram of data divided into 1 sec bins. Red curve is a Poisson curve with rate = median count rate of data. |
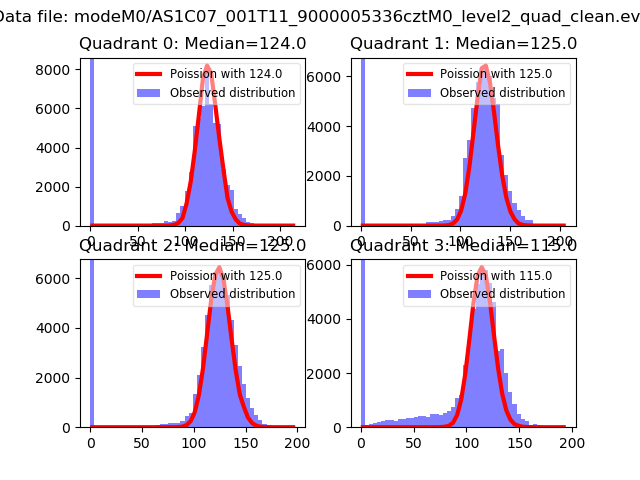 |
 |
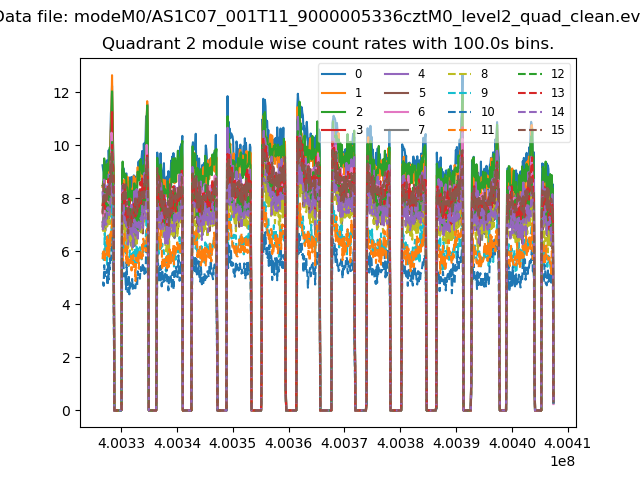
| Quadrant-wise count rates Data is divided into 100 sec bins |
 |
|
| Module-wise count rates for Quadrant A Data is divided into 100 sec bins |
 |
 |
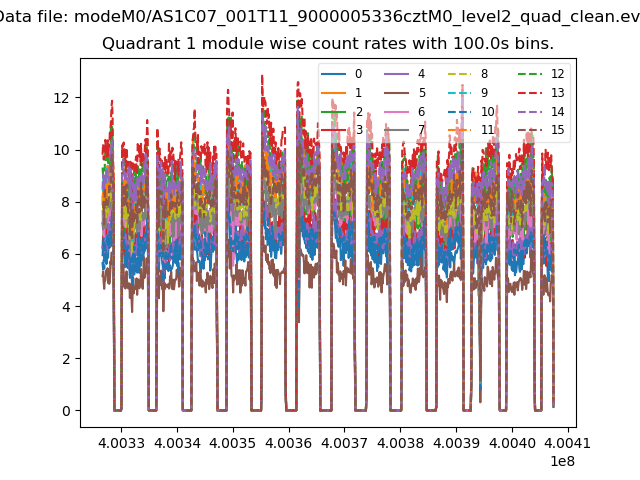
| Module-wise count rates for Quadrant B Data is divided into 100 sec bins |
 |
 |
| Module-wise count rates for Quadrant C Data is divided into 100 sec bins |
 |
 |
| Module-wise count rates for Quadrant D Data is divided into 100 sec bins |
 |
 |
| Parameter | Plot |
|---|---|
| CZT HV Monitor |  |
| D_VDD | 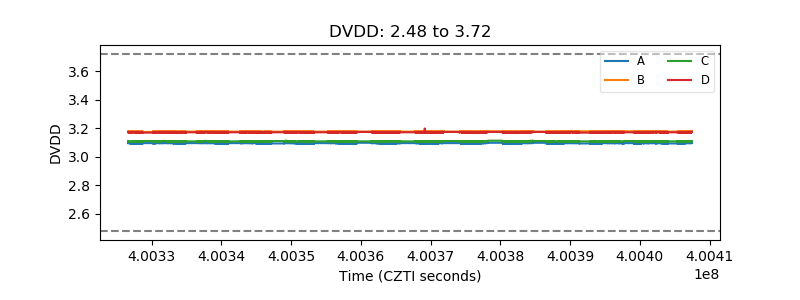 |
| Temperature 1 | 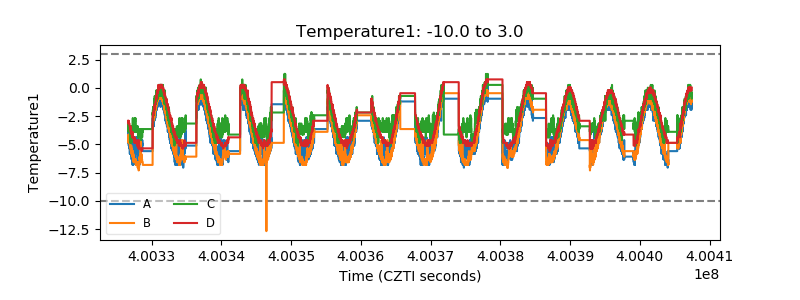 |
| Veto HV Monitor | 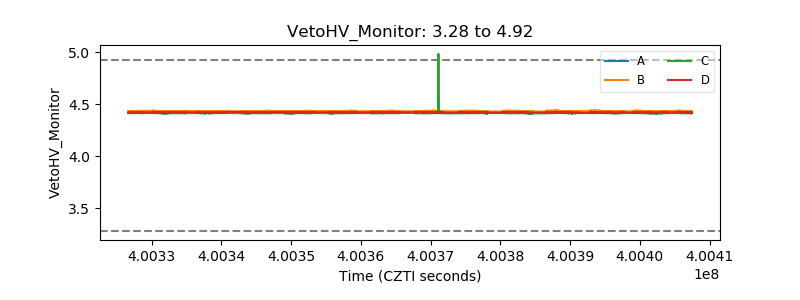 |
| Veto LLD | 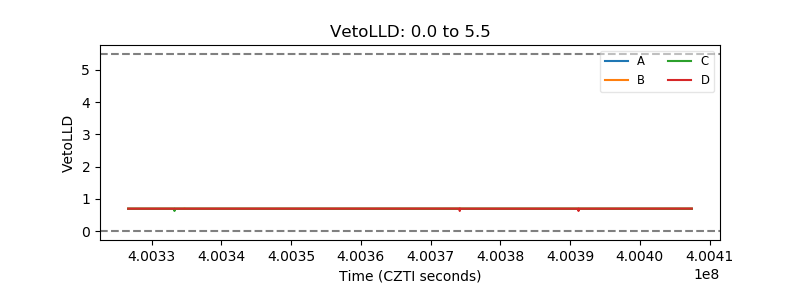 |
| Alpha Counter | 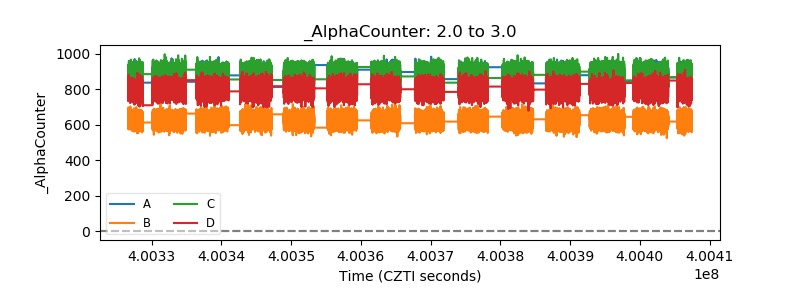 |
| _CPM_Rate | 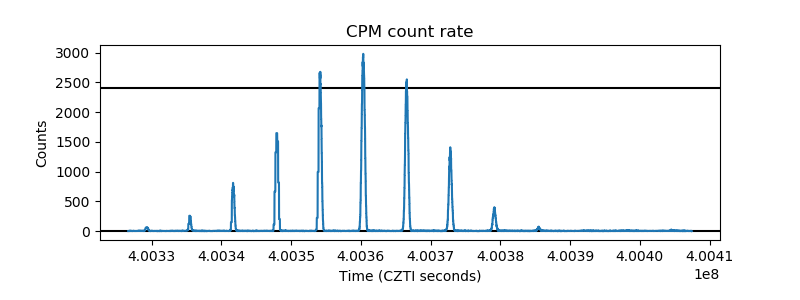 |
| CZT Counter | 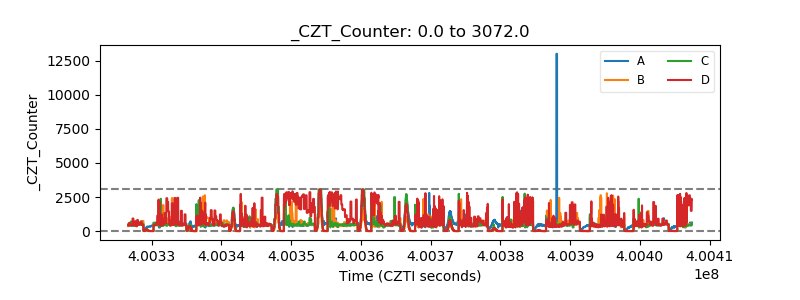 |
| +2.5 Volts monitor |  |
| +5 Volts monitor | 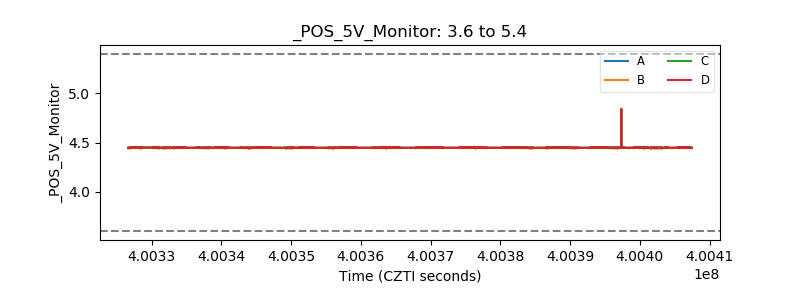 |
| _ROLL_ROT | 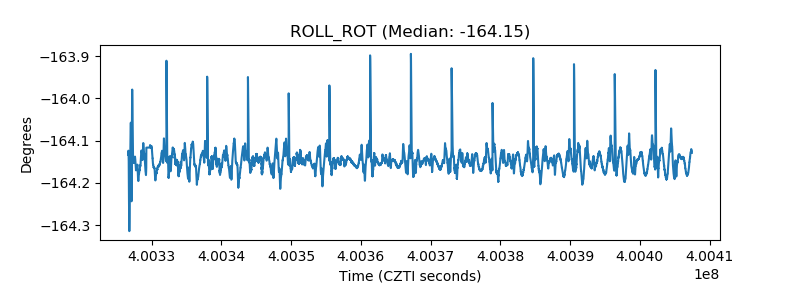 |
| _Roll_DEC | 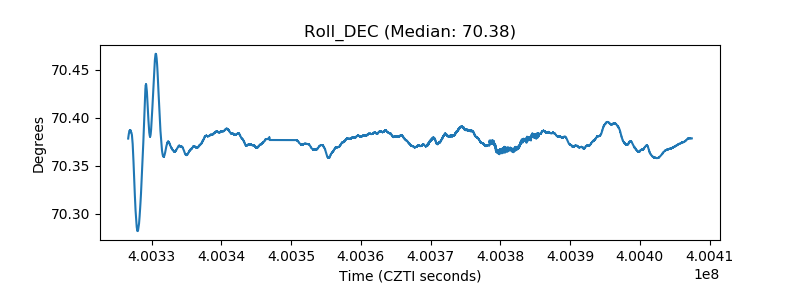 |
| _Roll_RA | 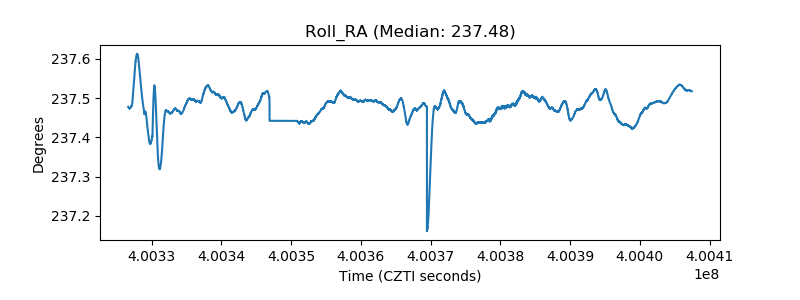 |
| Veto Counter |  |