| Param | Original file | Final file |
|---|---|---|
| Filename | modeM0/AS1C07_001T11_9000005336_37561cztM0_level2.evt | modeM0/AS1C07_001T11_9000005336_37561cztM0_level2_quad_clean.evt |
| Size (bytes) | 479,269,440 | 99,915,840 |
| Size | 457.1 MB | 95.3 MB |
| Events in quadrant A | 2,806,635 | 691,108 |
| Events in quadrant B | 2,984,456 | 695,540 |
| Events in quadrant C | 2,907,380 | 686,684 |
| Events in quadrant D | 5,444,060 | 568,807 |
| Mode M0 | |||
|---|---|---|---|
| Quadrant | BADHDUFLAG | Total packets | Discarded packets |
| A | 0 | 11870 | 3 |
| B | 0 | 12515 | 2 |
| C | 0 | 12030 | 2 |
| D | 0 | 19946 | 2 |
| Mode M9 | |||
|---|---|---|---|
| Quadrant | BADHDUFLAG | Total packets | Discarded packets |
| A | 0 | 23 | 0 |
| B | 0 | 23 | 0 |
| C | 0 | 23 | 0 |
| D | 0 | 24 | 0 |
| Mode SS | |||
|---|---|---|---|
| Quadrant | BADHDUFLAG | Total packets | Discarded packets |
| A | 0 | 112 | 0 |
| B | 0 | 112 | 0 |
| C | 0 | 112 | 0 |
| D | 0 | 112 | 0 |
| Quadrant | Total seconds | Saturated seconds | Saturation percentage |
|---|---|---|---|
| A | 5477 | 13 | 0.237356% |
| B | 5477 | 61 | 1.113748% |
| C | 5477 | 49 | 0.894650% |
| D | 5477 | 1202 | 21.946321% |
Noise dominated data is calculated using 1-second bins in cleaned event files. If a bin has >2000 counts, and if more than 50% of those come from <1% of pixels, then it is considered to be noise-dominated and hence unusable.
| Quadrant | # 1 sec bins | Bins with >0 counts | Bins with >2000 counts | High rate bins dominated by noise | Noise dominated (total time) | Noise dominated (detector-on time) | Marked lightcurve |
|---|---|---|---|---|---|---|---|
| A | 7240 | 5478 | 5 | 5 | 0.07% | 0.09% | 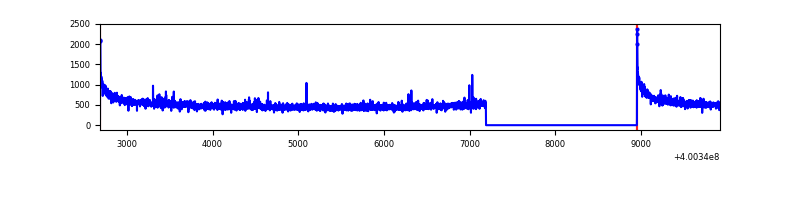 |
| B | 7240 | 5478 | 47 | 47 | 0.65% | 0.86% | 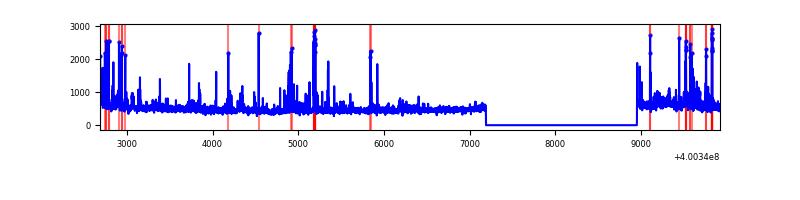 |
| C | 7240 | 5478 | 45 | 45 | 0.62% | 0.82% | 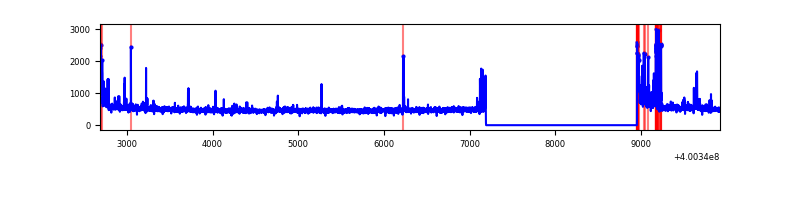 |
| D | 7239 | 5477 | 1180 | 1180 | 16.30% | 21.54% |  |
Top three noisy pixels from each quadrant. If the there are fewer than three noisy pixels in the level2.evt file, extra rows are filled as -1
| Pixel properties | Quadrant properties | ||||||
|---|---|---|---|---|---|---|---|
| Quadrant | DetID | PixID | Counts | Sigma | Mean | Median | Sigma |
| A | 10 | 83 | 346628 | 2752.36 | 619 | 605 | 125.7 |
| A | 12 | 189 | 26891 | 209.09 | 619 | 605 | 125.7 |
| A | 9 | 143 | 24303 | 188.5 | 619 | 605 | 125.7 |
| B | 5 | 172 | 132767 | 1153.25 | 616 | 600 | 114.6 |
| B | 0 | 230 | 65533 | 566.58 | 616 | 600 | 114.6 |
| B | 0 | 213 | 47895 | 412.68 | 616 | 600 | 114.6 |
| C | 15 | 214 | 250276 | 1777.04 | 607 | 611 | 140.5 |
| C | 14 | 254 | 193286 | 1371.41 | 607 | 611 | 140.5 |
| C | 0 | 10 | 86289 | 609.83 | 607 | 611 | 140.5 |
| D | 12 | 235 | 1824948 | 14083.32 | 530 | 515 | 129.5 |
| D | 2 | 249 | 852704 | 6578.29 | 530 | 515 | 129.5 |
| D | 12 | 233 | 281906 | 2172.14 | 530 | 515 | 129.5 |
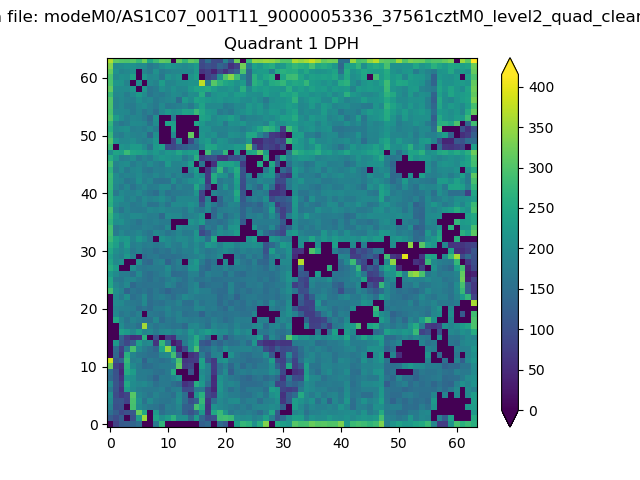
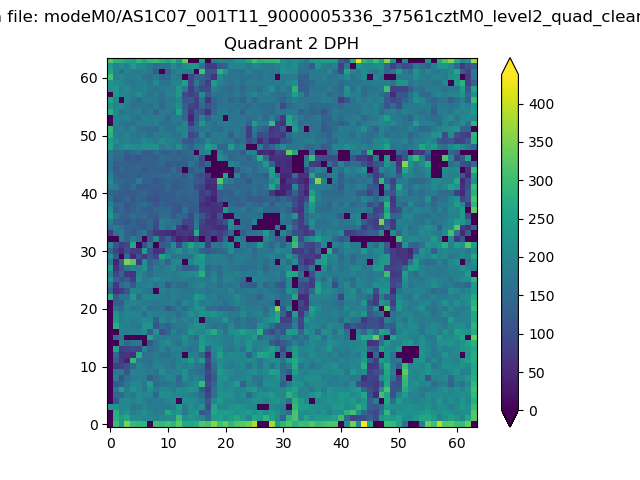
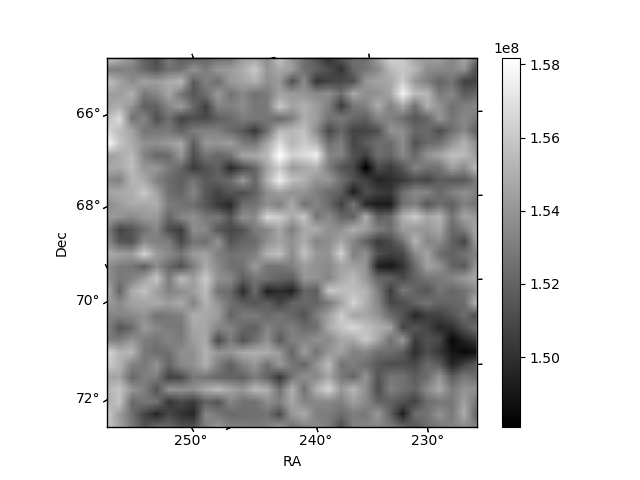
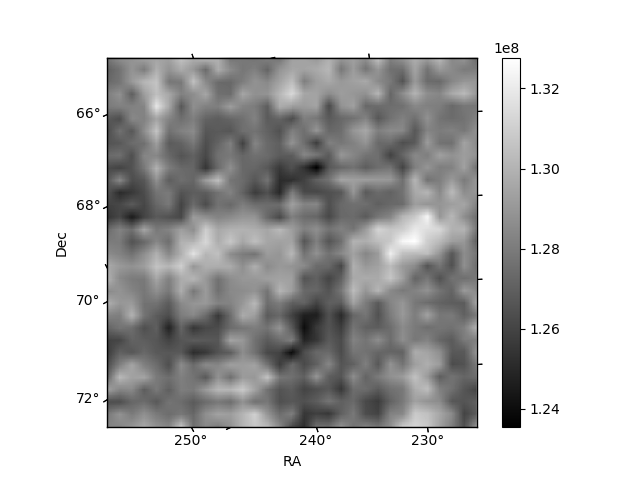
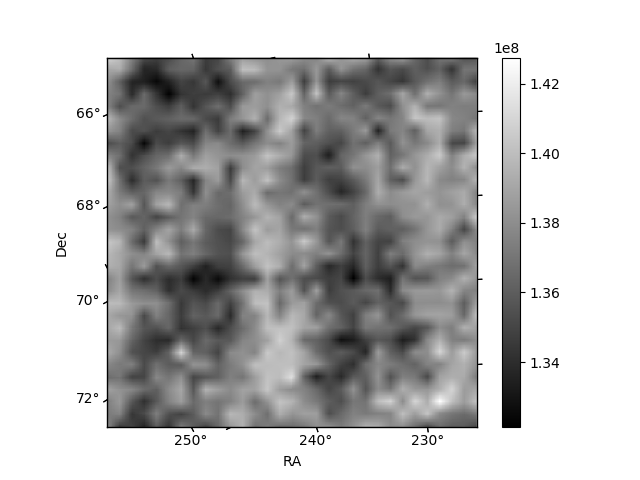
Histogram calculated using DETX and DETY for each event in the final _common_clean file
| Quadrant A | 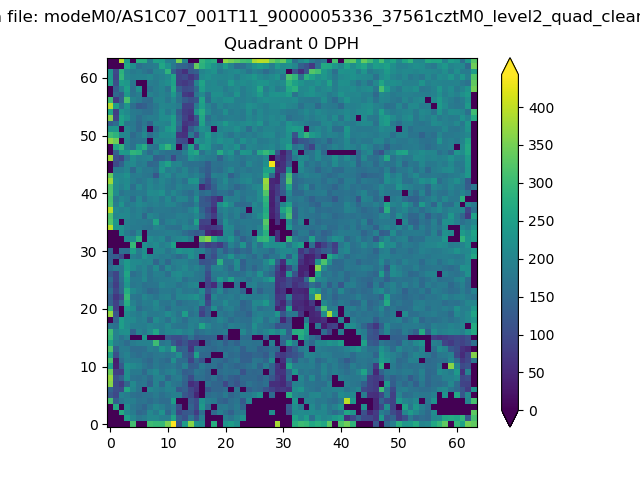 |
 |
Quadrant B |
|---|---|---|---|
| Quadrant D | 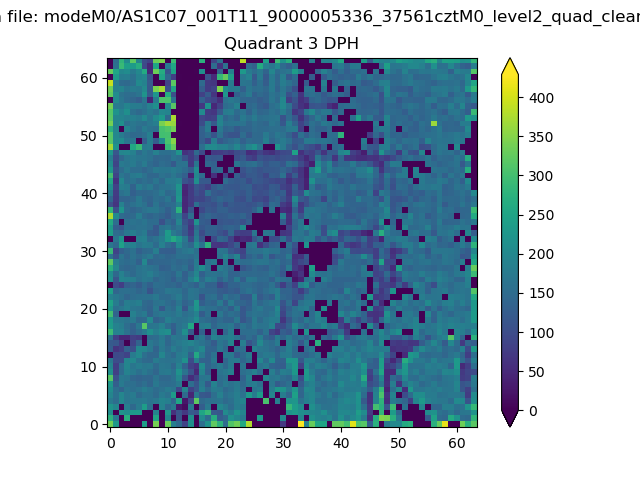 |
 |
Quadrant C |
| Plot type | Count rate plots | Images |
|---|---|---|
| Comparison with Poisson distribution Blue bars denote a histogram of data divided into 1 sec bins. Red curve is a Poisson curve with rate = median count rate of data. |
 |
 |
| Quadrant-wise count rates Data is divided into 100 sec bins |
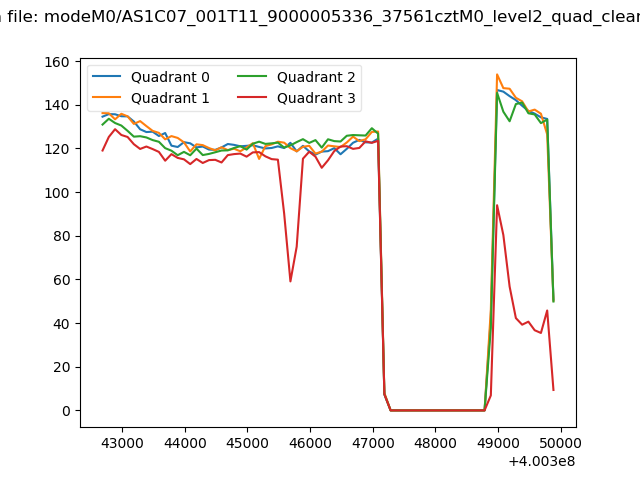 |
|
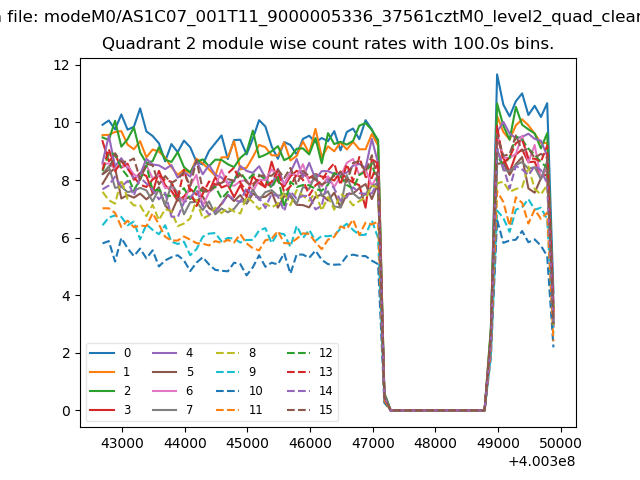
| Module-wise count rates for Quadrant A Data is divided into 100 sec bins |
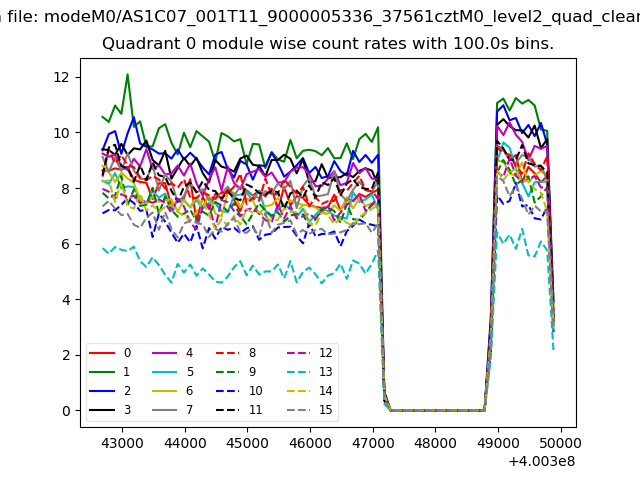 |
 |
| Module-wise count rates for Quadrant B Data is divided into 100 sec bins |
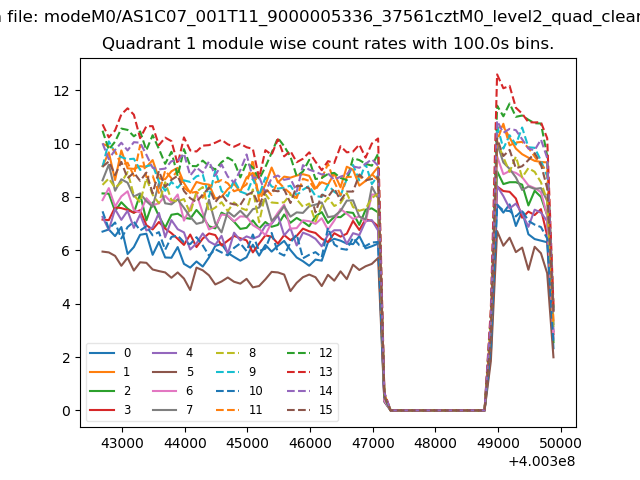 |
 |
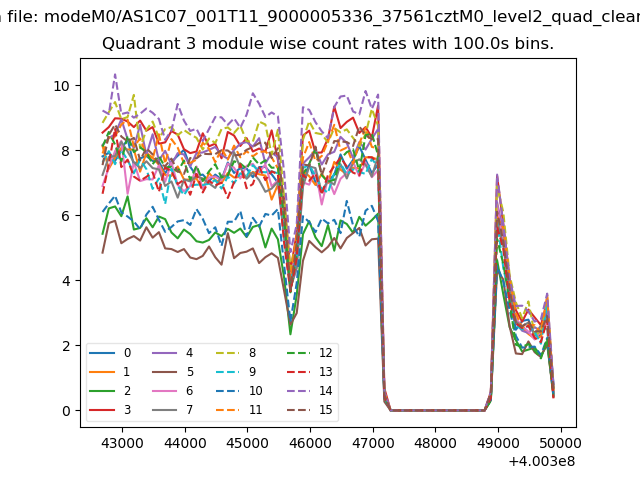
| Module-wise count rates for Quadrant C Data is divided into 100 sec bins |
 |
 |
| Module-wise count rates for Quadrant D Data is divided into 100 sec bins |
 |
 |
| Parameter | Plot |
|---|---|
| CZT HV Monitor | 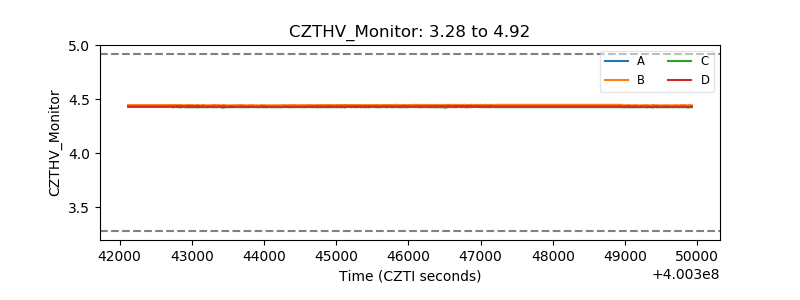 |
| D_VDD | 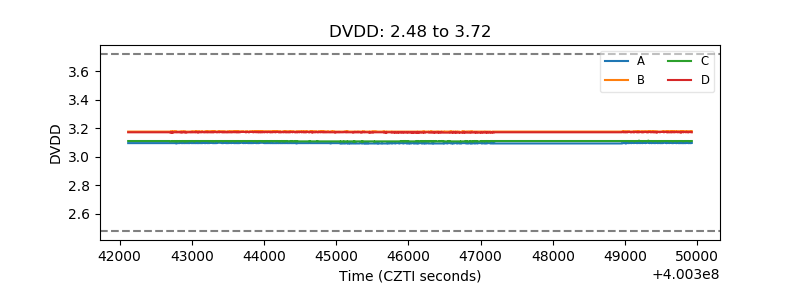 |
| Temperature 1 | 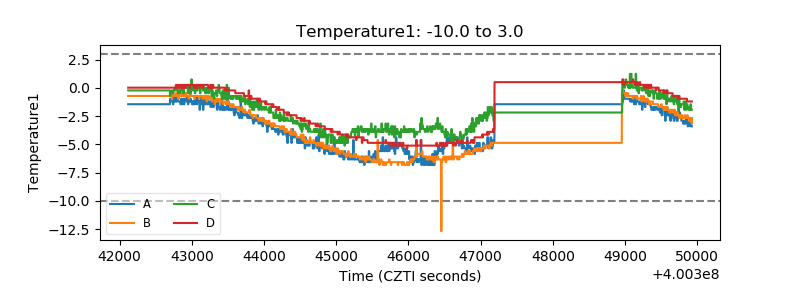 |
| Veto HV Monitor | 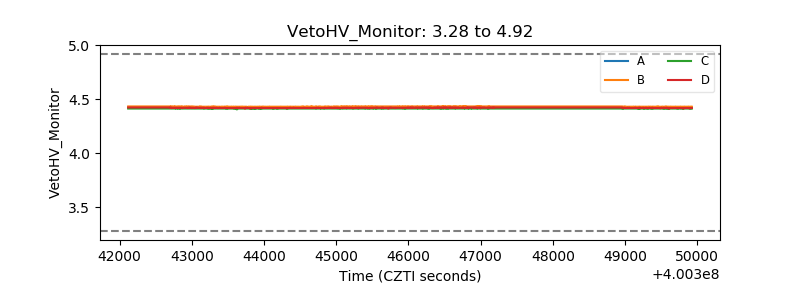 |
| Veto LLD | 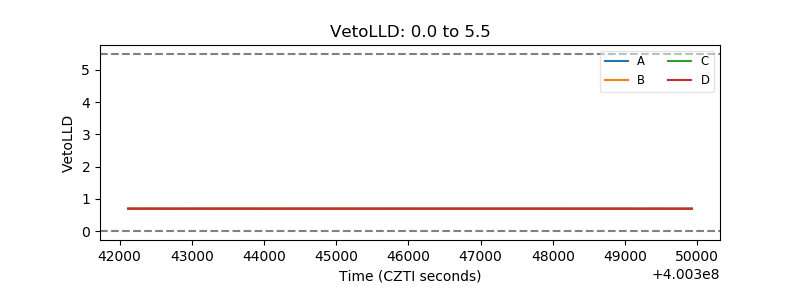 |
| Alpha Counter | 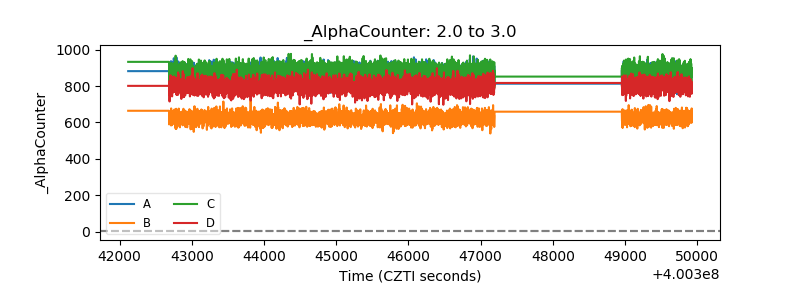 |
| _CPM_Rate | 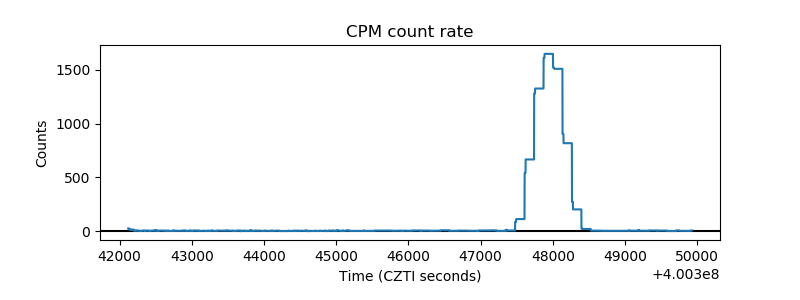 |
| CZT Counter | 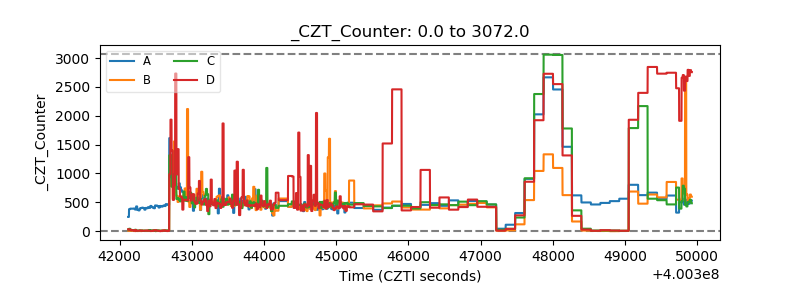 |
| +2.5 Volts monitor | 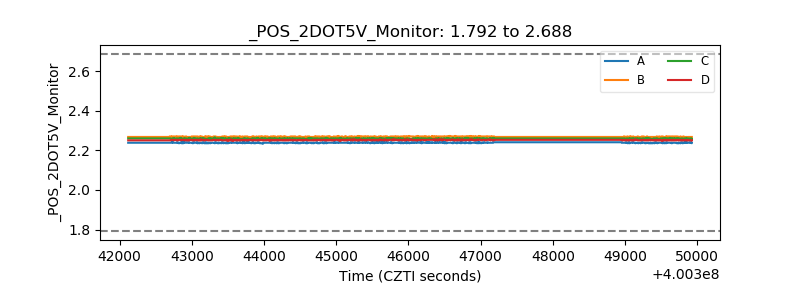 |
| +5 Volts monitor | 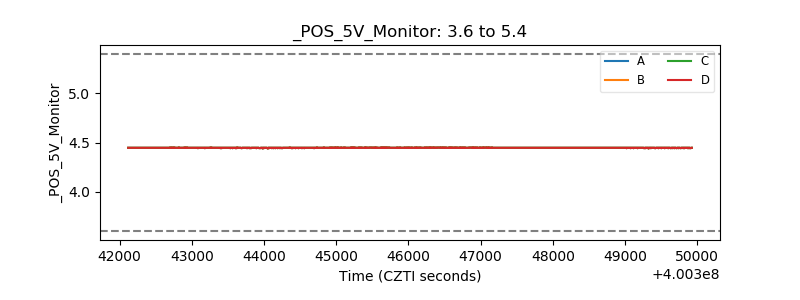 |
| _ROLL_ROT | 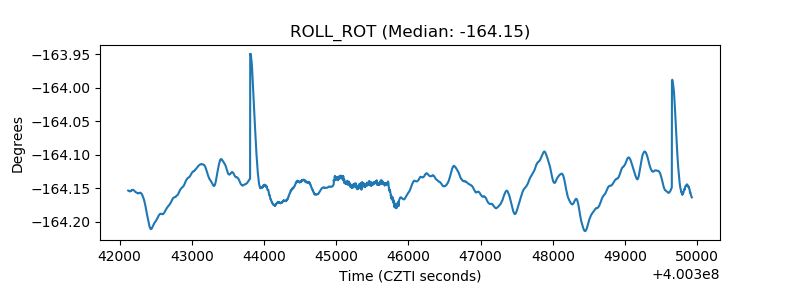 |
| _Roll_DEC | 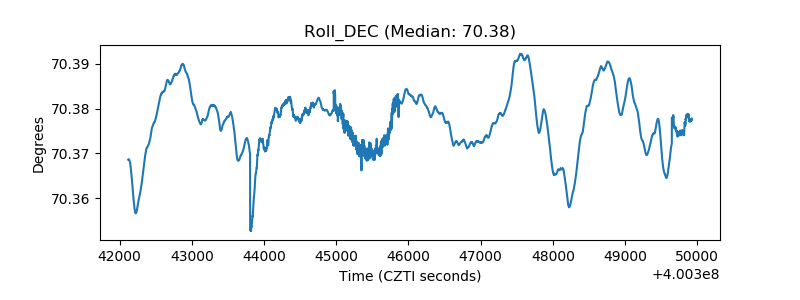 |
| _Roll_RA | 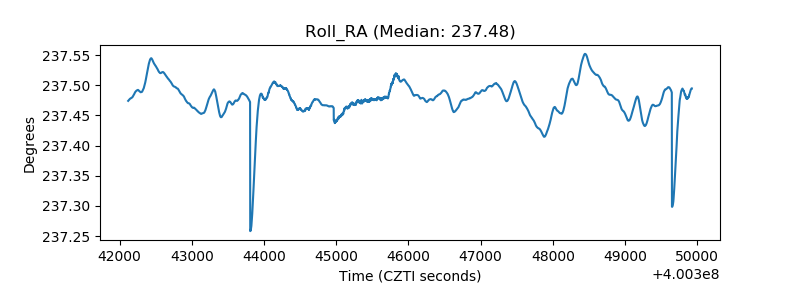 |
| Veto Counter | 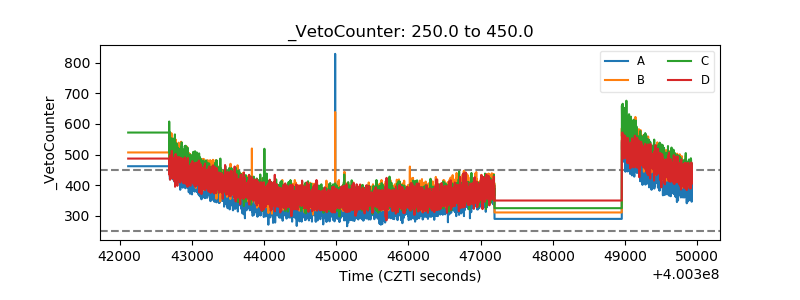 |