| Param | Original file | Final file |
|---|---|---|
| Filename | modeM0/AS1C07_001T11_9000005336_37562cztM0_level2.evt | modeM0/AS1C07_001T11_9000005336_37562cztM0_level2_quad_clean.evt |
| Size (bytes) | 659,134,080 | 88,168,320 |
| Size | 628.6 MB | 84.1 MB |
| Events in quadrant A | 2,524,624 | 647,273 |
| Events in quadrant B | 3,190,067 | 650,589 |
| Events in quadrant C | 2,772,222 | 647,761 |
| Events in quadrant D | 11,138,798 | 374,359 |
| Mode M0 | |||
|---|---|---|---|
| Quadrant | BADHDUFLAG | Total packets | Discarded packets |
| A | 0 | 10684 | 2 |
| B | 0 | 12818 | 1 |
| C | 0 | 11274 | 1 |
| D | 0 | 36534 | 1 |
| Mode M9 | |||
|---|---|---|---|
| Quadrant | BADHDUFLAG | Total packets | Discarded packets |
| A | 0 | 20 | 0 |
| B | 0 | 20 | 0 |
| C | 0 | 20 | 0 |
| D | 0 | 20 | 0 |
| Mode SS | |||
|---|---|---|---|
| Quadrant | BADHDUFLAG | Total packets | Discarded packets |
| A | 0 | 100 | 0 |
| B | 0 | 100 | 0 |
| C | 0 | 100 | 0 |
| D | 0 | 100 | 0 |
| Quadrant | Total seconds | Saturated seconds | Saturation percentage |
|---|---|---|---|
| A | 4974 | 12 | 0.241255% |
| B | 4974 | 95 | 1.909932% |
| C | 4974 | 91 | 1.829513% |
| D | 4974 | 3529 | 70.948934% |
Noise dominated data is calculated using 1-second bins in cleaned event files. If a bin has >2000 counts, and if more than 50% of those come from <1% of pixels, then it is considered to be noise-dominated and hence unusable.
| Quadrant | # 1 sec bins | Bins with >0 counts | Bins with >2000 counts | High rate bins dominated by noise | Noise dominated (total time) | Noise dominated (detector-on time) | Marked lightcurve |
|---|---|---|---|---|---|---|---|
| A | 6887 | 4975 | 7 | 7 | 0.10% | 0.14% | 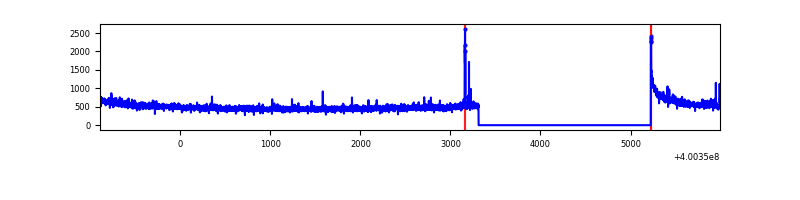 |
| B | 6887 | 4975 | 62 | 62 | 0.90% | 1.25% | 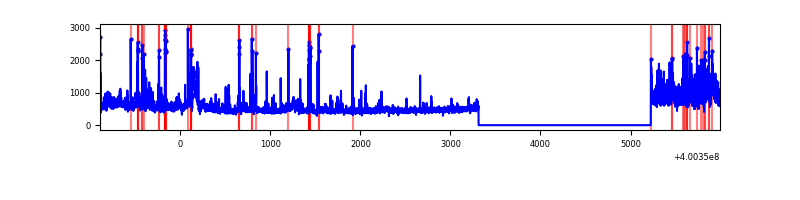 |
| C | 6887 | 4975 | 72 | 72 | 1.05% | 1.45% | 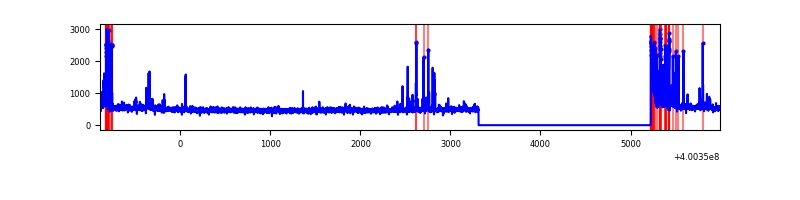 |
| D | 6886 | 4973 | 3668 | 3668 | 53.27% | 73.76% | 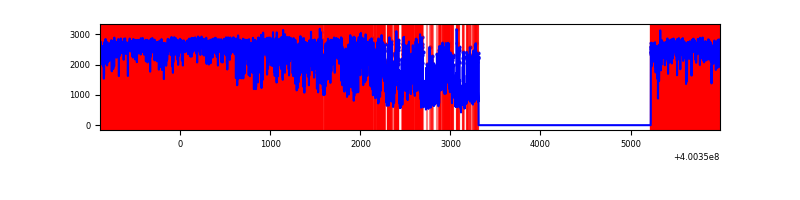 |
Top three noisy pixels from each quadrant. If the there are fewer than three noisy pixels in the level2.evt file, extra rows are filled as -1
| Pixel properties | Quadrant properties | ||||||
|---|---|---|---|---|---|---|---|
| Quadrant | DetID | PixID | Counts | Sigma | Mean | Median | Sigma |
| A | 10 | 83 | 277924 | 2414.2 | 565 | 553 | 114.9 |
| A | 9 | 143 | 26022 | 221.68 | 565 | 553 | 114.9 |
| A | 12 | 189 | 14981 | 125.58 | 565 | 553 | 114.9 |
| B | 0 | 189 | 237027 | 2238.66 | 565 | 549 | 105.6 |
| B | 5 | 172 | 160513 | 1514.32 | 565 | 549 | 105.6 |
| B | 0 | 213 | 97414 | 916.99 | 565 | 549 | 105.6 |
| C | 14 | 254 | 298205 | 2295.46 | 559 | 563 | 129.7 |
| C | 15 | 214 | 224367 | 1726.01 | 559 | 563 | 129.7 |
| C | 0 | 10 | 56806 | 433.75 | 559 | 563 | 129.7 |
| D | 12 | 235 | 8765647 | 93548.73 | 375 | 363 | 93.7 |
| D | 2 | 249 | 336885 | 3591.58 | 375 | 363 | 93.7 |
| D | 12 | 233 | 214707 | 2287.62 | 375 | 363 | 93.7 |
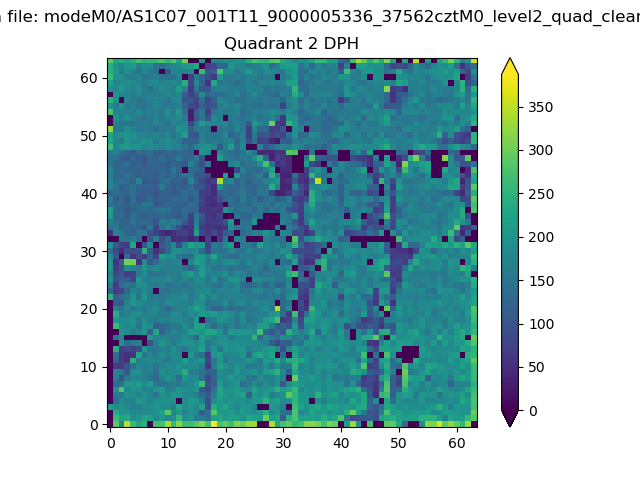
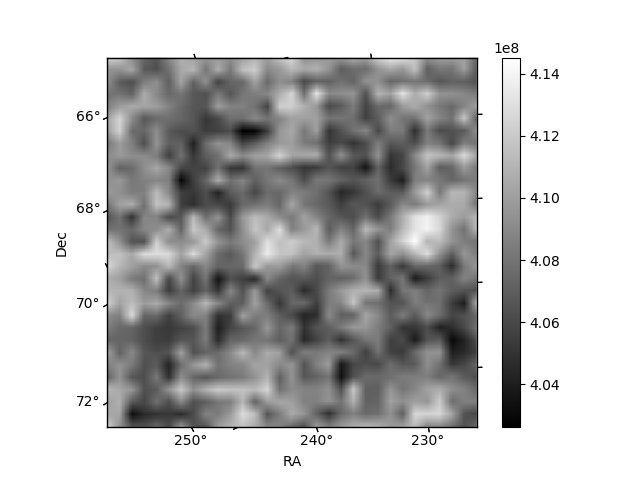
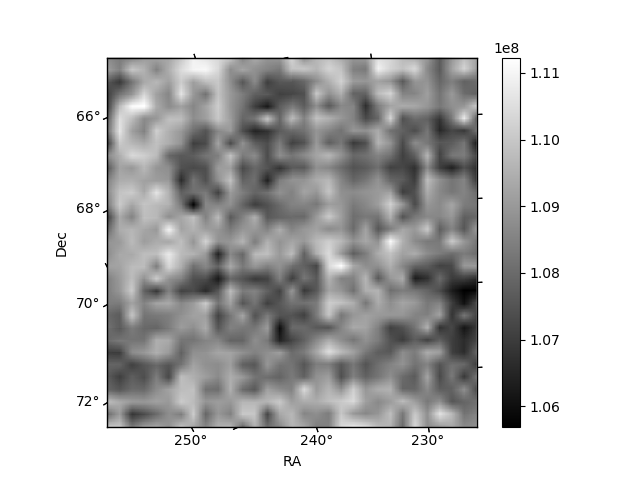
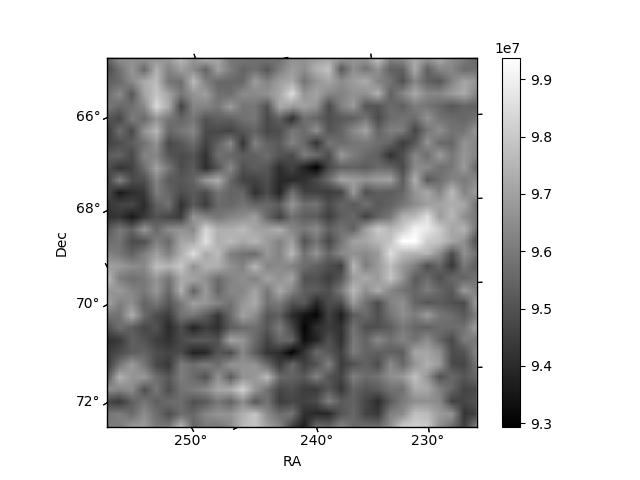
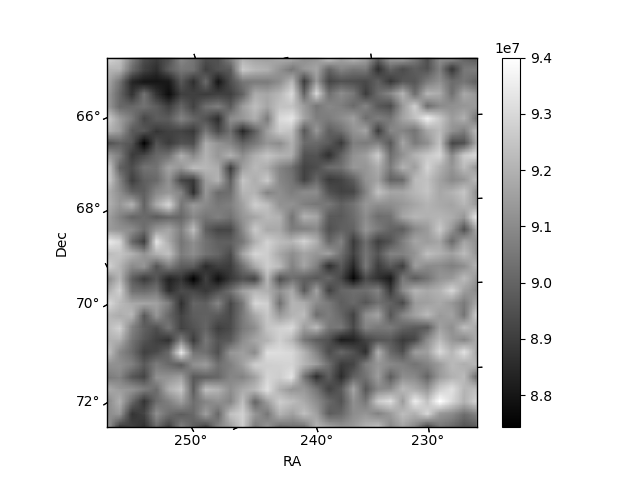
Histogram calculated using DETX and DETY for each event in the final _common_clean file
| Quadrant A | 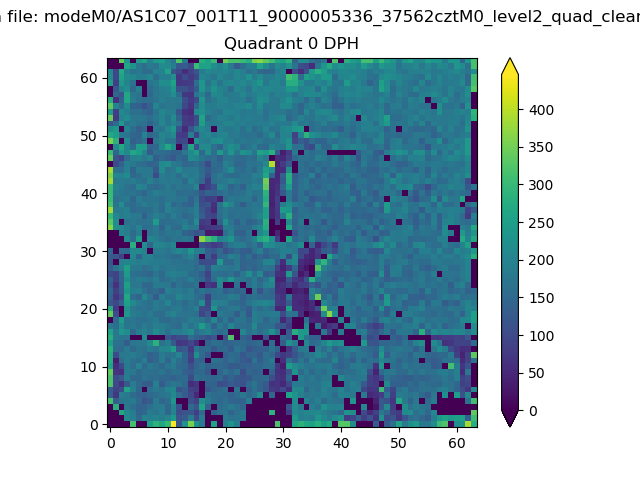 |
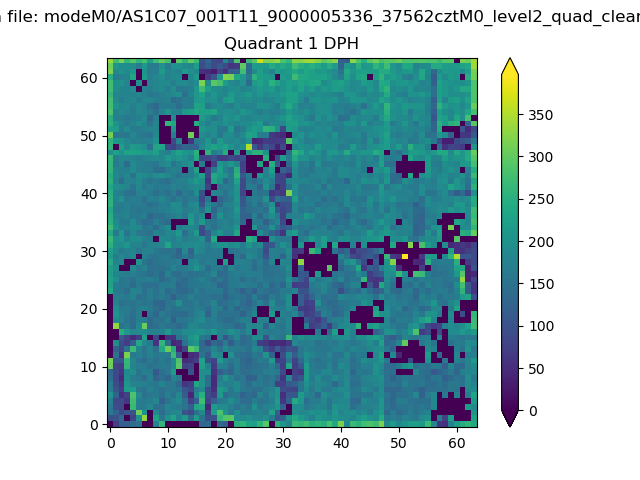 |
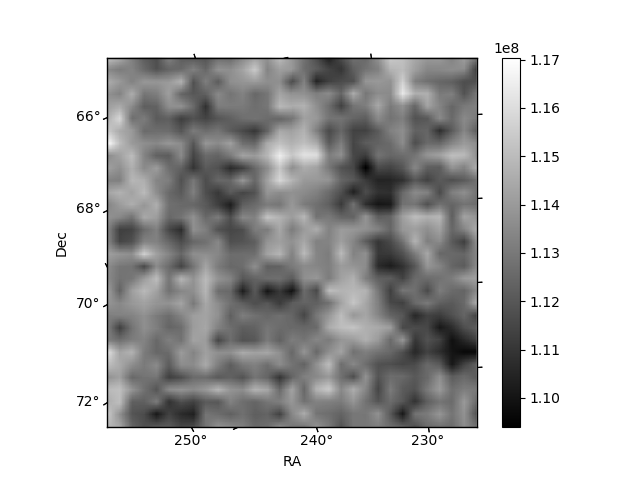
Quadrant B |
|---|---|---|---|
| Quadrant D | 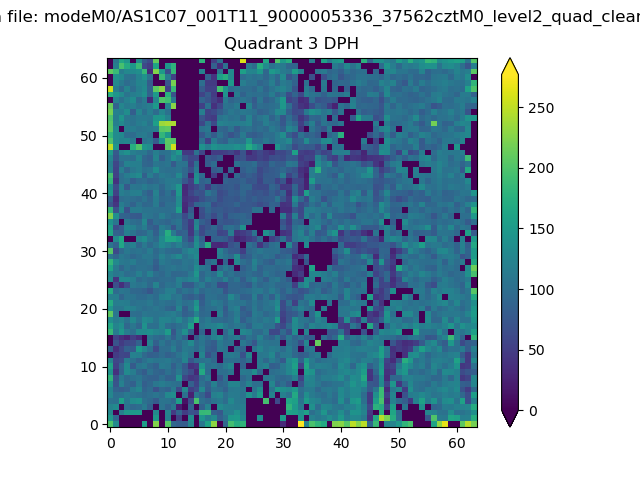 |
 |
Quadrant C |
| Plot type | Count rate plots | Images |
|---|---|---|
| Comparison with Poisson distribution Blue bars denote a histogram of data divided into 1 sec bins. Red curve is a Poisson curve with rate = median count rate of data. |
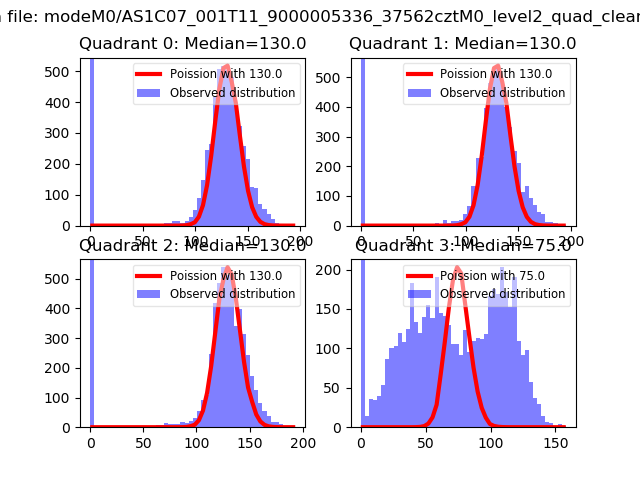 |
 |
| Quadrant-wise count rates Data is divided into 100 sec bins |
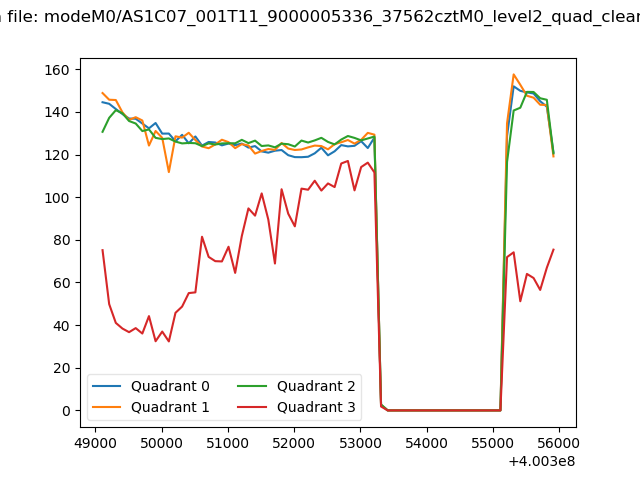 |
|
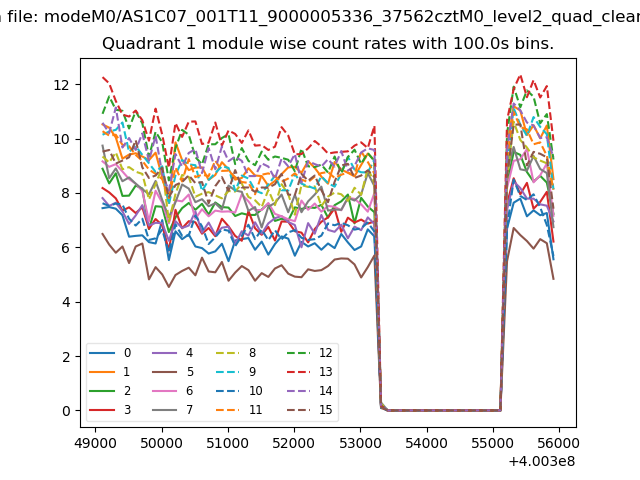
| Module-wise count rates for Quadrant A Data is divided into 100 sec bins |
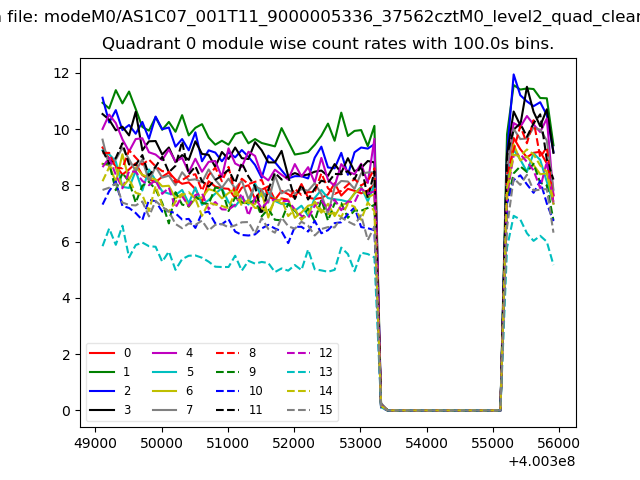 |
 |
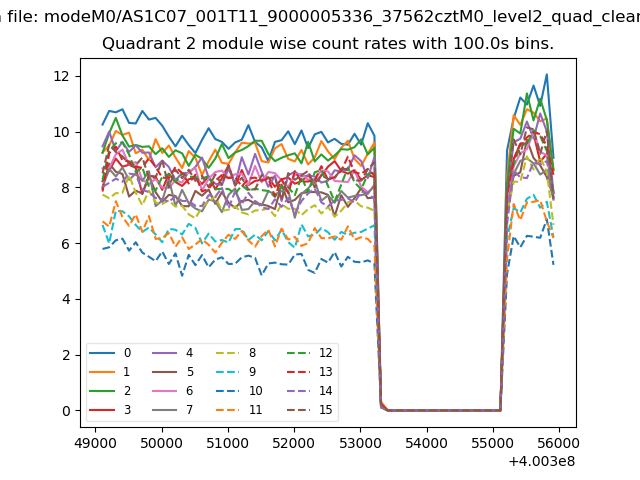
| Module-wise count rates for Quadrant B Data is divided into 100 sec bins |
 |
 |
| Module-wise count rates for Quadrant C Data is divided into 100 sec bins |
 |
 |
| Module-wise count rates for Quadrant D Data is divided into 100 sec bins |
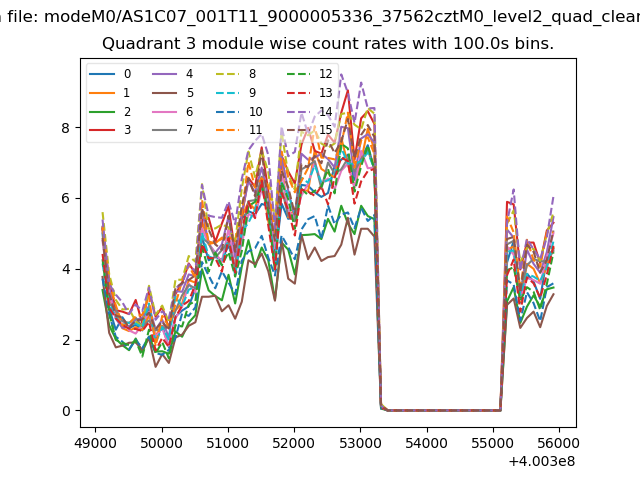 |
 |
| Parameter | Plot |
|---|---|
| CZT HV Monitor | 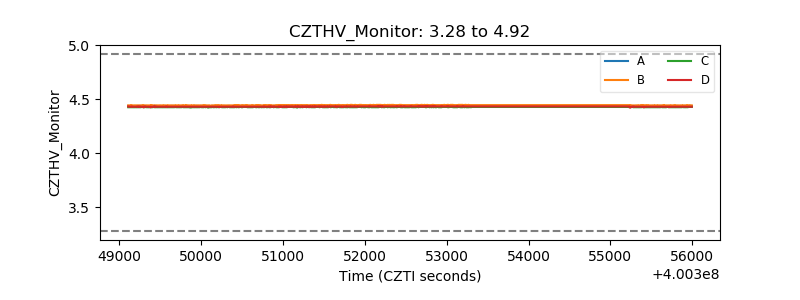 |
| D_VDD | 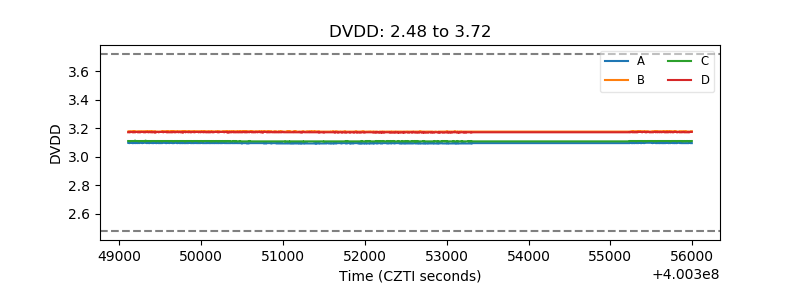 |
| Temperature 1 | 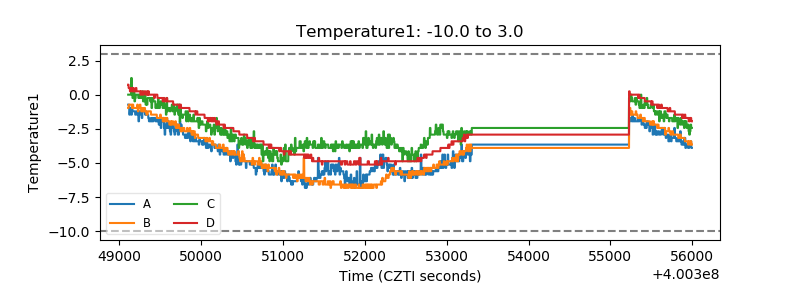 |
| Veto HV Monitor | 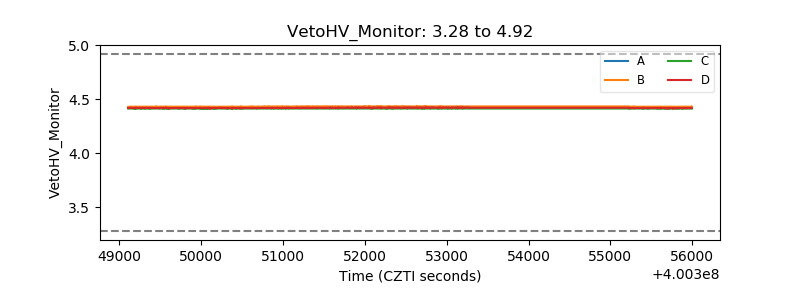 |
| Veto LLD | 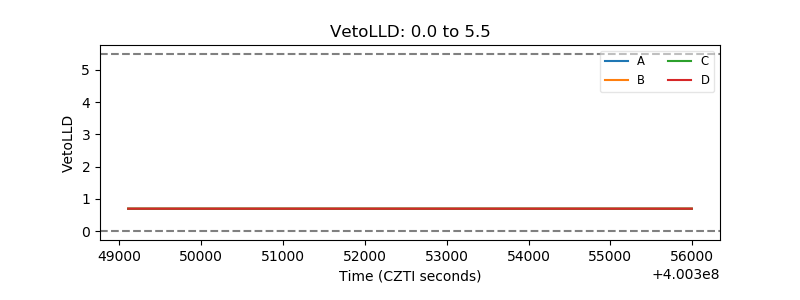 |
| Alpha Counter | 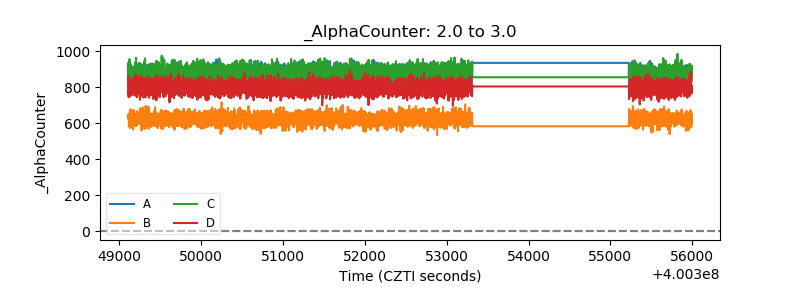 |
| _CPM_Rate | 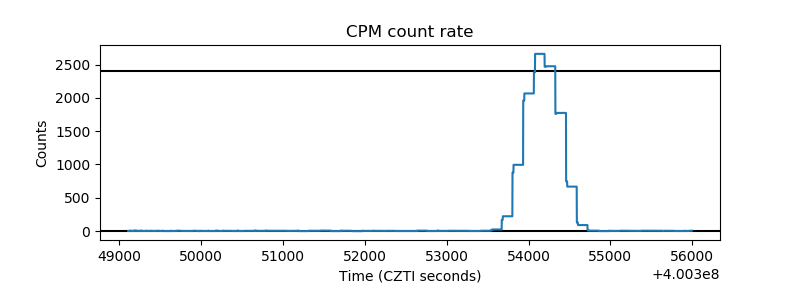 |
| CZT Counter | 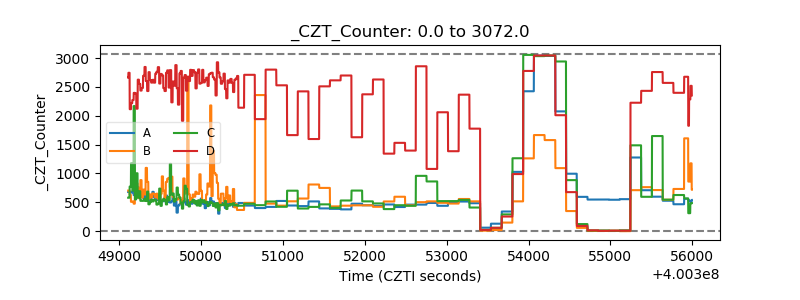 |
| +2.5 Volts monitor | 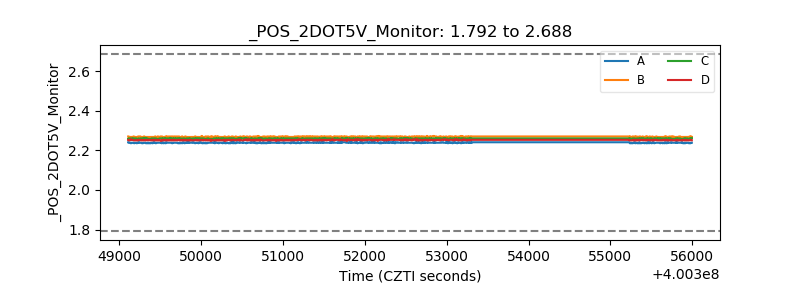 |
| +5 Volts monitor | 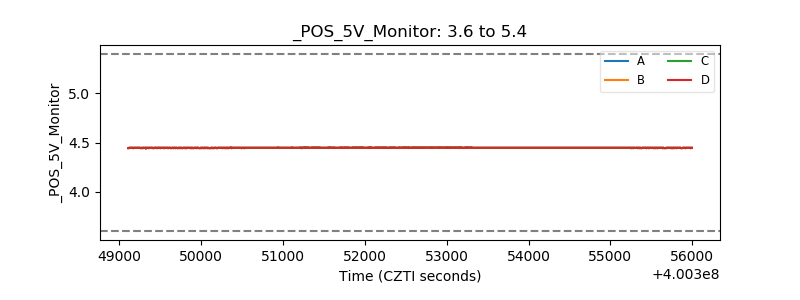 |
| _ROLL_ROT | 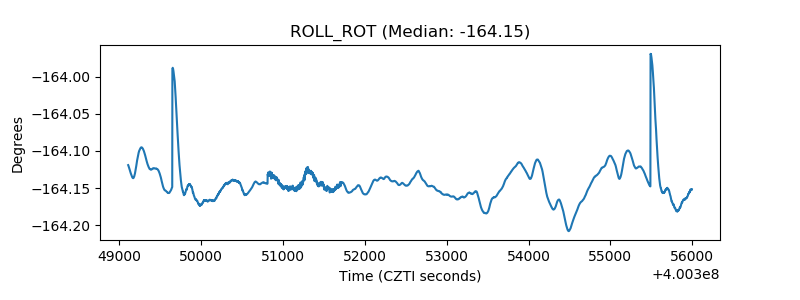 |
| _Roll_DEC | 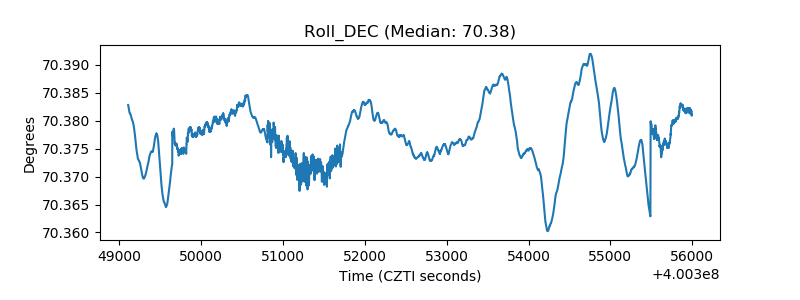 |
| _Roll_RA | 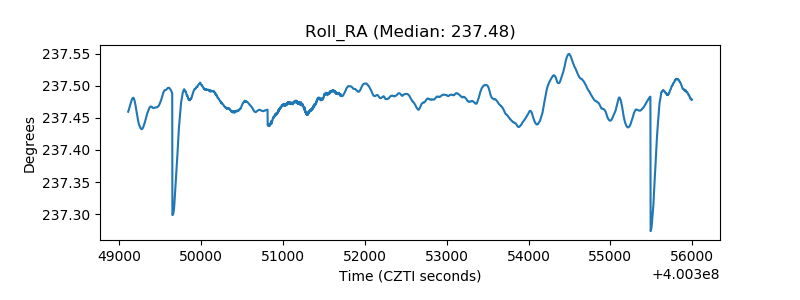 |
| Veto Counter | 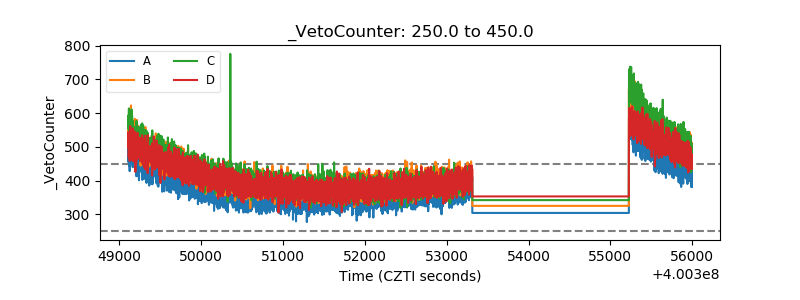 |