| Param | Original file | Final file |
|---|---|---|
| Filename | modeM0/AS1C07_001T11_9000005336_37563cztM0_level2.evt | modeM0/AS1C07_001T11_9000005336_37563cztM0_level2_quad_clean.evt |
| Size (bytes) | 610,387,200 | 92,946,240 |
| Size | 582.1 MB | 88.6 MB |
| Events in quadrant A | 2,626,258 | 658,700 |
| Events in quadrant B | 3,188,469 | 663,541 |
| Events in quadrant C | 2,809,845 | 673,394 |
| Events in quadrant D | 9,528,209 | 473,012 |
| Mode M0 | |||
|---|---|---|---|
| Quadrant | BADHDUFLAG | Total packets | Discarded packets |
| A | 0 | 10950 | 3 |
| B | 0 | 12721 | 2 |
| C | 0 | 11305 | 2 |
| D | 0 | 31717 | 2 |
| Mode M9 | |||
|---|---|---|---|
| Quadrant | BADHDUFLAG | Total packets | Discarded packets |
| A | 0 | 25 | 0 |
| B | 0 | 25 | 0 |
| C | 0 | 25 | 0 |
| D | 0 | 26 | 0 |
| Mode SS | |||
|---|---|---|---|
| Quadrant | BADHDUFLAG | Total packets | Discarded packets |
| A | 0 | 100 | 0 |
| B | 0 | 100 | 0 |
| C | 0 | 100 | 0 |
| D | 0 | 100 | 0 |
| Quadrant | Total seconds | Saturated seconds | Saturation percentage |
|---|---|---|---|
| A | 4920 | 28 | 0.569106% |
| B | 4920 | 149 | 3.028455% |
| C | 4920 | 103 | 2.093496% |
| D | 4920 | 2526 | 51.341463% |
Noise dominated data is calculated using 1-second bins in cleaned event files. If a bin has >2000 counts, and if more than 50% of those come from <1% of pixels, then it is considered to be noise-dominated and hence unusable.
| Quadrant | # 1 sec bins | Bins with >0 counts | Bins with >2000 counts | High rate bins dominated by noise | Noise dominated (total time) | Noise dominated (detector-on time) | Marked lightcurve |
|---|---|---|---|---|---|---|---|
| A | 6953 | 4921 | 21 | 21 | 0.30% | 0.43% | 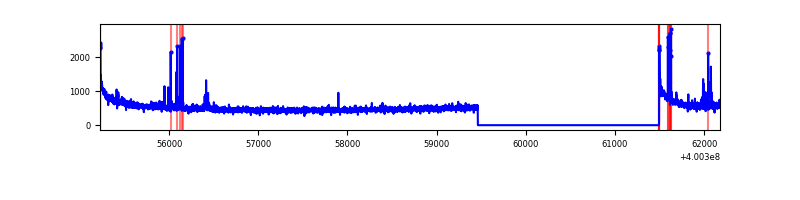 |
| B | 6953 | 4921 | 73 | 73 | 1.05% | 1.48% | 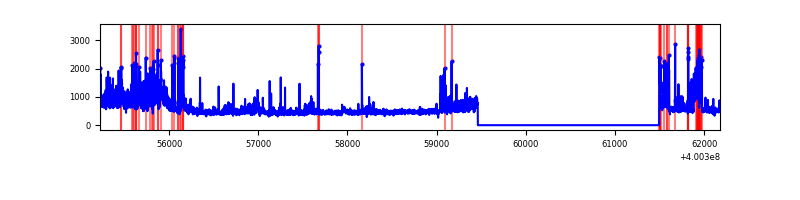 |
| C | 6953 | 4921 | 83 | 83 | 1.19% | 1.69% | 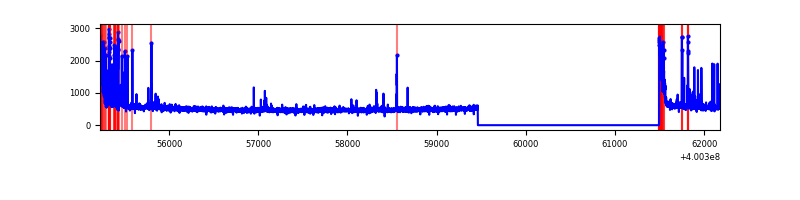 |
| D | 6952 | 4920 | 2693 | 2693 | 38.74% | 54.74% | 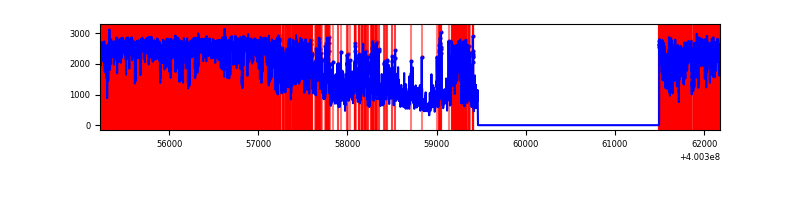 |
Top three noisy pixels from each quadrant. If the there are fewer than three noisy pixels in the level2.evt file, extra rows are filled as -1
| Pixel properties | Quadrant properties | ||||||
|---|---|---|---|---|---|---|---|
| Quadrant | DetID | PixID | Counts | Sigma | Mean | Median | Sigma |
| A | 10 | 83 | 314071 | 2752.1 | 567 | 555 | 113.9 |
| A | 13 | 248 | 40387 | 349.65 | 567 | 555 | 113.9 |
| A | 4 | 0 | 32523 | 280.62 | 567 | 555 | 113.9 |
| B | 0 | 189 | 270912 | 2569.14 | 568 | 553 | 105.2 |
| B | 5 | 172 | 193956 | 1837.85 | 568 | 553 | 105.2 |
| B | 0 | 213 | 100377 | 948.6 | 568 | 553 | 105.2 |
| C | 15 | 214 | 224083 | 1719.84 | 566 | 571 | 130.0 |
| C | 14 | 254 | 215841 | 1656.42 | 566 | 571 | 130.0 |
| C | 0 | 10 | 150540 | 1153.95 | 566 | 571 | 130.0 |
| D | 12 | 235 | 6919223 | 61589.5 | 449 | 436 | 112.3 |
| D | 2 | 249 | 423601 | 3766.92 | 449 | 436 | 112.3 |
| D | 13 | 249 | 117528 | 1042.33 | 449 | 436 | 112.3 |
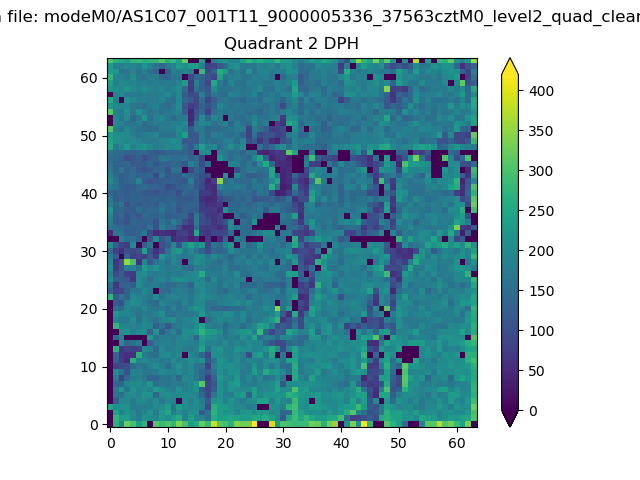
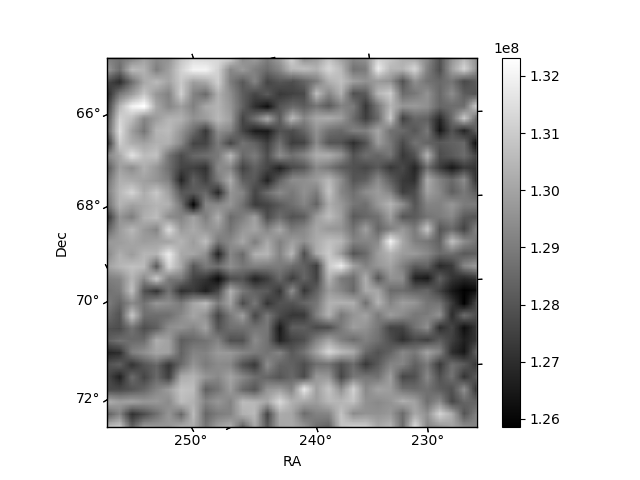
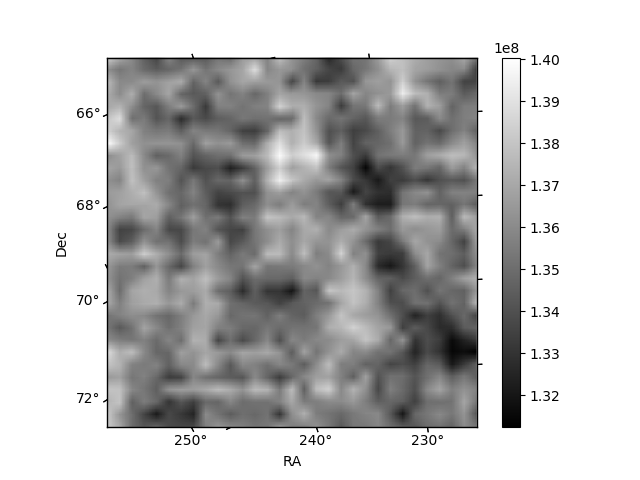
Histogram calculated using DETX and DETY for each event in the final _common_clean file
| Quadrant A | 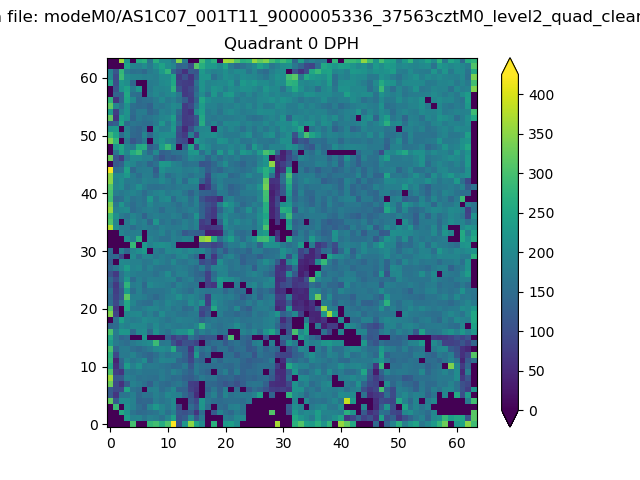 |
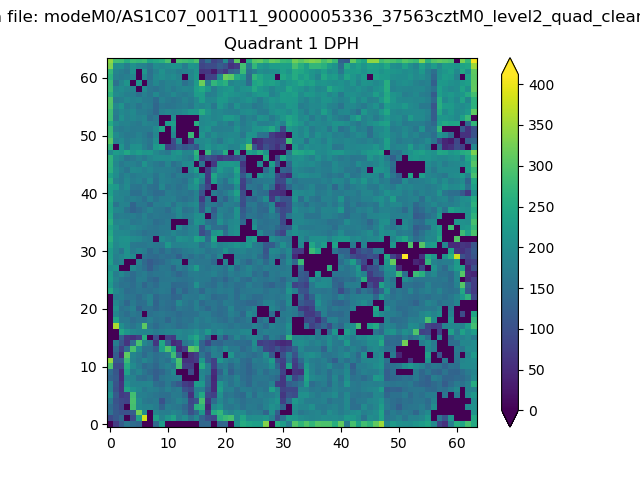 |
Quadrant B |
|---|---|---|---|
| Quadrant D | 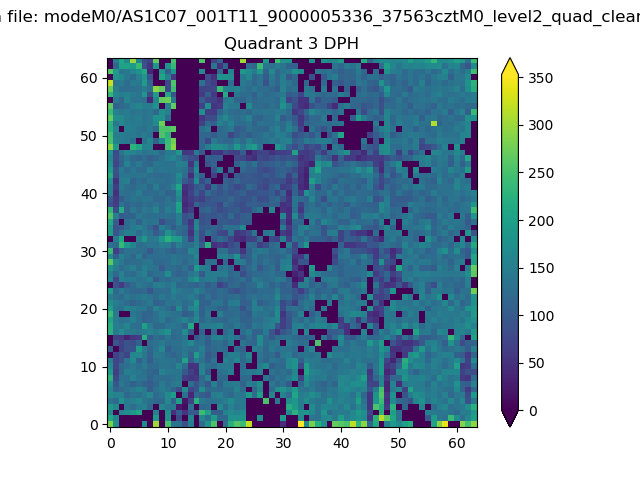 |
 |
Quadrant C |
| Plot type | Count rate plots | Images |
|---|---|---|
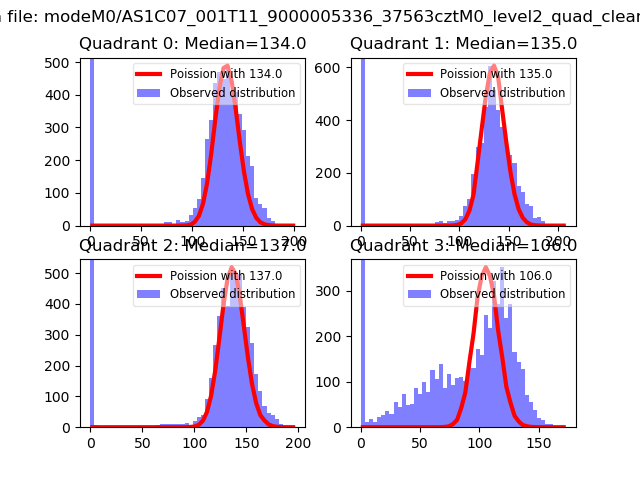
| Comparison with Poisson distribution Blue bars denote a histogram of data divided into 1 sec bins. Red curve is a Poisson curve with rate = median count rate of data. |
 |
 |
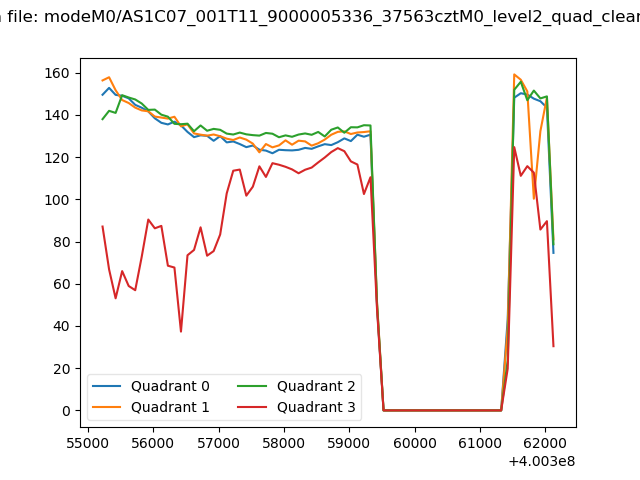
| Quadrant-wise count rates Data is divided into 100 sec bins |
 |
|
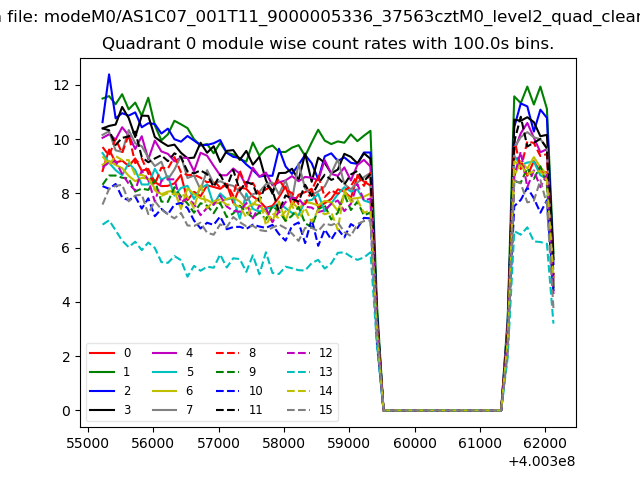
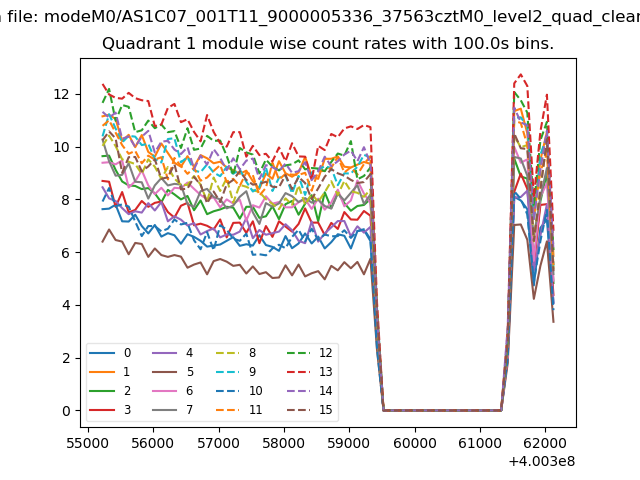
| Module-wise count rates for Quadrant A Data is divided into 100 sec bins |
 |
 |
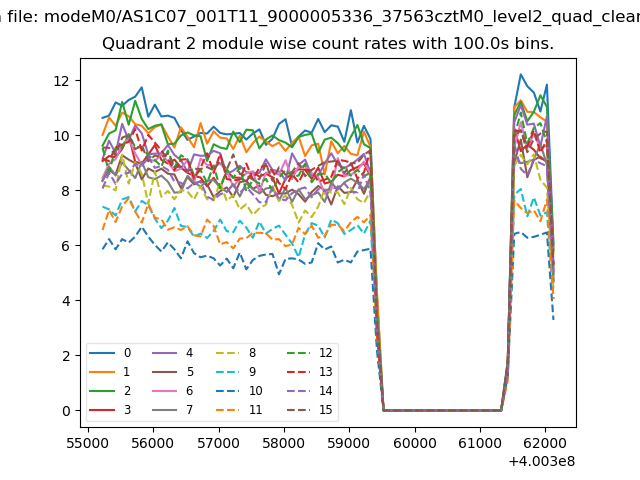
| Module-wise count rates for Quadrant B Data is divided into 100 sec bins |
 |
 |
| Module-wise count rates for Quadrant C Data is divided into 100 sec bins |
 |
 |
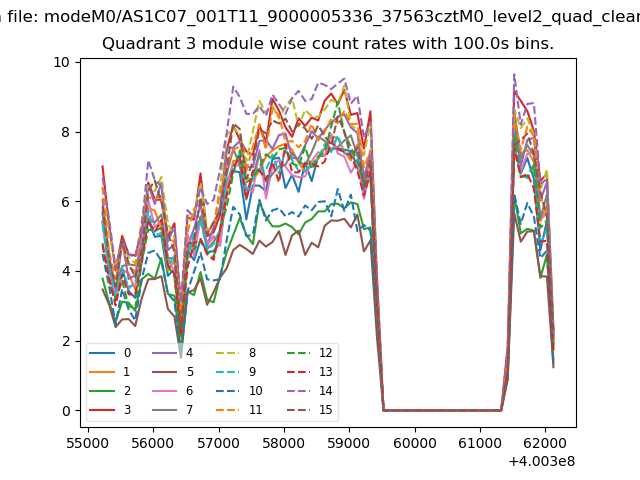
| Module-wise count rates for Quadrant D Data is divided into 100 sec bins |
 |
 |
| Parameter | Plot |
|---|---|
| CZT HV Monitor | 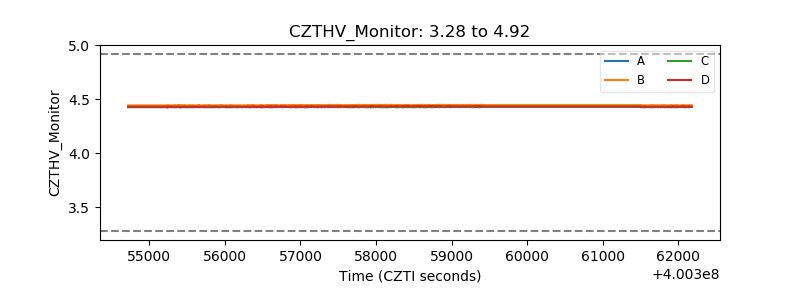 |
| D_VDD | 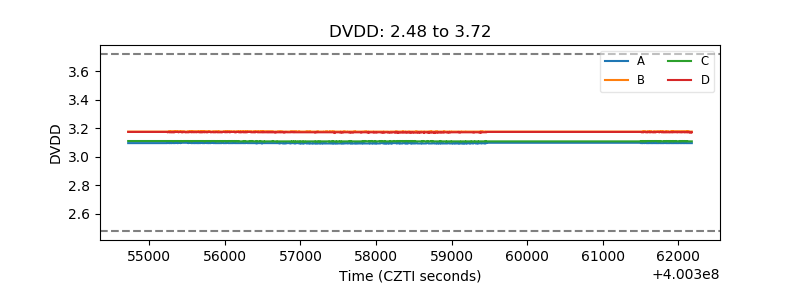 |
| Temperature 1 | 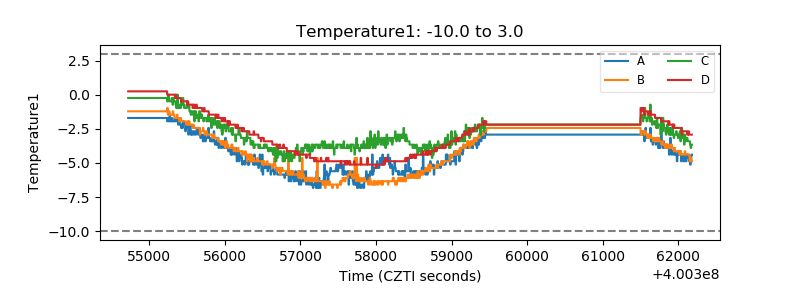 |
| Veto HV Monitor | 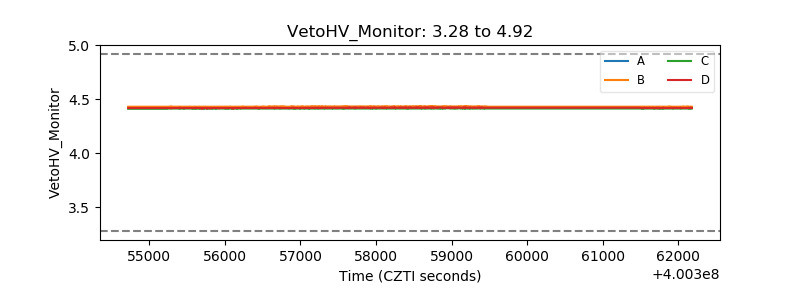 |
| Veto LLD | 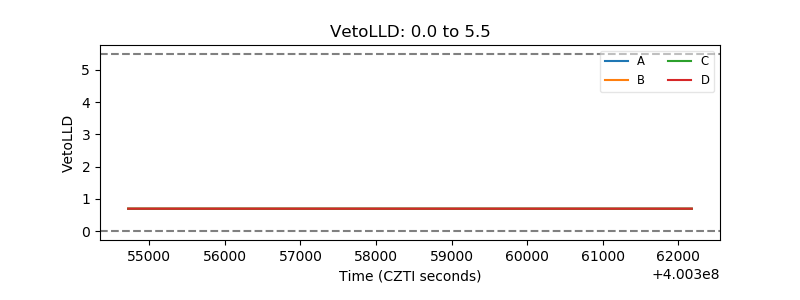 |
| Alpha Counter | 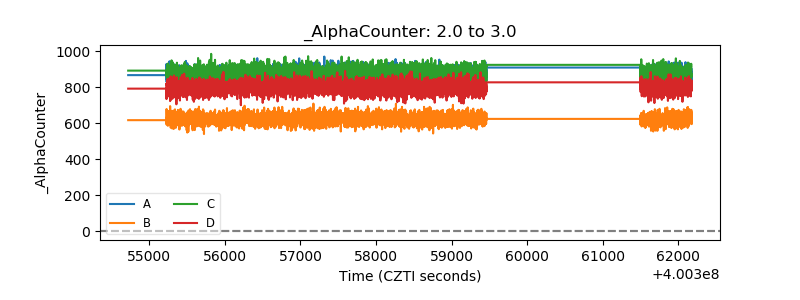 |
| _CPM_Rate | 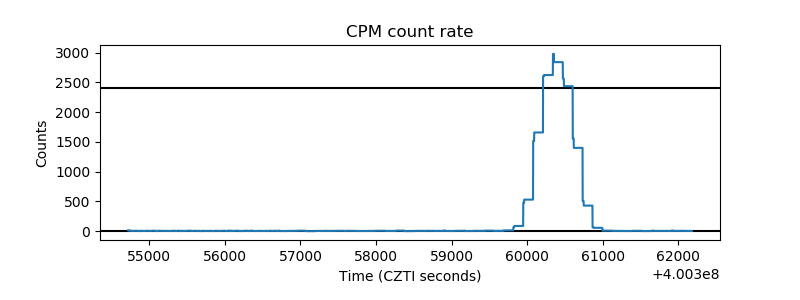 |
| CZT Counter | 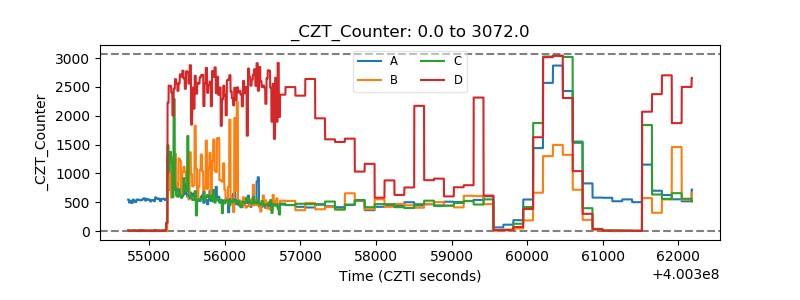 |
| +2.5 Volts monitor | 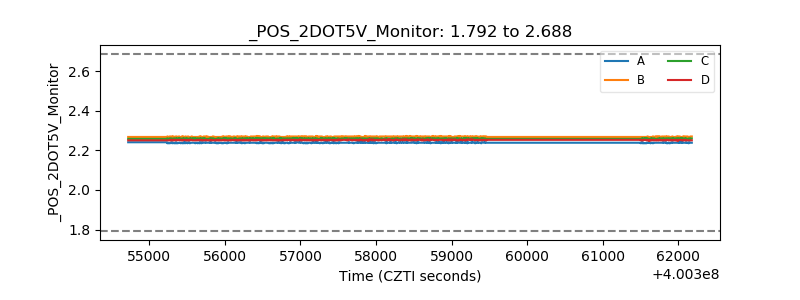 |
| +5 Volts monitor | 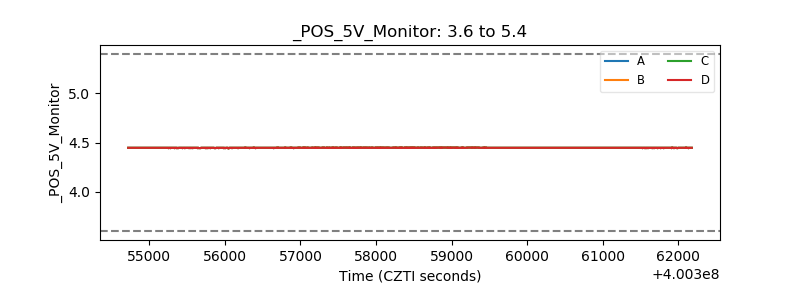 |
| _ROLL_ROT | 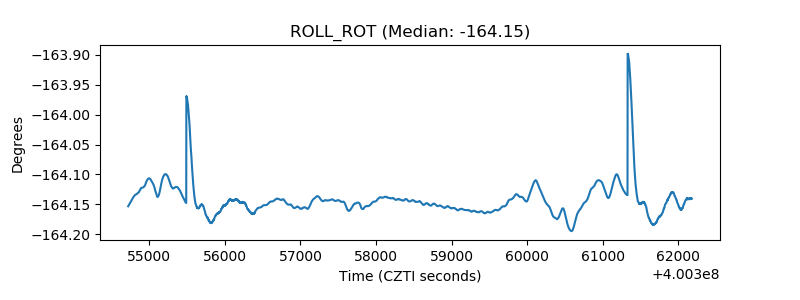 |
| _Roll_DEC | 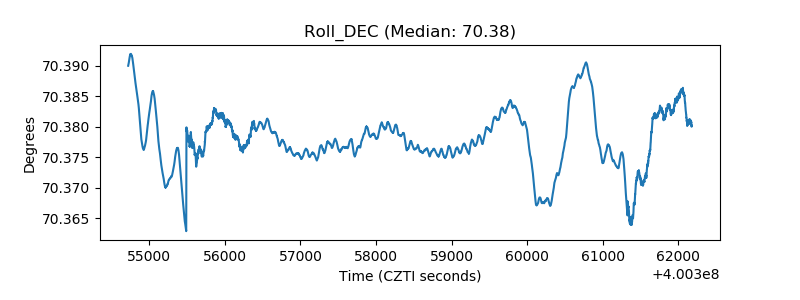 |
| _Roll_RA | 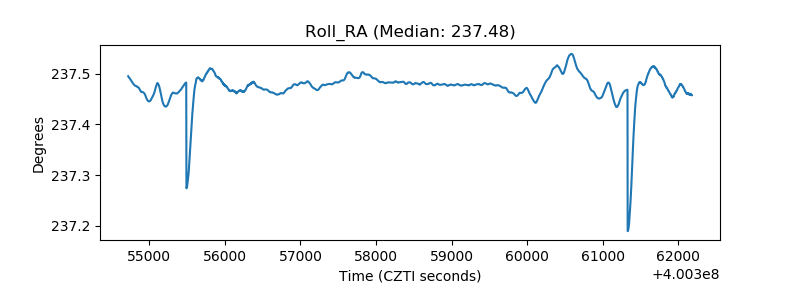 |
| Veto Counter | 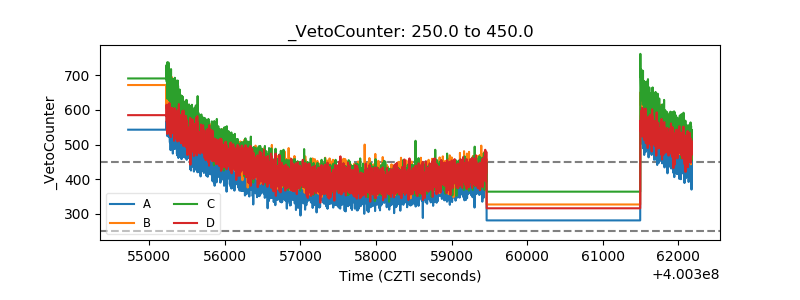 |