| Param | Original file | Final file |
|---|---|---|
| Filename | modeM0/AS1C07_001T11_9000005336_37564cztM0_level2.evt | modeM0/AS1C07_001T11_9000005336_37564cztM0_level2_quad_clean.evt |
| Size (bytes) | 446,817,600 | 94,530,240 |
| Size | 426.1 MB | 90.2 MB |
| Events in quadrant A | 2,570,747 | 637,552 |
| Events in quadrant B | 2,725,924 | 655,433 |
| Events in quadrant C | 2,815,532 | 658,558 |
| Events in quadrant D | 5,092,806 | 573,191 |
| Mode M0 | |||
|---|---|---|---|
| Quadrant | BADHDUFLAG | Total packets | Discarded packets |
| A | 0 | 10698 | 3 |
| B | 0 | 11183 | 2 |
| C | 0 | 11231 | 2 |
| D | 0 | 18428 | 2 |
| Mode M9 | |||
|---|---|---|---|
| Quadrant | BADHDUFLAG | Total packets | Discarded packets |
| A | 0 | 32 | 0 |
| B | 0 | 32 | 0 |
| C | 0 | 32 | 0 |
| D | 0 | 33 | 0 |
| Mode SS | |||
|---|---|---|---|
| Quadrant | BADHDUFLAG | Total packets | Discarded packets |
| A | 0 | 100 | 0 |
| B | 0 | 100 | 0 |
| C | 0 | 100 | 0 |
| D | 0 | 100 | 0 |
| Quadrant | Total seconds | Saturated seconds | Saturation percentage |
|---|---|---|---|
| A | 4808 | 27 | 0.561564% |
| B | 4808 | 125 | 2.599834% |
| C | 4808 | 108 | 2.246256% |
| D | 4808 | 856 | 17.803661% |
Noise dominated data is calculated using 1-second bins in cleaned event files. If a bin has >2000 counts, and if more than 50% of those come from <1% of pixels, then it is considered to be noise-dominated and hence unusable.
| Quadrant | # 1 sec bins | Bins with >0 counts | Bins with >2000 counts | High rate bins dominated by noise | Noise dominated (total time) | Noise dominated (detector-on time) | Marked lightcurve |
|---|---|---|---|---|---|---|---|
| A | 6929 | 4809 | 22 | 22 | 0.32% | 0.46% | 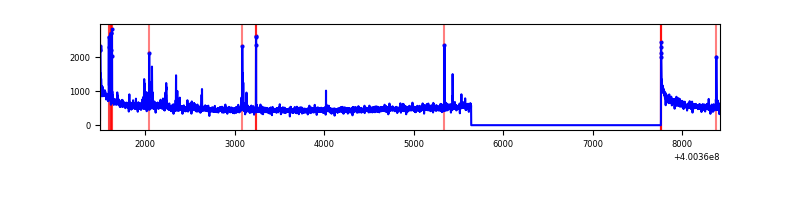 |
| B | 6929 | 4809 | 64 | 64 | 0.92% | 1.33% | 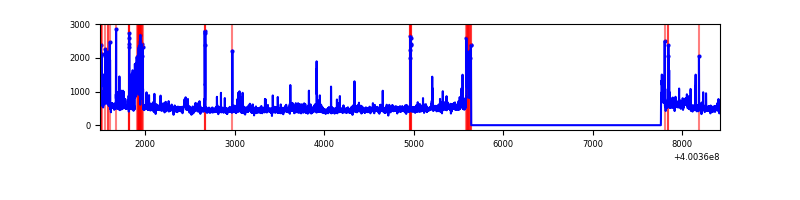 |
| C | 6929 | 4809 | 103 | 103 | 1.49% | 2.14% | 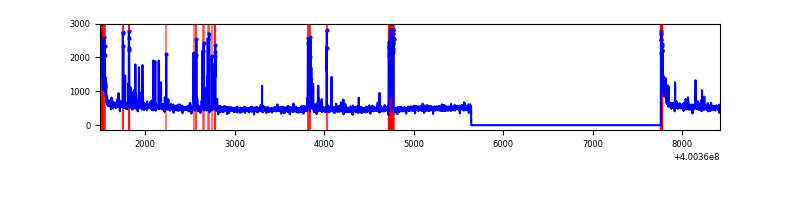 |
| D | 6929 | 4809 | 900 | 900 | 12.99% | 18.71% | 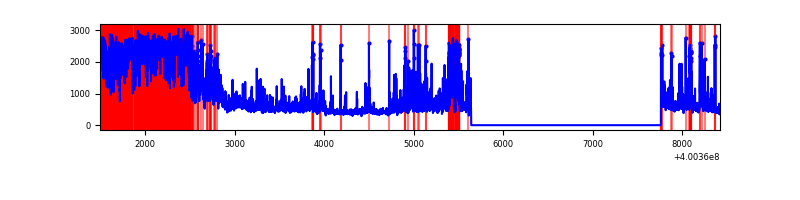 |
Top three noisy pixels from each quadrant. If the there are fewer than three noisy pixels in the level2.evt file, extra rows are filled as -1
| Pixel properties | Quadrant properties | ||||||
|---|---|---|---|---|---|---|---|
| Quadrant | DetID | PixID | Counts | Sigma | Mean | Median | Sigma |
| A | 10 | 83 | 299416 | 2685.46 | 550 | 540 | 111.3 |
| A | 9 | 143 | 47064 | 418.03 | 550 | 540 | 111.3 |
| A | 4 | 0 | 34992 | 309.56 | 550 | 540 | 111.3 |
| B | 5 | 172 | 156074 | 1498.05 | 553 | 539 | 103.8 |
| B | 5 | 255 | 65412 | 624.83 | 553 | 539 | 103.8 |
| B | 0 | 155 | 51657 | 492.35 | 553 | 539 | 103.8 |
| C | 14 | 254 | 292845 | 2308.34 | 548 | 552 | 126.6 |
| C | 15 | 214 | 220321 | 1735.59 | 548 | 552 | 126.6 |
| C | 0 | 10 | 157128 | 1236.53 | 548 | 552 | 126.6 |
| D | 12 | 235 | 2147282 | 17218.34 | 507 | 493 | 124.7 |
| D | 2 | 249 | 309136 | 2475.47 | 507 | 493 | 124.7 |
| D | 2 | 153 | 117370 | 937.41 | 507 | 493 | 124.7 |
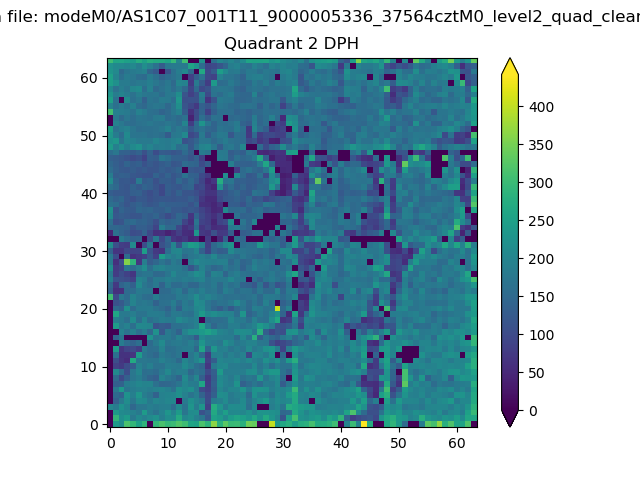
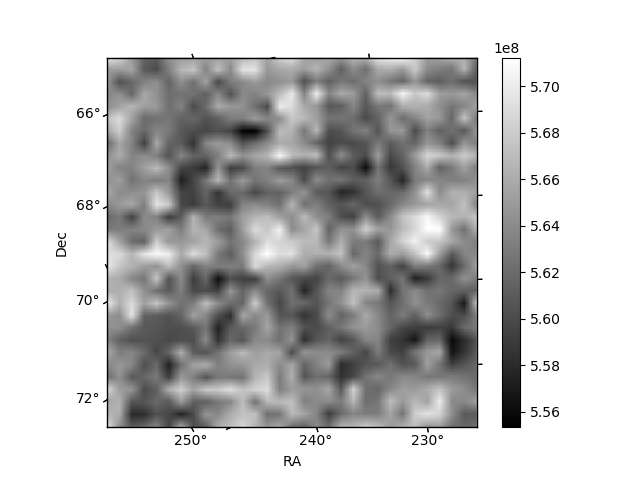
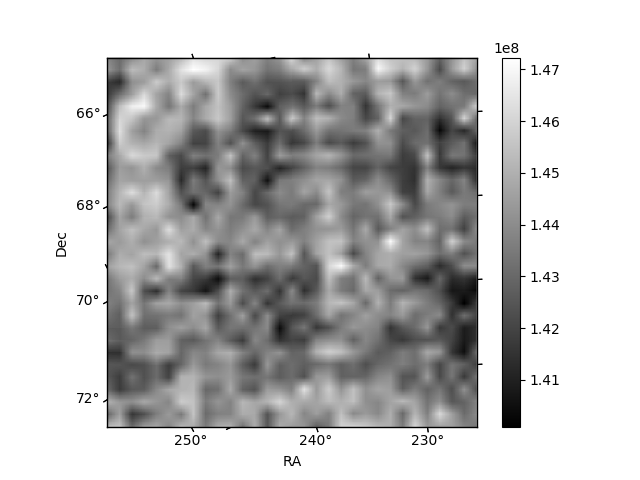
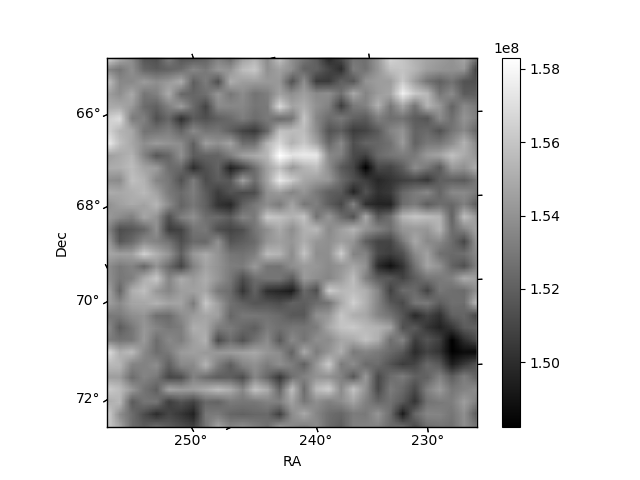
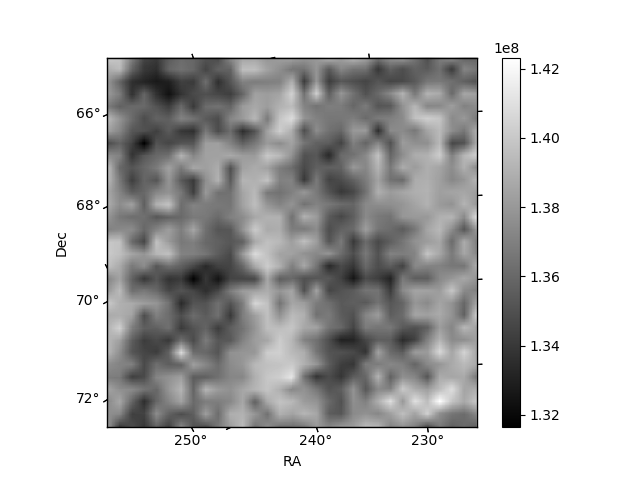
Histogram calculated using DETX and DETY for each event in the final _common_clean file
| Quadrant A | 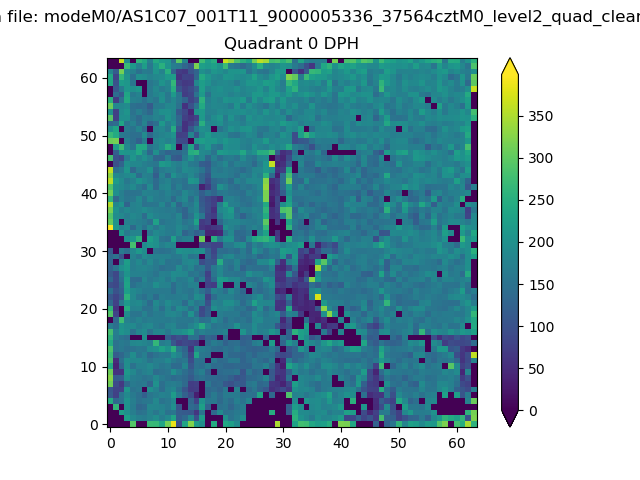 |
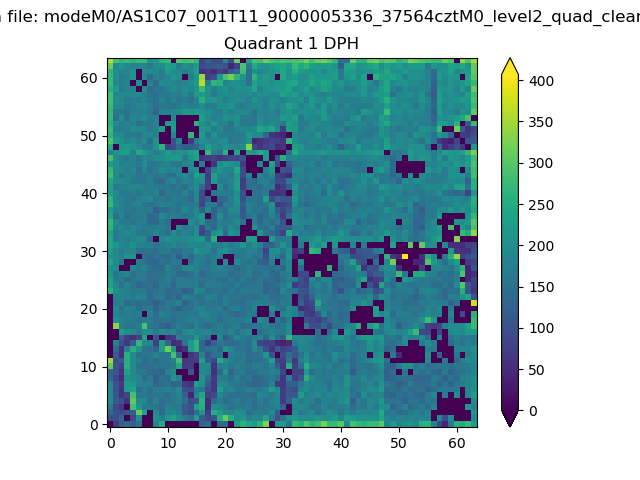 |
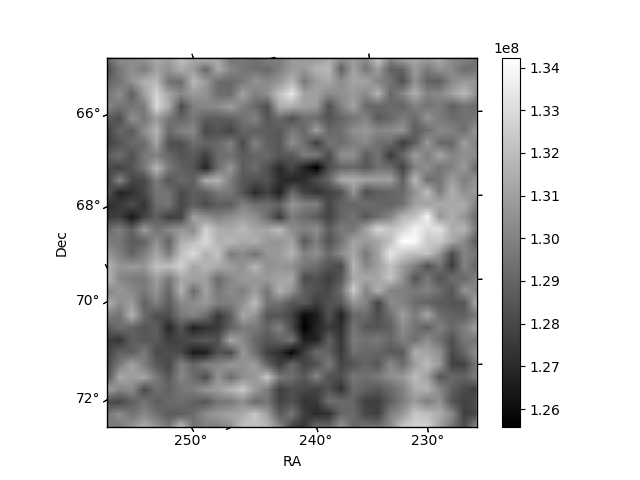
Quadrant B |
|---|---|---|---|
| Quadrant D | 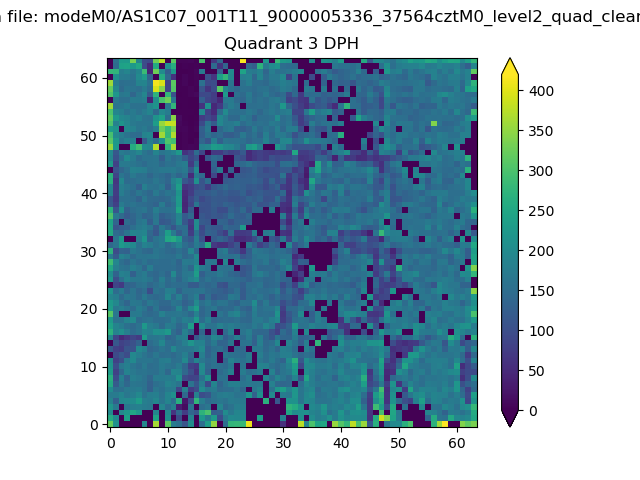 |
 |
Quadrant C |
| Plot type | Count rate plots | Images |
|---|---|---|
| Comparison with Poisson distribution Blue bars denote a histogram of data divided into 1 sec bins. Red curve is a Poisson curve with rate = median count rate of data. |
 |
 |
| Quadrant-wise count rates Data is divided into 100 sec bins |
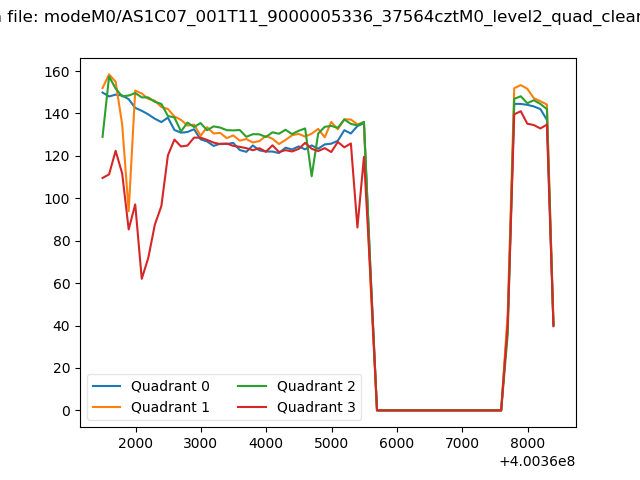 |
|
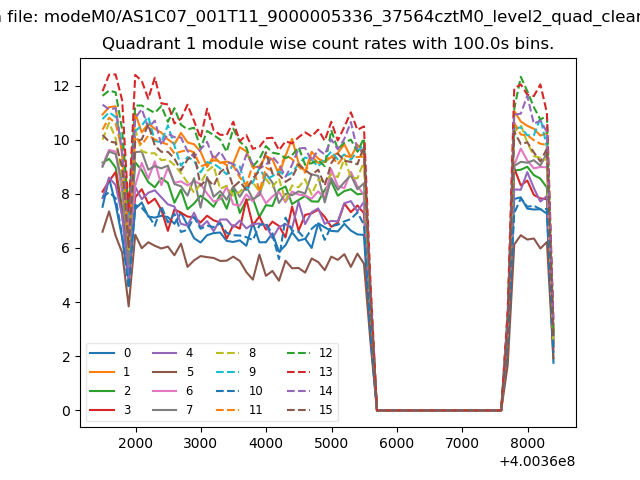
| Module-wise count rates for Quadrant A Data is divided into 100 sec bins |
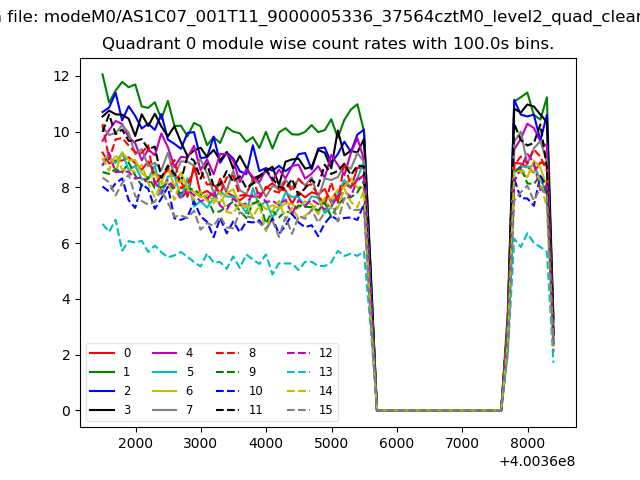 |
 |
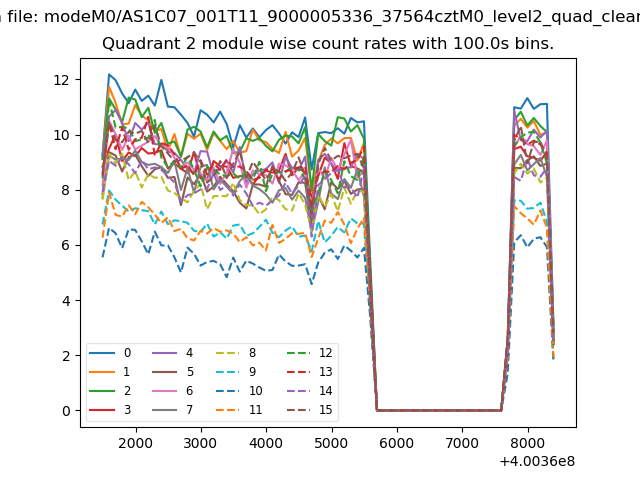
| Module-wise count rates for Quadrant B Data is divided into 100 sec bins |
 |
 |
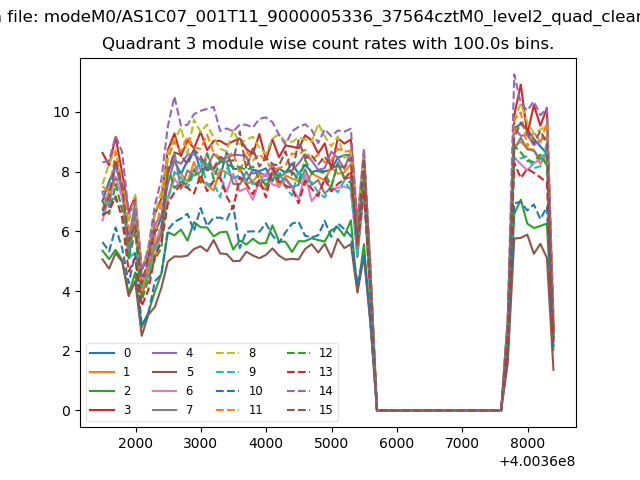
| Module-wise count rates for Quadrant C Data is divided into 100 sec bins |
 |
 |
| Module-wise count rates for Quadrant D Data is divided into 100 sec bins |
 |
 |
| Parameter | Plot |
|---|---|
| CZT HV Monitor | 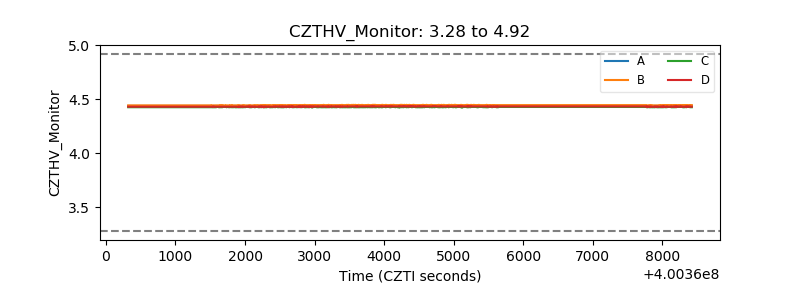 |
| D_VDD | 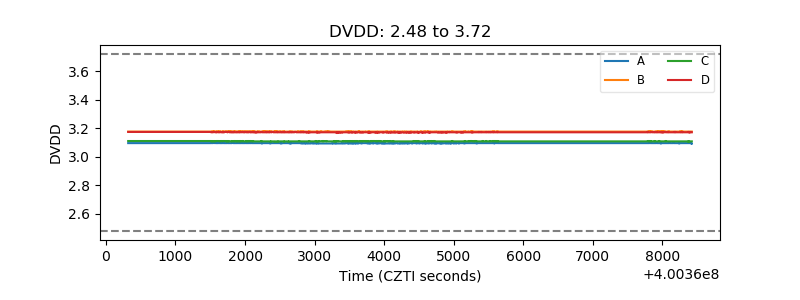 |
| Temperature 1 | 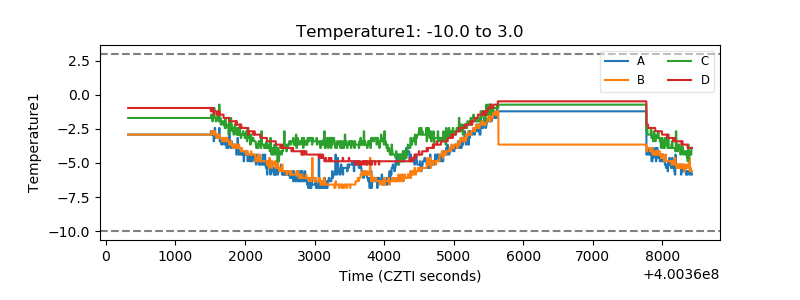 |
| Veto HV Monitor | 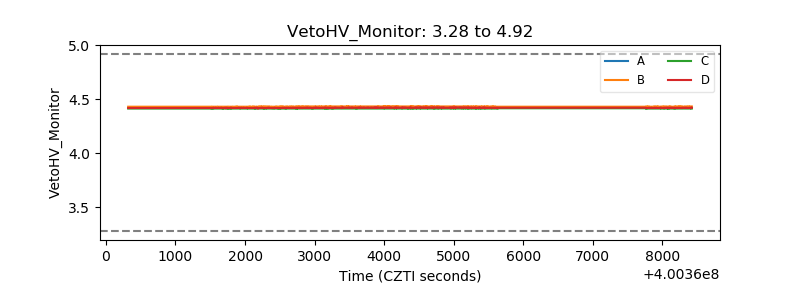 |
| Veto LLD | 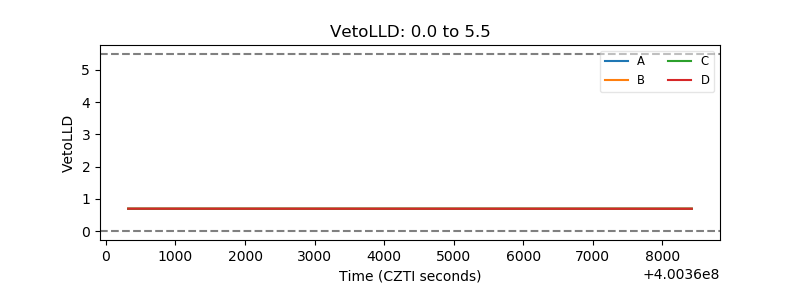 |
| Alpha Counter | 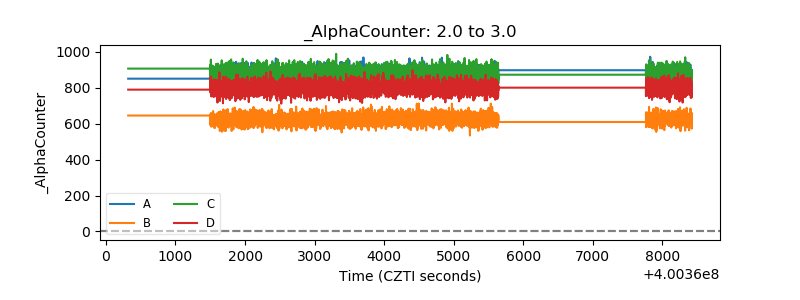 |
| _CPM_Rate | 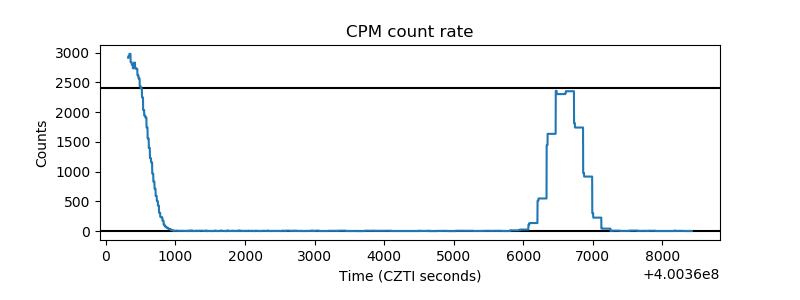 |
| CZT Counter | 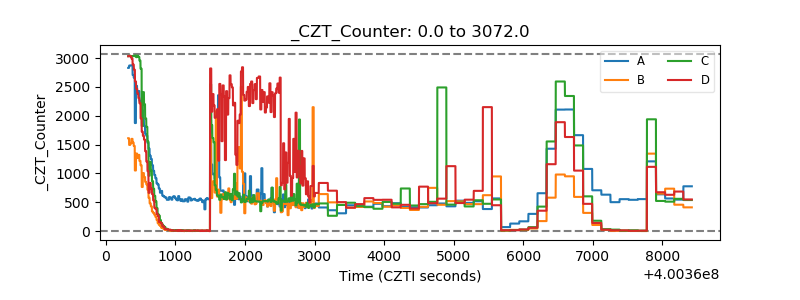 |
| +2.5 Volts monitor | 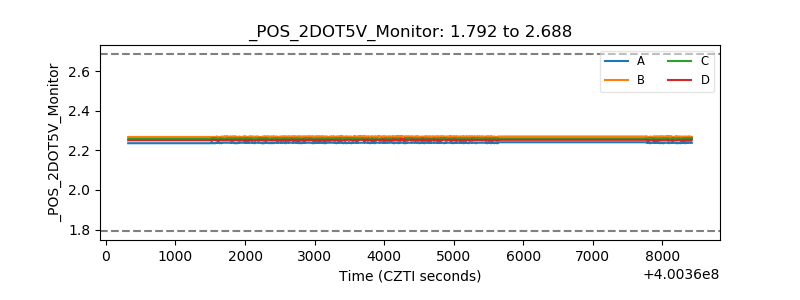 |
| +5 Volts monitor | 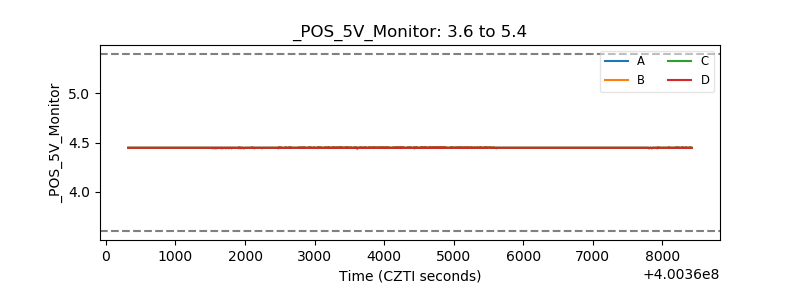 |
| _ROLL_ROT | 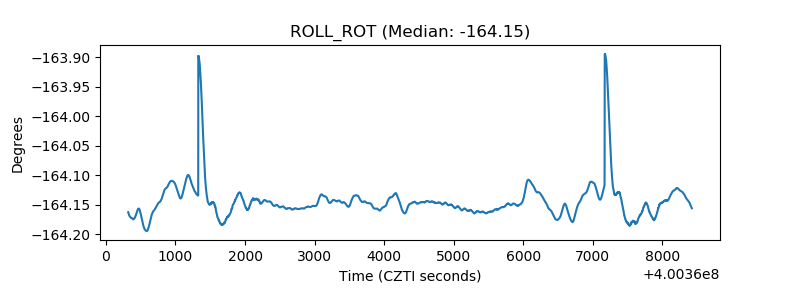 |
| _Roll_DEC | 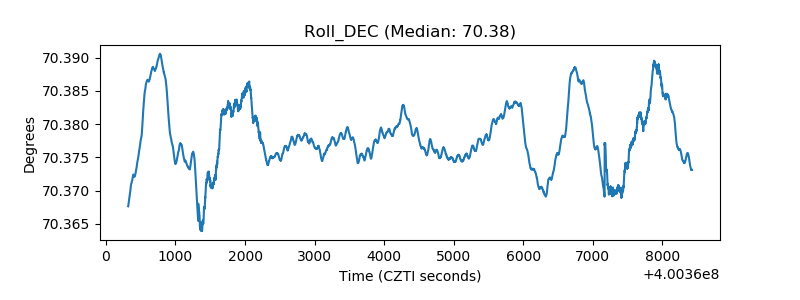 |
| _Roll_RA | 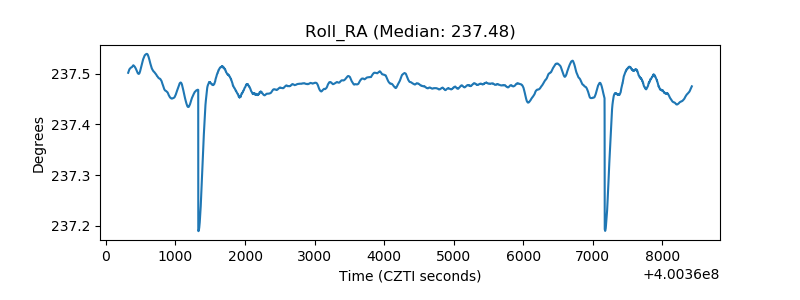 |
| Veto Counter | 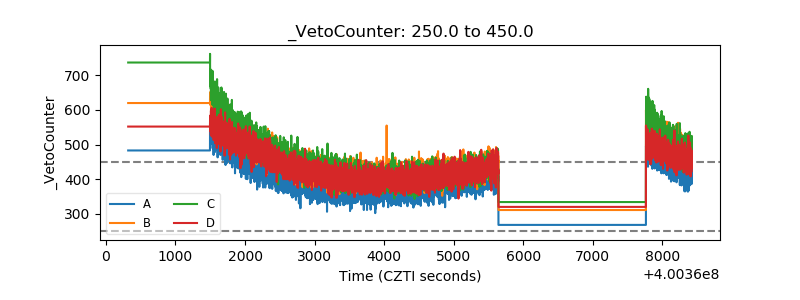 |