| Param | Original file | Final file |
|---|---|---|
| Filename | modeM0/AS1C07_001T11_9000005336_37567cztM0_level2.evt | modeM0/AS1C07_001T11_9000005336_37567cztM0_level2_quad_clean.evt |
| Size (bytes) | 421,070,400 | 97,441,920 |
| Size | 401.6 MB | 92.9 MB |
| Events in quadrant A | 2,634,545 | 644,906 |
| Events in quadrant B | 2,845,352 | 659,410 |
| Events in quadrant C | 2,623,086 | 662,402 |
| Events in quadrant D | 4,281,602 | 605,789 |
| Mode M0 | |||
|---|---|---|---|
| Quadrant | BADHDUFLAG | Total packets | Discarded packets |
| A | 0 | 11309 | 3 |
| B | 0 | 12182 | 2 |
| C | 0 | 11267 | 2 |
| D | 0 | 16689 | 2 |
| Mode M9 | |||
|---|---|---|---|
| Quadrant | BADHDUFLAG | Total packets | Discarded packets |
| A | 0 | 35 | 0 |
| B | 0 | 35 | 0 |
| C | 0 | 35 | 0 |
| D | 0 | 36 | 0 |
| Mode SS | |||
|---|---|---|---|
| Quadrant | BADHDUFLAG | Total packets | Discarded packets |
| A | 0 | 110 | 0 |
| B | 0 | 110 | 0 |
| C | 0 | 110 | 0 |
| D | 0 | 110 | 0 |
| Quadrant | Total seconds | Saturated seconds | Saturation percentage |
|---|---|---|---|
| A | 5405 | 10 | 0.185014% |
| B | 5405 | 71 | 1.313599% |
| C | 5405 | 16 | 0.296022% |
| D | 5405 | 434 | 8.029602% |
Noise dominated data is calculated using 1-second bins in cleaned event files. If a bin has >2000 counts, and if more than 50% of those come from <1% of pixels, then it is considered to be noise-dominated and hence unusable.
| Quadrant | # 1 sec bins | Bins with >0 counts | Bins with >2000 counts | High rate bins dominated by noise | Noise dominated (total time) | Noise dominated (detector-on time) | Marked lightcurve |
|---|---|---|---|---|---|---|---|
| A | 7256 | 5406 | 2 | 2 | 0.03% | 0.04% | 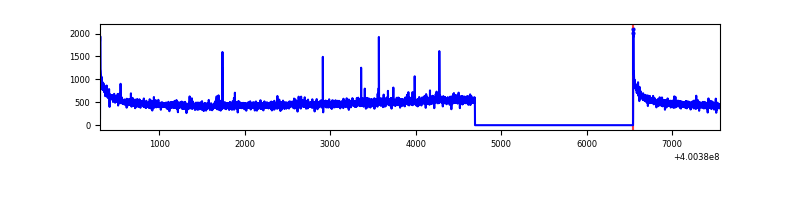 |
| B | 7256 | 5406 | 43 | 43 | 0.59% | 0.80% | 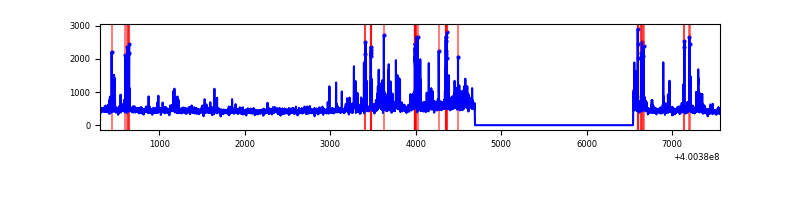 |
| C | 7256 | 5406 | 14 | 14 | 0.19% | 0.26% | 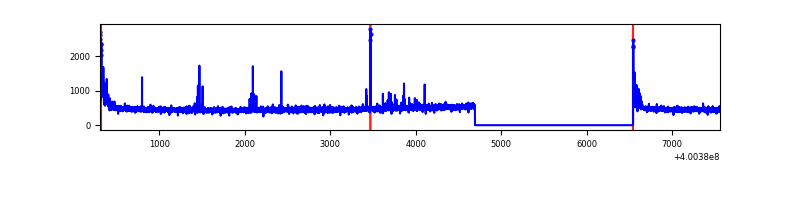 |
| D | 7256 | 5405 | 394 | 394 | 5.43% | 7.29% | 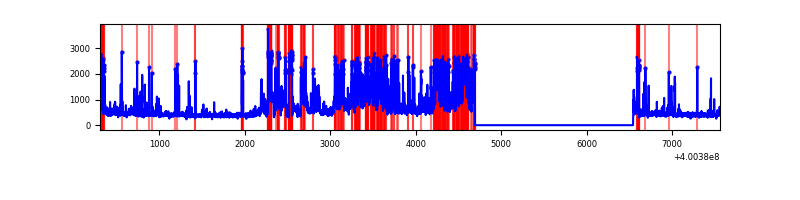 |
Top three noisy pixels from each quadrant. If the there are fewer than three noisy pixels in the level2.evt file, extra rows are filled as -1
| Pixel properties | Quadrant properties | ||||||
|---|---|---|---|---|---|---|---|
| Quadrant | DetID | PixID | Counts | Sigma | Mean | Median | Sigma |
| A | 10 | 83 | 311970 | 2622.42 | 587 | 574 | 118.7 |
| A | 12 | 189 | 14829 | 120.05 | 587 | 574 | 118.7 |
| A | 9 | 143 | 14357 | 116.07 | 587 | 574 | 118.7 |
| B | 5 | 172 | 144220 | 1287.31 | 587 | 571 | 111.6 |
| B | 5 | 255 | 115287 | 1028.03 | 587 | 571 | 111.6 |
| B | 0 | 213 | 91795 | 817.5 | 587 | 571 | 111.6 |
| C | 15 | 214 | 232863 | 1739.65 | 576 | 579 | 133.5 |
| C | 0 | 10 | 94311 | 701.99 | 576 | 579 | 133.5 |
| C | 15 | 159 | 25471 | 186.42 | 576 | 579 | 133.5 |
| D | 13 | 249 | 1116123 | 8210.03 | 555 | 539 | 135.9 |
| D | 2 | 250 | 278637 | 2046.63 | 555 | 539 | 135.9 |
| D | 12 | 233 | 182907 | 1342.12 | 555 | 539 | 135.9 |
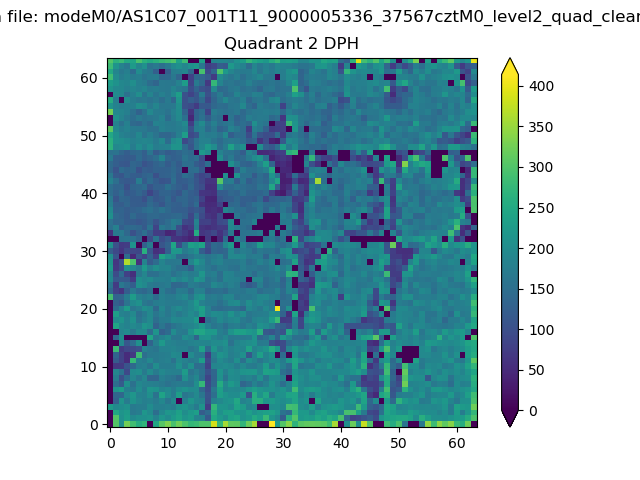
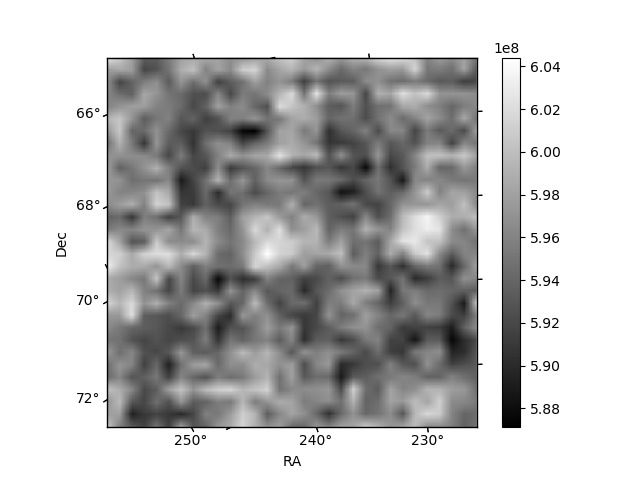
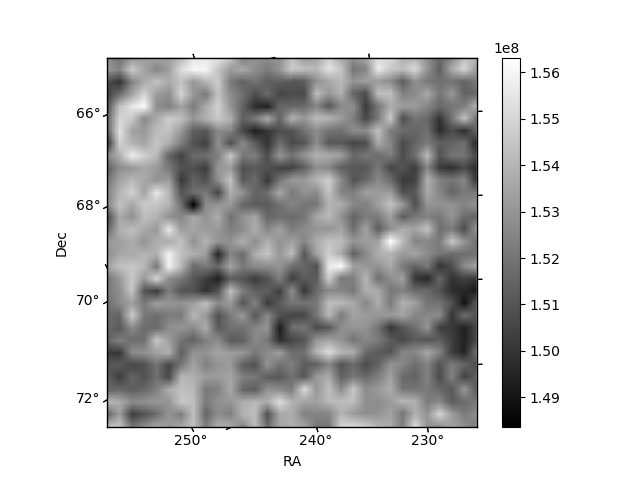
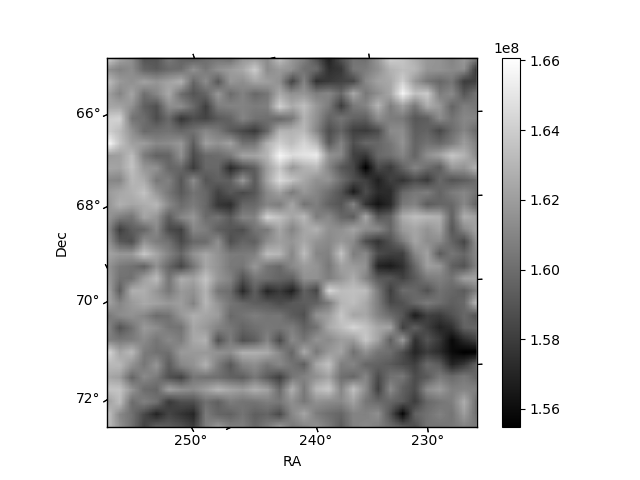
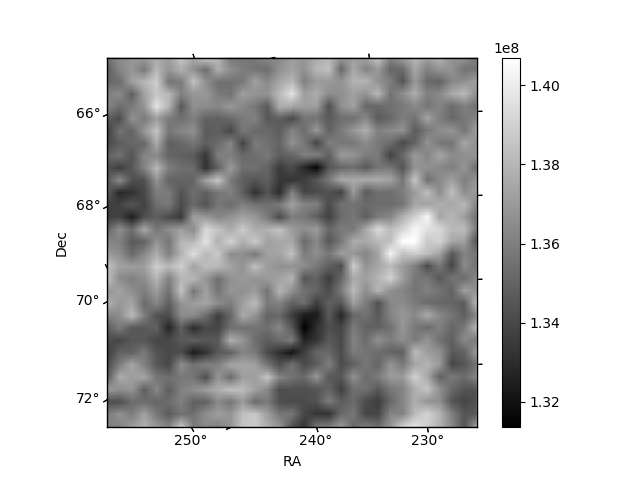
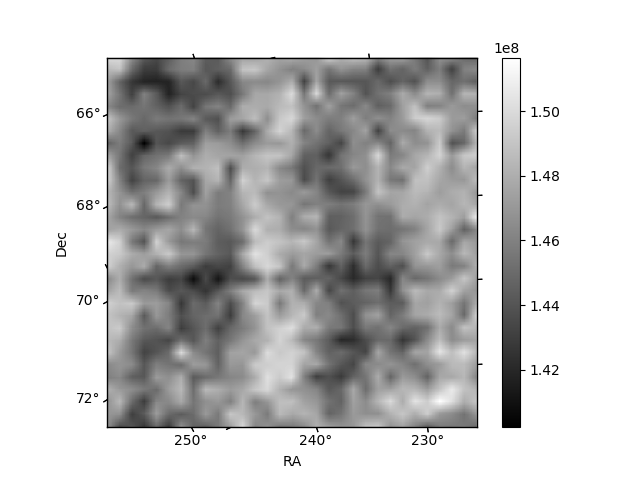
Histogram calculated using DETX and DETY for each event in the final _common_clean file
| Quadrant A | 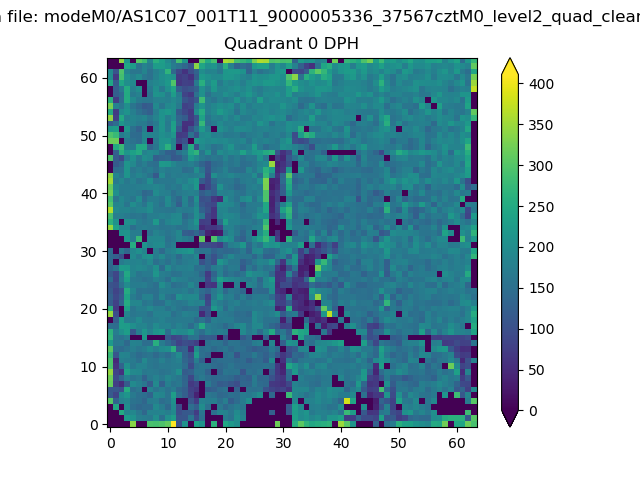 |
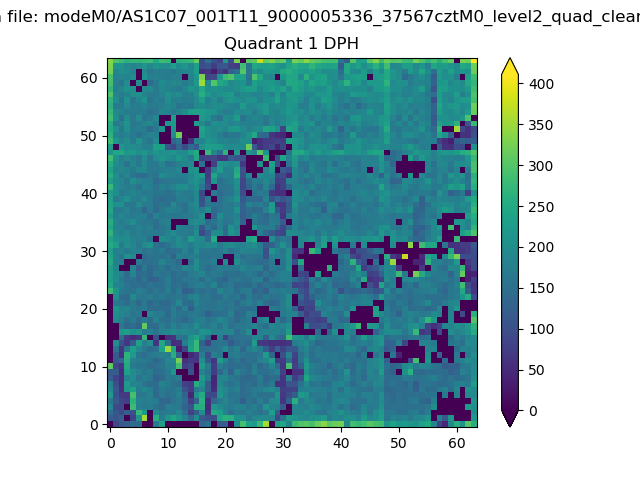 |
Quadrant B |
|---|---|---|---|
| Quadrant D | 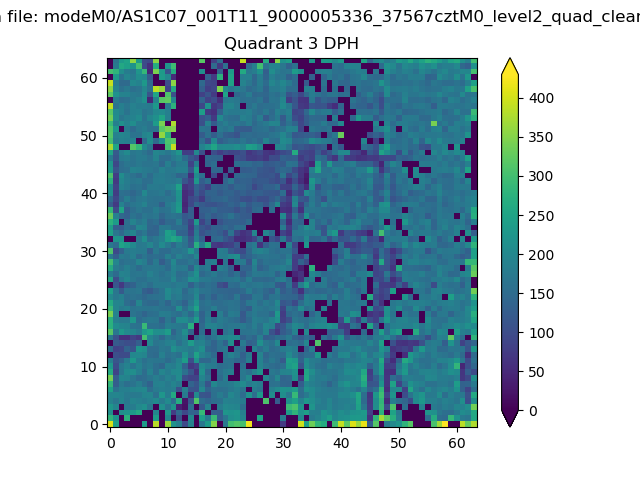 |
 |
Quadrant C |
| Plot type | Count rate plots | Images |
|---|---|---|
| Comparison with Poisson distribution Blue bars denote a histogram of data divided into 1 sec bins. Red curve is a Poisson curve with rate = median count rate of data. |
 |
 |
| Quadrant-wise count rates Data is divided into 100 sec bins |
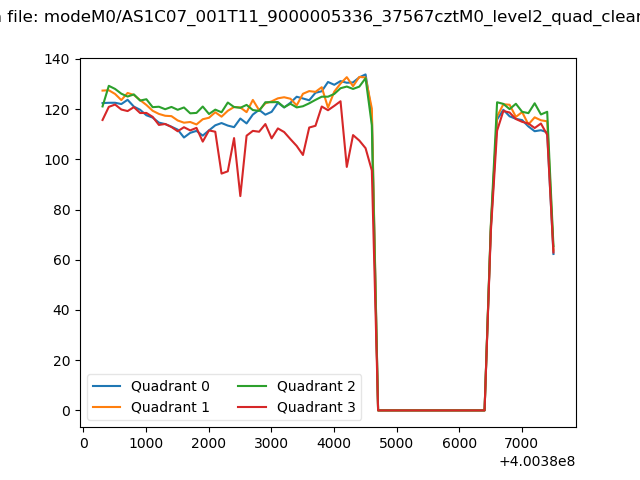 |
|
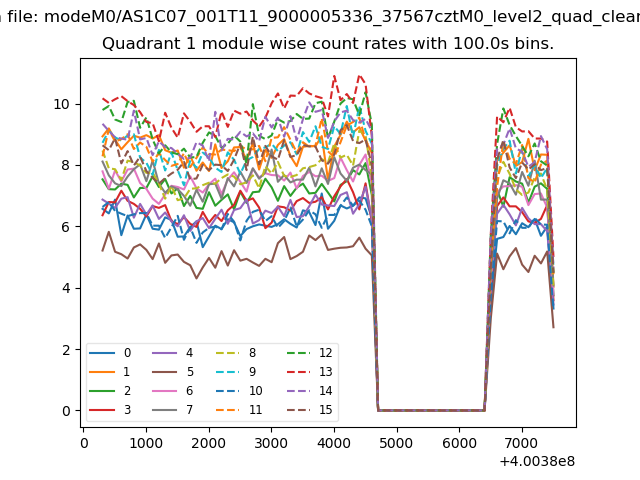
| Module-wise count rates for Quadrant A Data is divided into 100 sec bins |
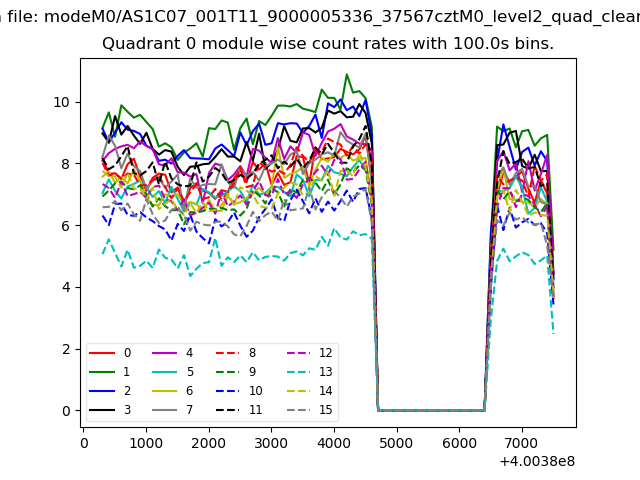 |
 |
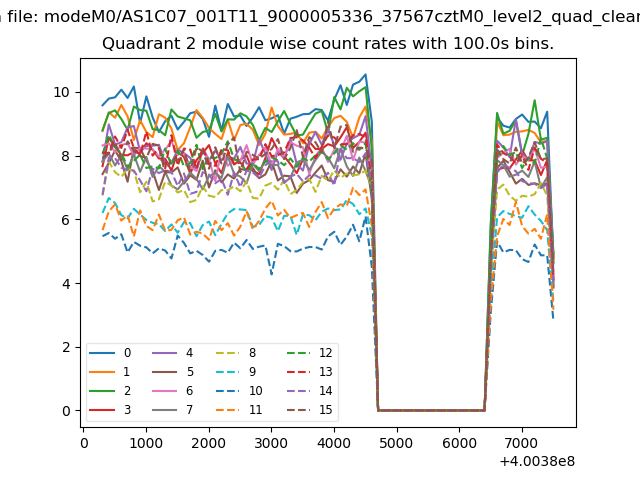
| Module-wise count rates for Quadrant B Data is divided into 100 sec bins |
 |
 |
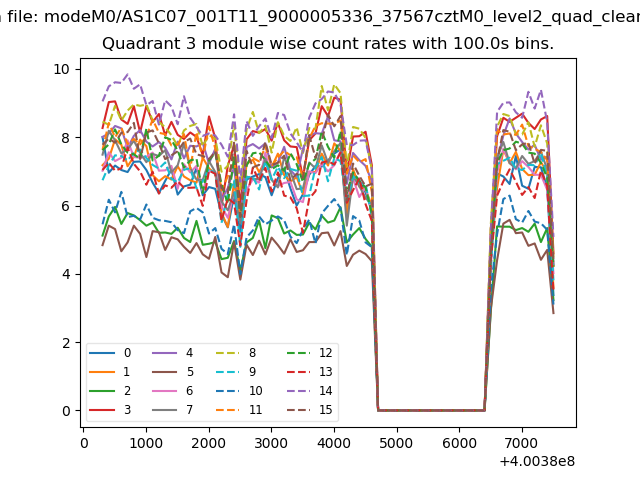
| Module-wise count rates for Quadrant C Data is divided into 100 sec bins |
 |
 |
| Module-wise count rates for Quadrant D Data is divided into 100 sec bins |
 |
 |
| Parameter | Plot |
|---|---|
| CZT HV Monitor | 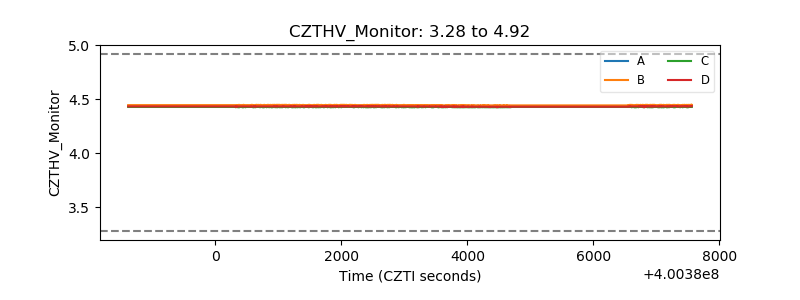 |
| D_VDD | 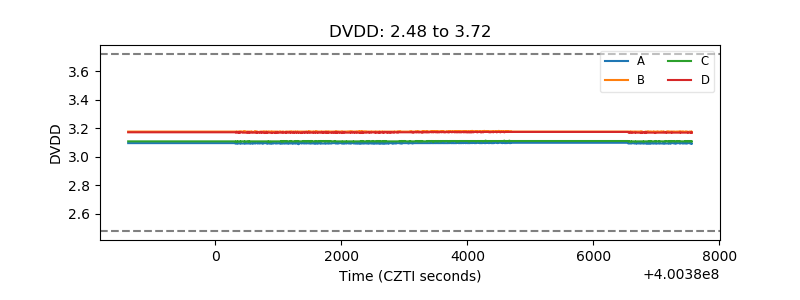 |
| Temperature 1 | 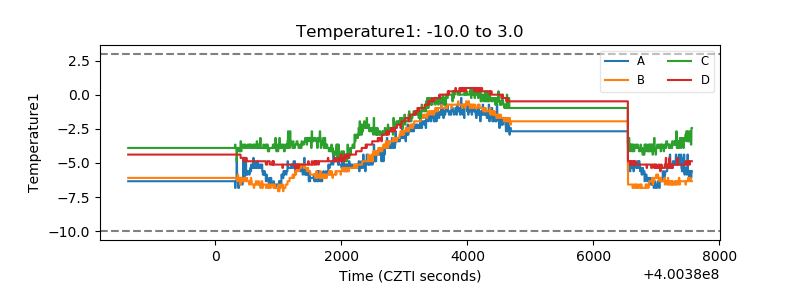 |
| Veto HV Monitor | 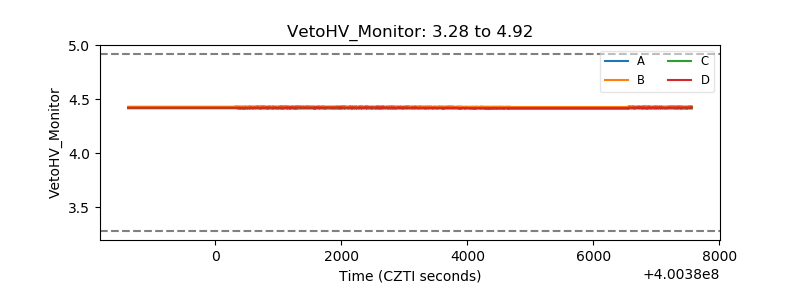 |
| Veto LLD | 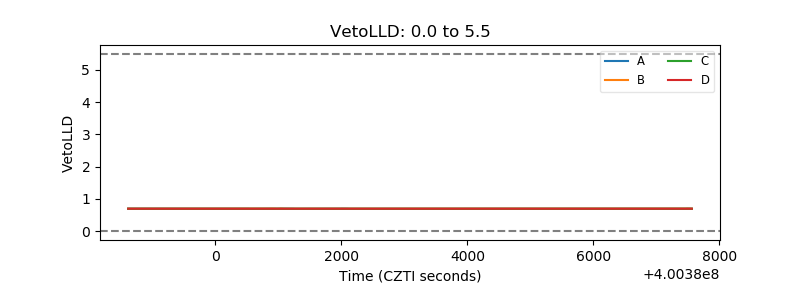 |
| Alpha Counter | 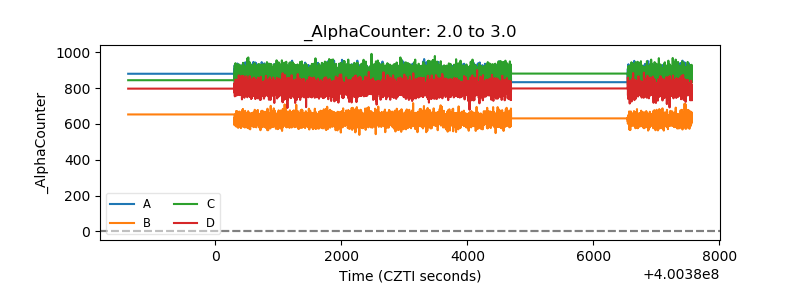 |
| _CPM_Rate | 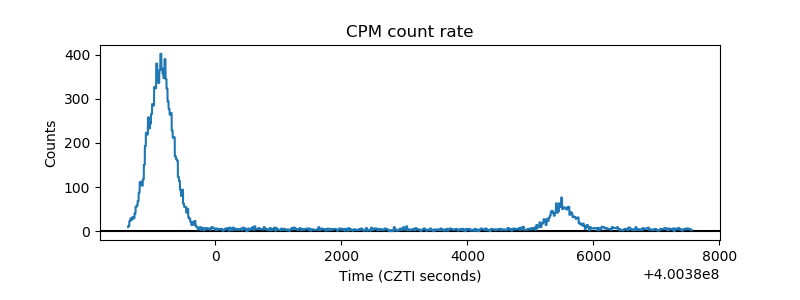 |
| CZT Counter | 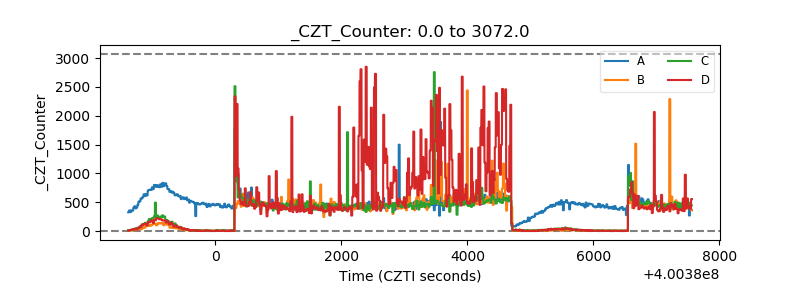 |
| +2.5 Volts monitor | 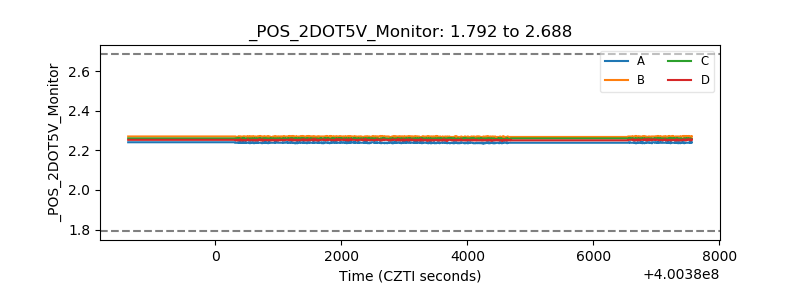 |
| +5 Volts monitor | 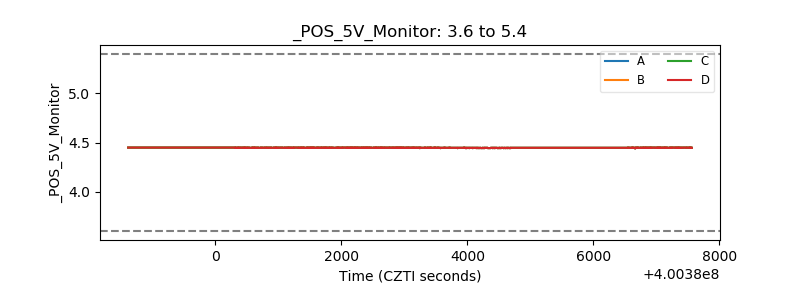 |
| _ROLL_ROT | 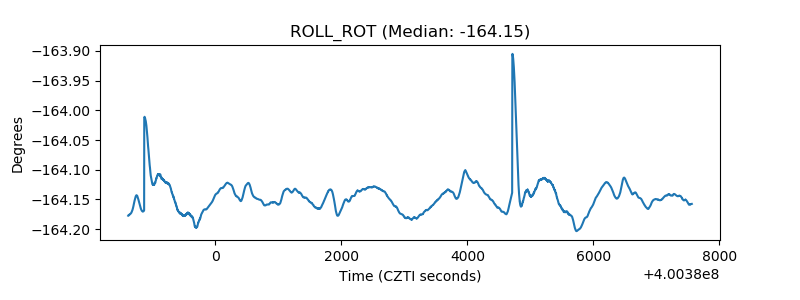 |
| _Roll_DEC | 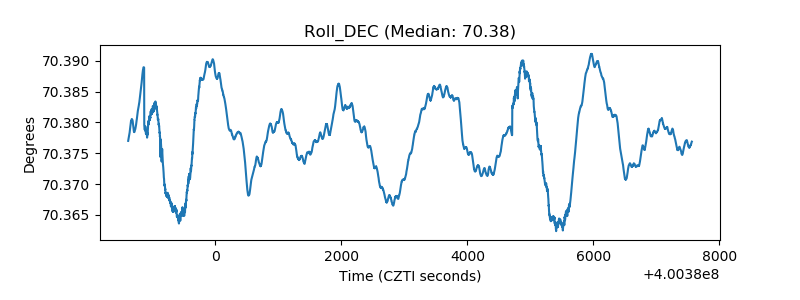 |
| _Roll_RA | 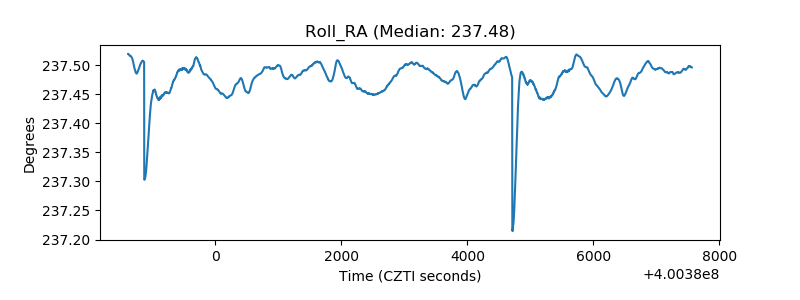 |
| Veto Counter | 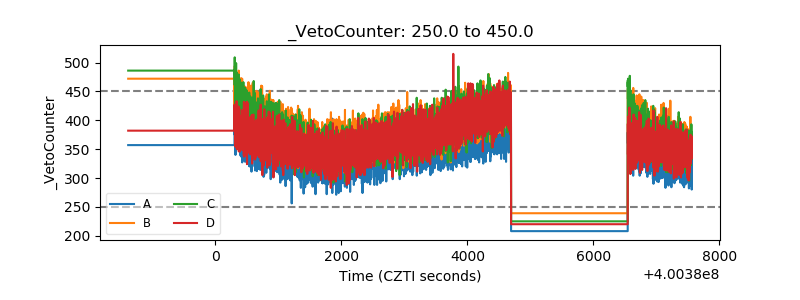 |