| Param | Original file | Final file |
|---|---|---|
| Filename | modeM0/AS1C07_001T11_9000005336_37568cztM0_level2.evt | modeM0/AS1C07_001T11_9000005336_37568cztM0_level2_quad_clean.evt |
| Size (bytes) | 427,979,520 | 104,880,960 |
| Size | 408.2 MB | 100.0 MB |
| Events in quadrant A | 2,891,039 | 696,141 |
| Events in quadrant B | 3,083,512 | 707,453 |
| Events in quadrant C | 2,786,107 | 706,527 |
| Events in quadrant D | 3,806,872 | 661,347 |
| Mode M0 | |||
|---|---|---|---|
| Quadrant | BADHDUFLAG | Total packets | Discarded packets |
| A | 0 | 12259 | 3 |
| B | 0 | 13034 | 2 |
| C | 0 | 12002 | 2 |
| D | 0 | 15580 | 2 |
| Mode M9 | |||
|---|---|---|---|
| Quadrant | BADHDUFLAG | Total packets | Discarded packets |
| A | 0 | 33 | 0 |
| B | 0 | 33 | 0 |
| C | 0 | 33 | 0 |
| D | 0 | 33 | 0 |
| Mode SS | |||
|---|---|---|---|
| Quadrant | BADHDUFLAG | Total packets | Discarded packets |
| A | 0 | 120 | 0 |
| B | 0 | 120 | 0 |
| C | 0 | 120 | 0 |
| D | 0 | 120 | 0 |
| Quadrant | Total seconds | Saturated seconds | Saturation percentage |
|---|---|---|---|
| A | 5794 | 12 | 0.207111% |
| B | 5794 | 67 | 1.156369% |
| C | 5794 | 9 | 0.155333% |
| D | 5794 | 263 | 4.539178% |
Noise dominated data is calculated using 1-second bins in cleaned event files. If a bin has >2000 counts, and if more than 50% of those come from <1% of pixels, then it is considered to be noise-dominated and hence unusable.
| Quadrant | # 1 sec bins | Bins with >0 counts | Bins with >2000 counts | High rate bins dominated by noise | Noise dominated (total time) | Noise dominated (detector-on time) | Marked lightcurve |
|---|---|---|---|---|---|---|---|
| A | 9137 | 5796 | 5 | 5 | 0.05% | 0.09% | 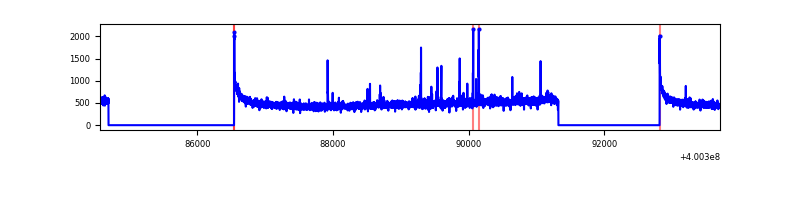 |
| B | 9137 | 5796 | 48 | 48 | 0.53% | 0.83% | 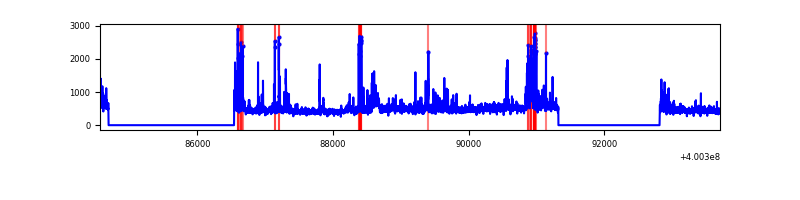 |
| C | 9137 | 5796 | 6 | 6 | 0.07% | 0.10% | 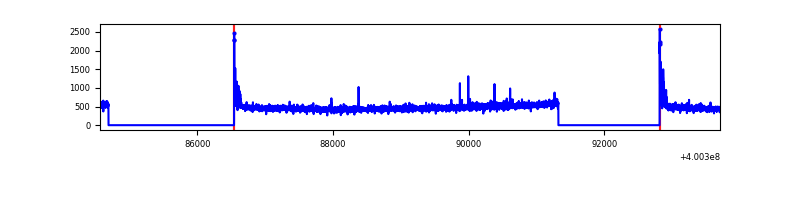 |
| D | 9137 | 5795 | 248 | 248 | 2.71% | 4.28% | 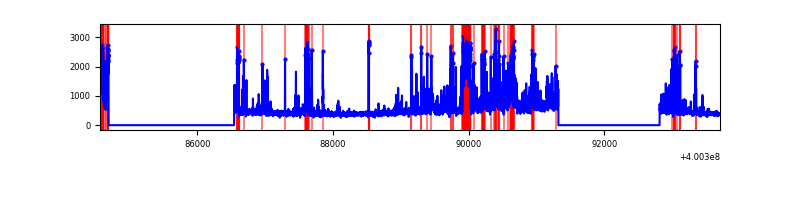 |
Top three noisy pixels from each quadrant. If the there are fewer than three noisy pixels in the level2.evt file, extra rows are filled as -1
| Pixel properties | Quadrant properties | ||||||
|---|---|---|---|---|---|---|---|
| Quadrant | DetID | PixID | Counts | Sigma | Mean | Median | Sigma |
| A | 10 | 83 | 330536 | 2557.9 | 640 | 627 | 129.0 |
| A | 9 | 143 | 36315 | 276.7 | 640 | 627 | 129.0 |
| A | 12 | 189 | 27100 | 205.25 | 640 | 627 | 129.0 |
| B | 5 | 255 | 219641 | 1788.58 | 637 | 620 | 122.5 |
| B | 0 | 213 | 86568 | 701.87 | 637 | 620 | 122.5 |
| B | 5 | 200 | 66888 | 541.16 | 637 | 620 | 122.5 |
| C | 15 | 214 | 248682 | 1710.21 | 626 | 627 | 145.0 |
| C | 0 | 10 | 75034 | 513.0 | 626 | 627 | 145.0 |
| C | 14 | 254 | 15979 | 105.84 | 626 | 627 | 145.0 |
| D | 13 | 243 | 375225 | 2490.85 | 615 | 596 | 150.4 |
| D | 12 | 233 | 178250 | 1181.2 | 615 | 596 | 150.4 |
| D | 13 | 249 | 159901 | 1059.2 | 615 | 596 | 150.4 |
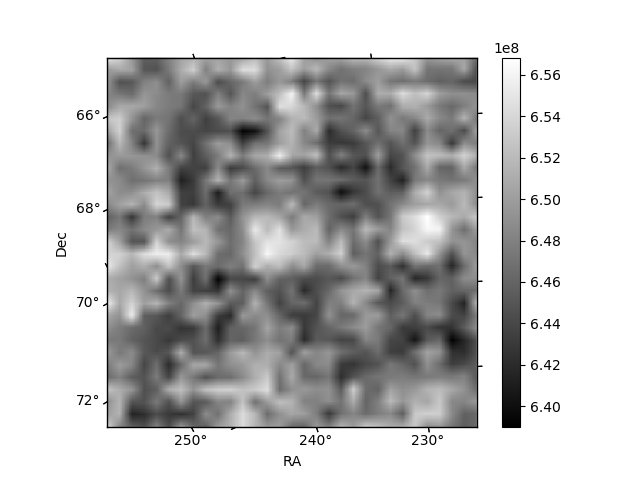
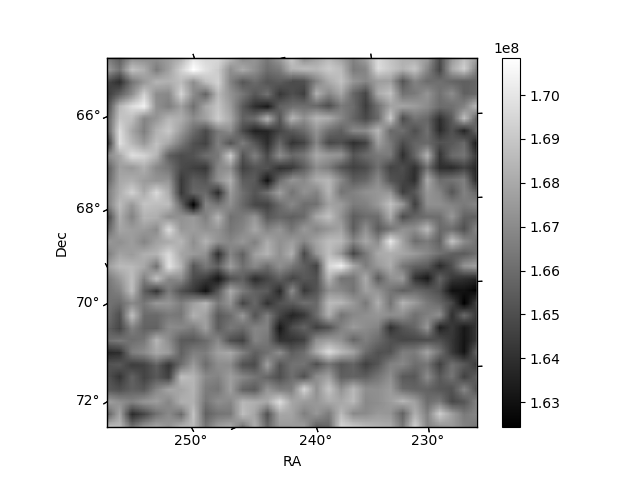
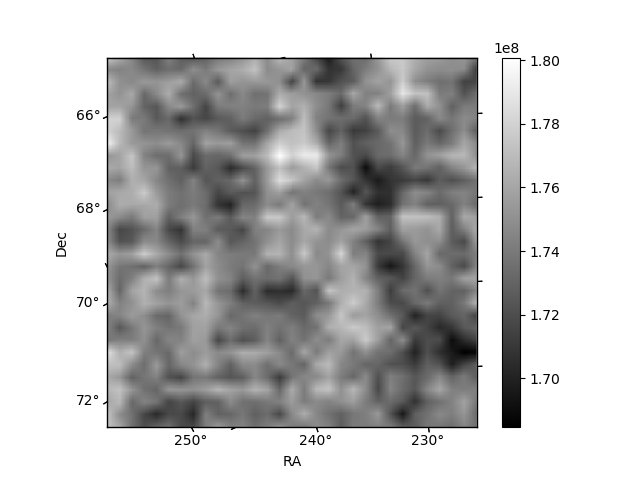
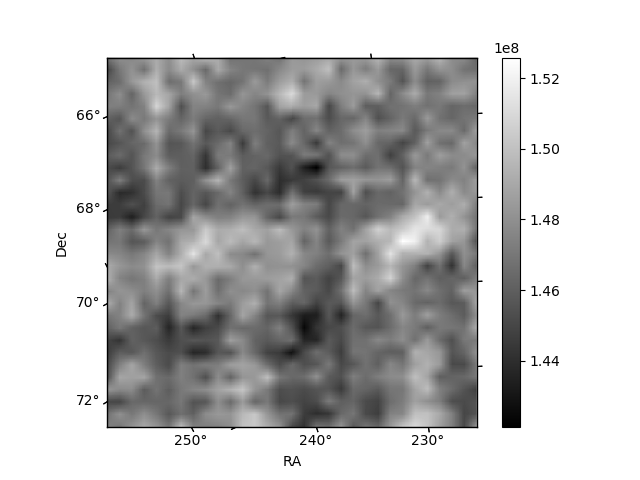
Histogram calculated using DETX and DETY for each event in the final _common_clean file
| Quadrant A | 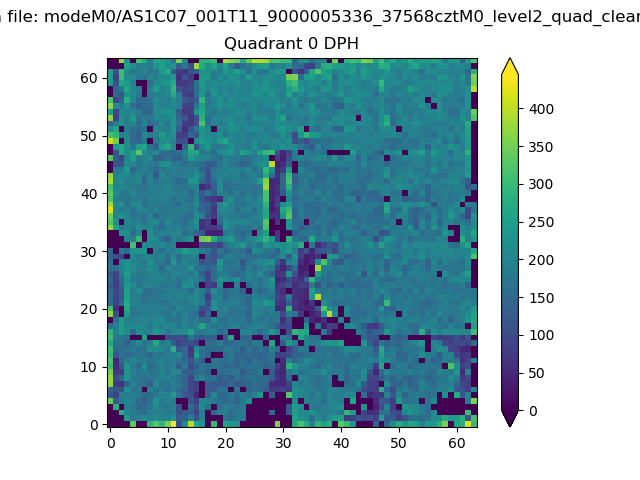 |
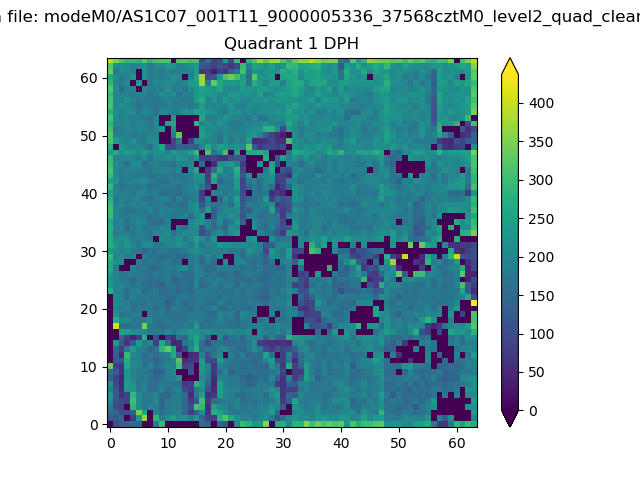 |
Quadrant B |
|---|---|---|---|
| Quadrant D | 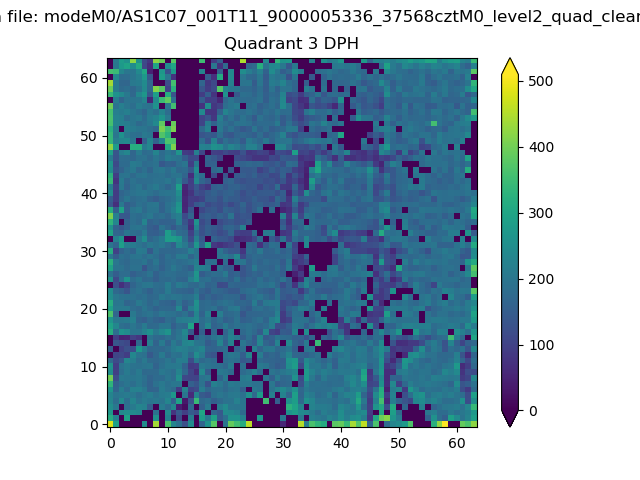 |
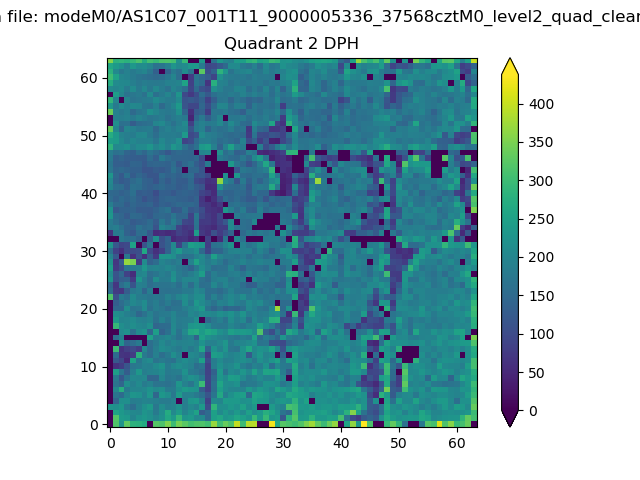 |
Quadrant C |
| Plot type | Count rate plots | Images |
|---|---|---|
| Comparison with Poisson distribution Blue bars denote a histogram of data divided into 1 sec bins. Red curve is a Poisson curve with rate = median count rate of data. |
 |
 |
| Quadrant-wise count rates Data is divided into 100 sec bins |
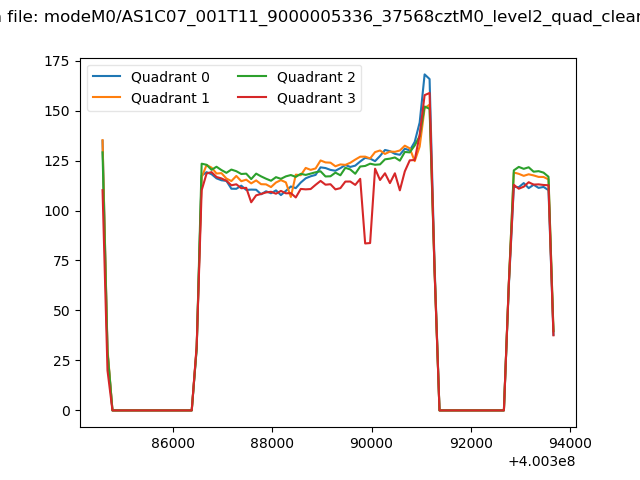 |
|
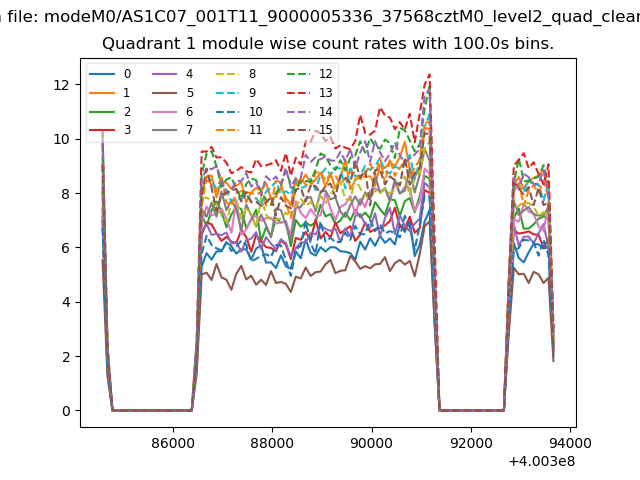
| Module-wise count rates for Quadrant A Data is divided into 100 sec bins |
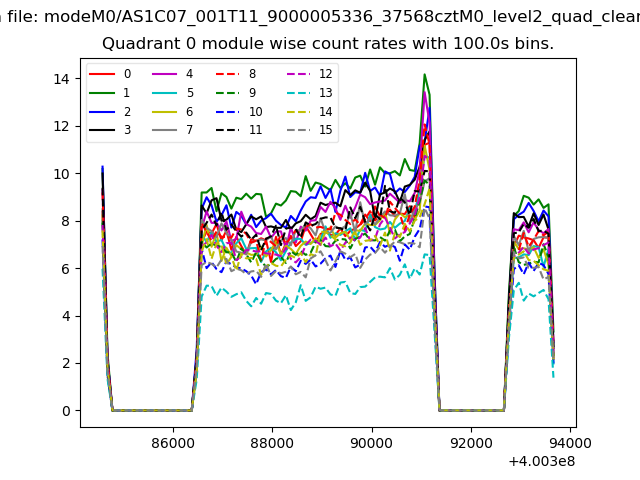 |
 |
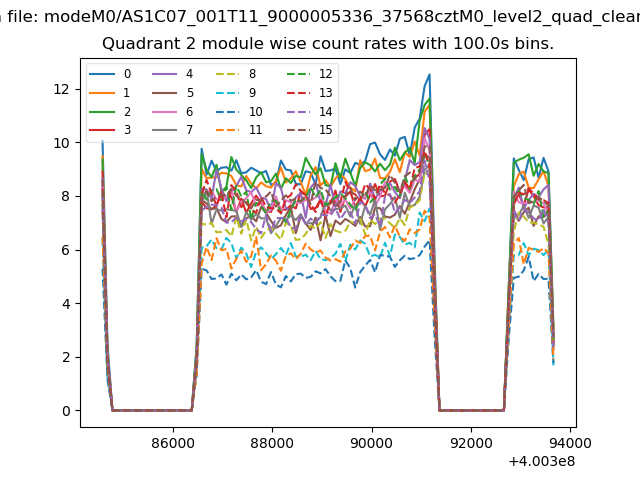
| Module-wise count rates for Quadrant B Data is divided into 100 sec bins |
 |
 |
| Module-wise count rates for Quadrant C Data is divided into 100 sec bins |
 |
 |
| Module-wise count rates for Quadrant D Data is divided into 100 sec bins |
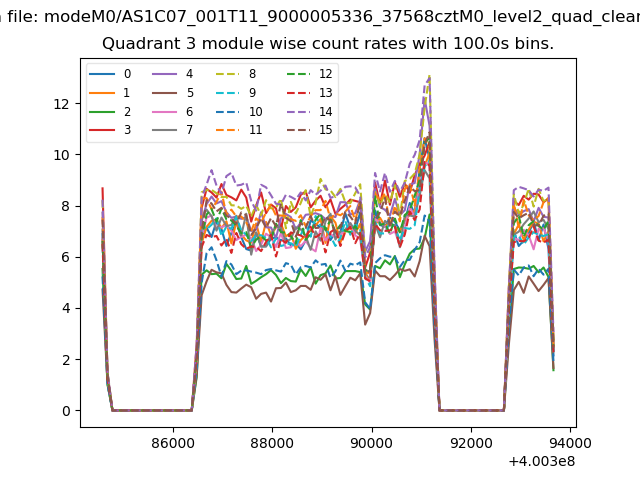 |
 |
| Parameter | Plot |
|---|---|
| CZT HV Monitor | 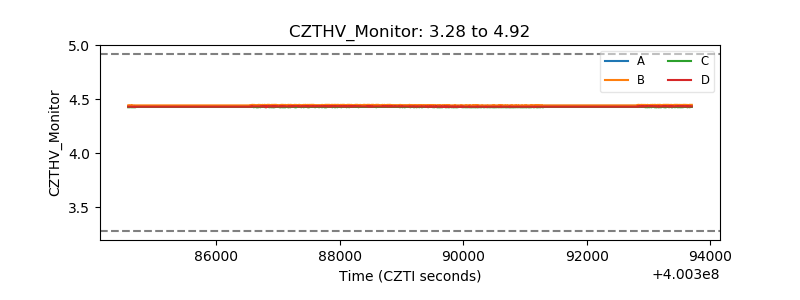 |
| D_VDD | 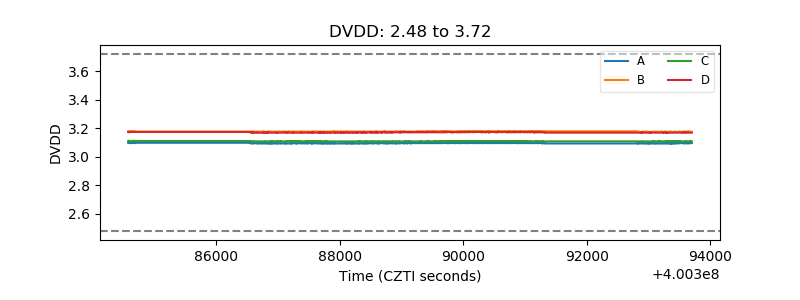 |
| Temperature 1 | 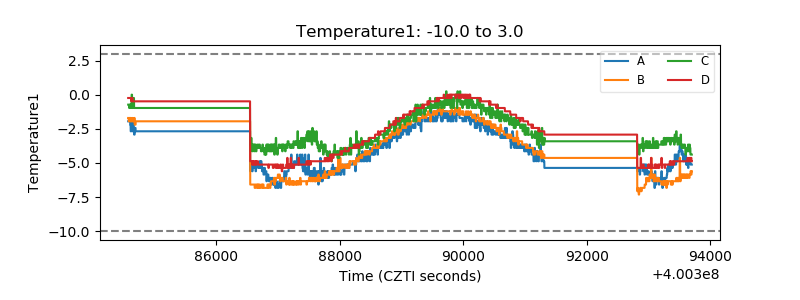 |
| Veto HV Monitor | 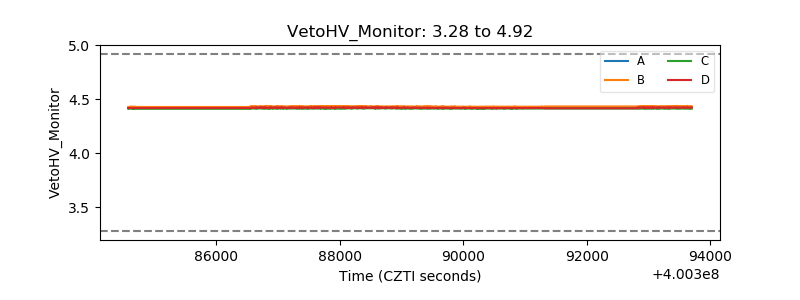 |
| Veto LLD | 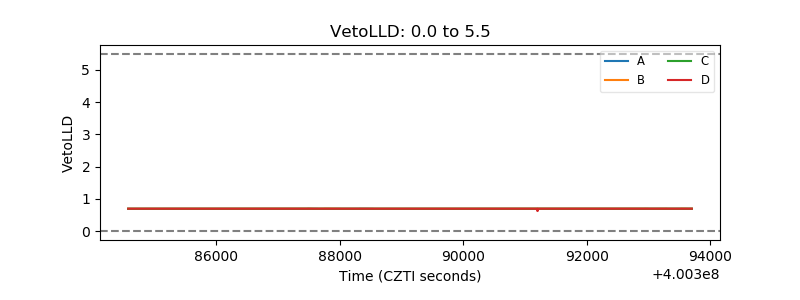 |
| Alpha Counter | 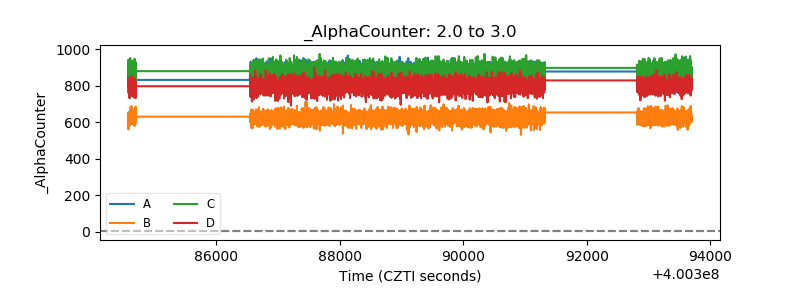 |
| _CPM_Rate | 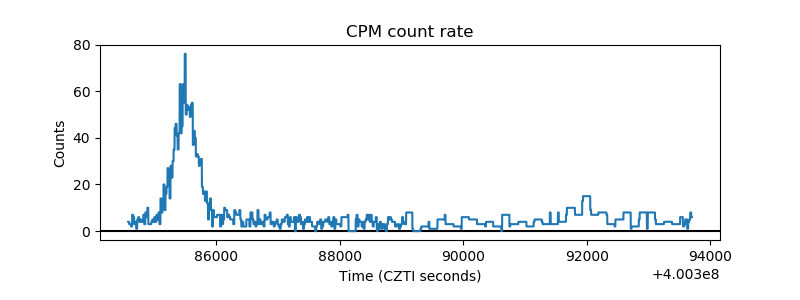 |
| CZT Counter | 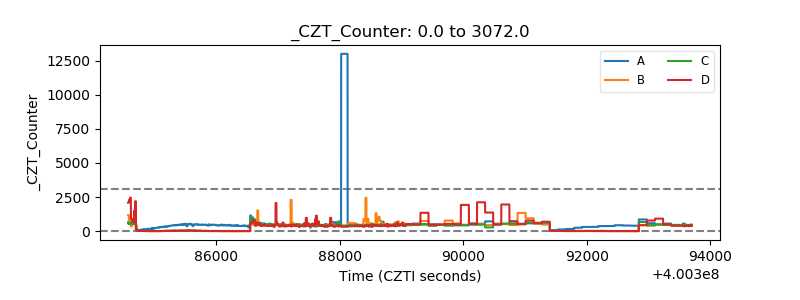 |
| +2.5 Volts monitor | 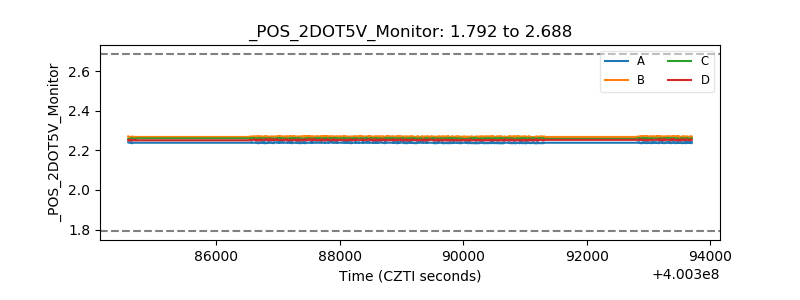 |
| +5 Volts monitor | 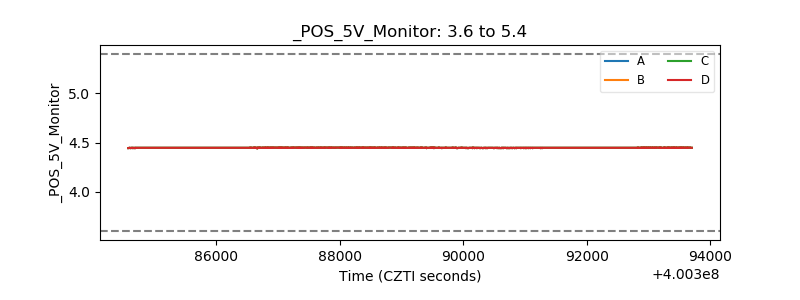 |
| _ROLL_ROT | 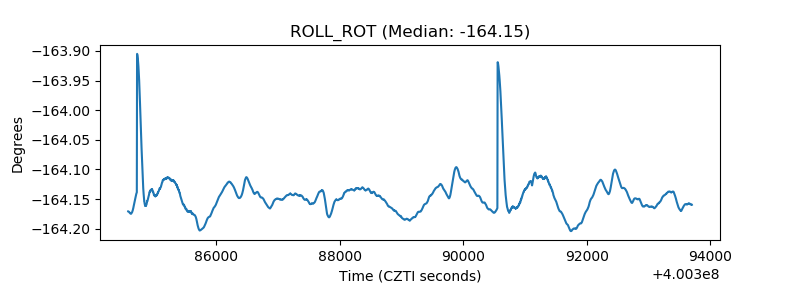 |
| _Roll_DEC | 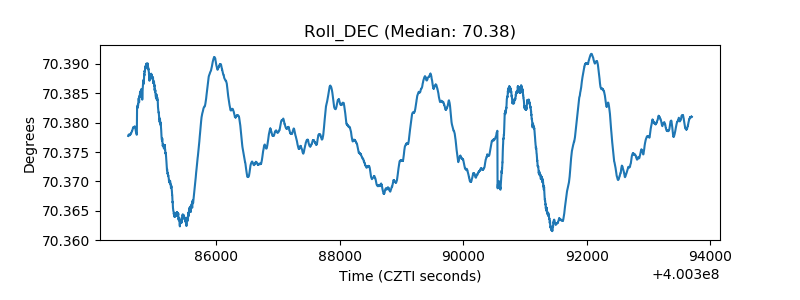 |
| _Roll_RA | 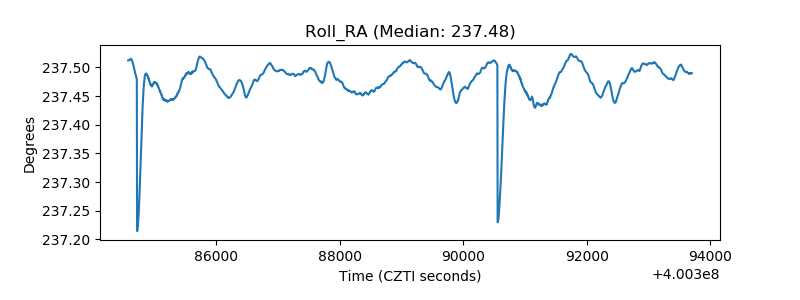 |
| Veto Counter | 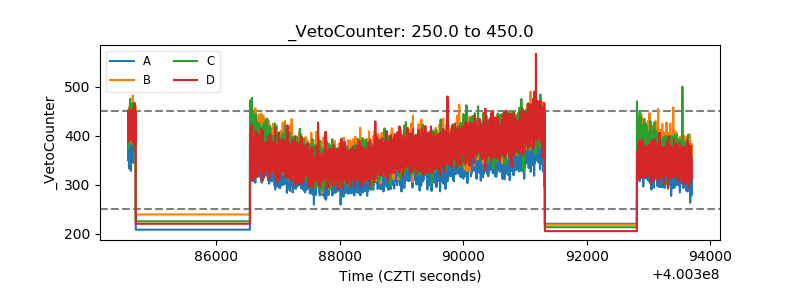 |