| Param | Original file | Final file |
|---|---|---|
| Filename | modeM0/AS1C07_001T11_9000005336_37569cztM0_level2.evt | modeM0/AS1C07_001T11_9000005336_37569cztM0_level2_quad_clean.evt |
| Size (bytes) | 423,365,760 | 102,669,120 |
| Size | 403.8 MB | 97.9 MB |
| Events in quadrant A | 2,810,916 | 685,400 |
| Events in quadrant B | 3,486,578 | 677,018 |
| Events in quadrant C | 2,747,190 | 689,871 |
| Events in quadrant D | 3,385,171 | 654,367 |
| Mode M0 | |||
|---|---|---|---|
| Quadrant | BADHDUFLAG | Total packets | Discarded packets |
| A | 0 | 11864 | 2 |
| B | 0 | 14218 | 1 |
| C | 0 | 11786 | 1 |
| D | 0 | 14160 | 1 |
| Mode M9 | |||
|---|---|---|---|
| Quadrant | BADHDUFLAG | Total packets | Discarded packets |
| A | 0 | 13 | 0 |
| B | 0 | 13 | 0 |
| C | 0 | 13 | 0 |
| D | 0 | 13 | 0 |
| Mode SS | |||
|---|---|---|---|
| Quadrant | BADHDUFLAG | Total packets | Discarded packets |
| A | 0 | 116 | 0 |
| B | 0 | 116 | 0 |
| C | 0 | 116 | 0 |
| D | 0 | 116 | 0 |
| Quadrant | Total seconds | Saturated seconds | Saturation percentage |
|---|---|---|---|
| A | 5765 | 5 | 0.086730% |
| B | 5765 | 269 | 4.666088% |
| C | 5765 | 9 | 0.156114% |
| D | 5765 | 147 | 2.549870% |
Noise dominated data is calculated using 1-second bins in cleaned event files. If a bin has >2000 counts, and if more than 50% of those come from <1% of pixels, then it is considered to be noise-dominated and hence unusable.
| Quadrant | # 1 sec bins | Bins with >0 counts | Bins with >2000 counts | High rate bins dominated by noise | Noise dominated (total time) | Noise dominated (detector-on time) | Marked lightcurve |
|---|---|---|---|---|---|---|---|
| A | 7078 | 5766 | 1 | 1 | 0.01% | 0.02% | 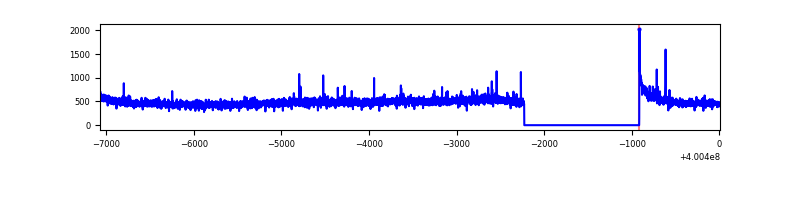 |
| B | 7078 | 5766 | 209 | 209 | 2.95% | 3.62% | 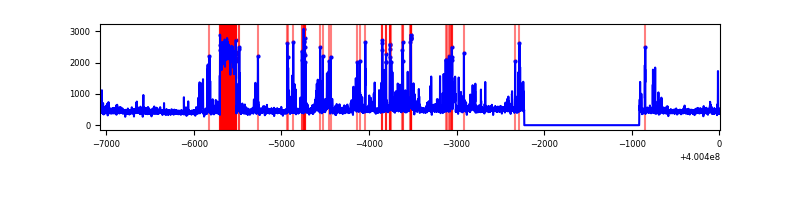 |
| C | 7078 | 5766 | 7 | 7 | 0.10% | 0.12% | 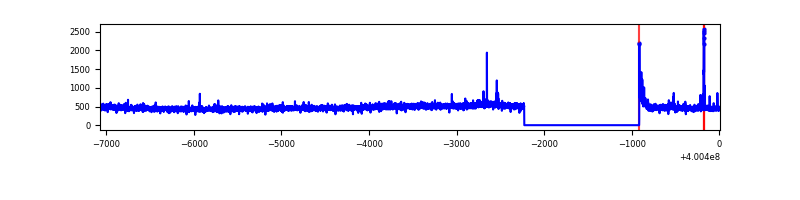 |
| D | 7078 | 5766 | 146 | 146 | 2.06% | 2.53% | 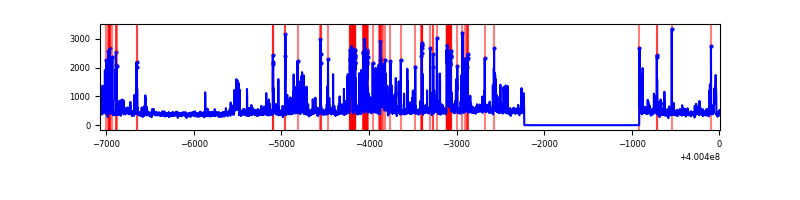 |
Top three noisy pixels from each quadrant. If the there are fewer than three noisy pixels in the level2.evt file, extra rows are filled as -1
| Pixel properties | Quadrant properties | ||||||
|---|---|---|---|---|---|---|---|
| Quadrant | DetID | PixID | Counts | Sigma | Mean | Median | Sigma |
| A | 10 | 83 | 298703 | 2309.92 | 637 | 624 | 129.0 |
| A | 12 | 189 | 23946 | 180.73 | 637 | 624 | 129.0 |
| A | 13 | 6 | 12889 | 95.05 | 637 | 624 | 129.0 |
| B | 5 | 200 | 491719 | 4195.93 | 617 | 599 | 117.0 |
| B | 0 | 213 | 210896 | 1796.69 | 617 | 599 | 117.0 |
| B | 5 | 172 | 115427 | 981.04 | 617 | 599 | 117.0 |
| C | 15 | 214 | 247106 | 1687.05 | 623 | 626 | 146.1 |
| C | 14 | 254 | 31749 | 213.02 | 623 | 626 | 146.1 |
| C | 0 | 10 | 30179 | 202.28 | 623 | 626 | 146.1 |
| D | 13 | 243 | 292048 | 1949.18 | 616 | 598 | 149.5 |
| D | 2 | 249 | 226869 | 1513.27 | 616 | 598 | 149.5 |
| D | 13 | 249 | 128709 | 856.79 | 616 | 598 | 149.5 |
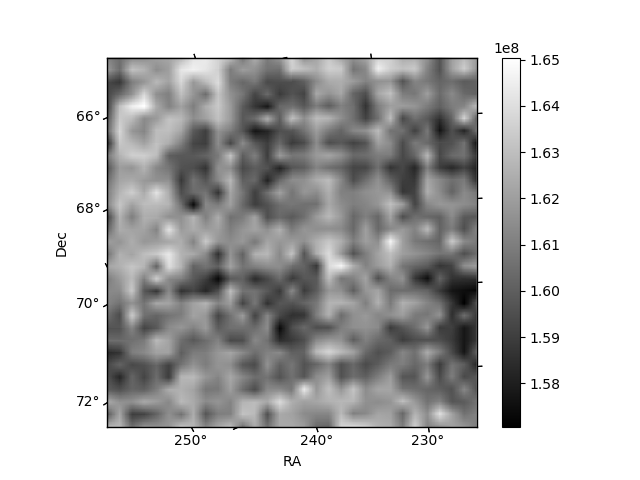
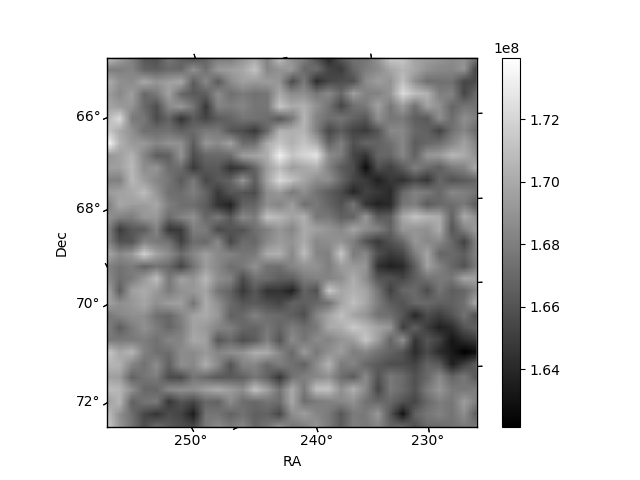
Histogram calculated using DETX and DETY for each event in the final _common_clean file
| Quadrant A | 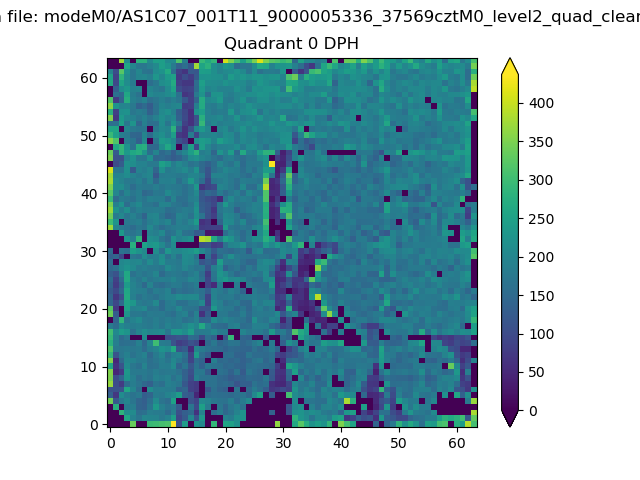 |
 |
Quadrant B |
|---|---|---|---|
| Quadrant D | 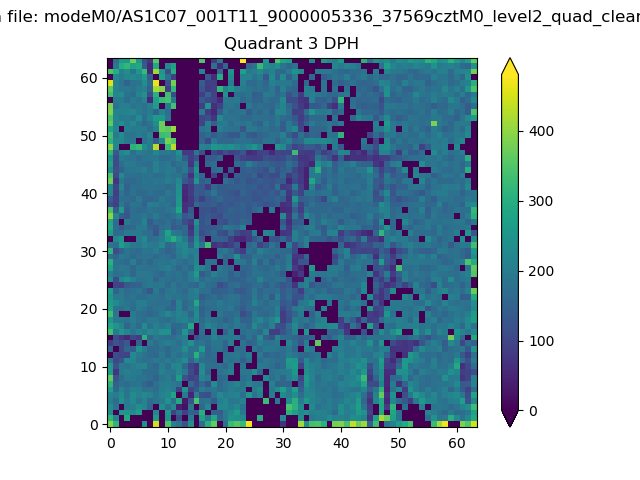 |
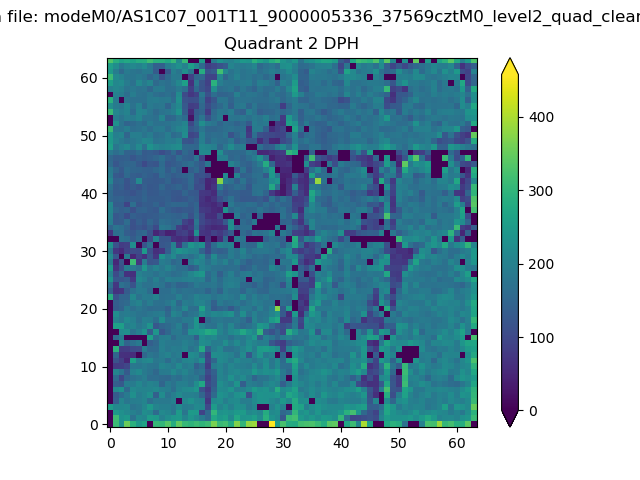 |
Quadrant C |
| Plot type | Count rate plots | Images |
|---|---|---|
| Comparison with Poisson distribution Blue bars denote a histogram of data divided into 1 sec bins. Red curve is a Poisson curve with rate = median count rate of data. |
 |
 |
| Quadrant-wise count rates Data is divided into 100 sec bins |
 |
|
| Module-wise count rates for Quadrant A Data is divided into 100 sec bins |
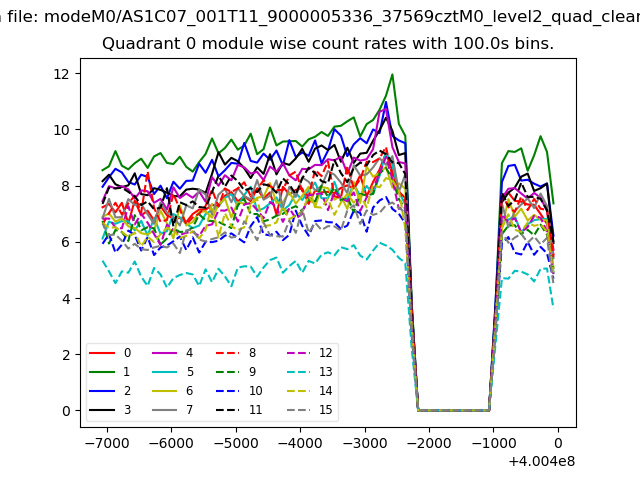 |
 |
| Module-wise count rates for Quadrant B Data is divided into 100 sec bins |
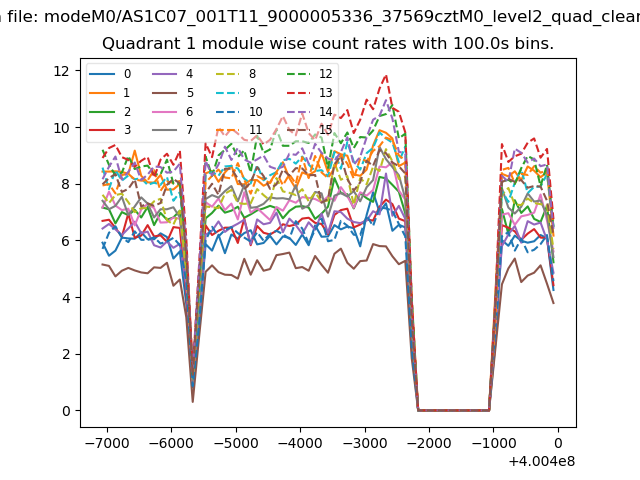 |
 |
| Module-wise count rates for Quadrant C Data is divided into 100 sec bins |
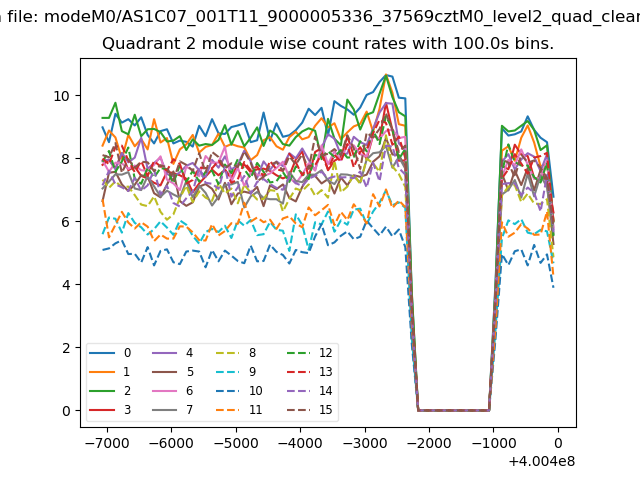 |
 |
| Module-wise count rates for Quadrant D Data is divided into 100 sec bins |
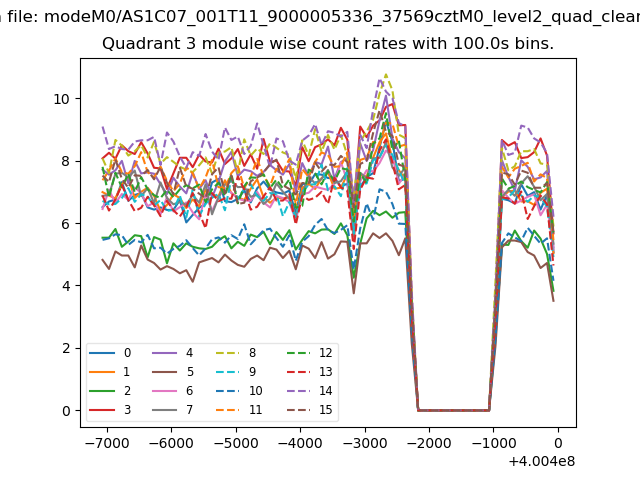 |
 |
| Parameter | Plot |
|---|---|
| CZT HV Monitor | 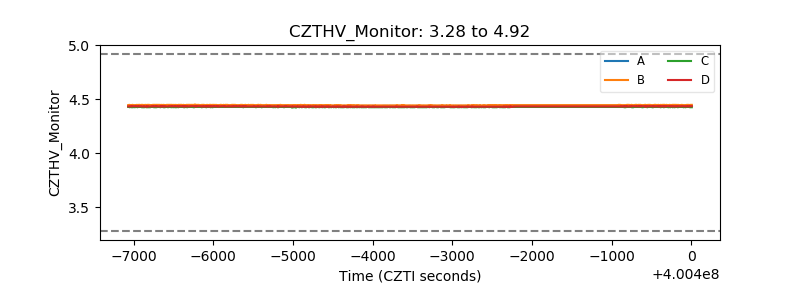 |
| D_VDD | 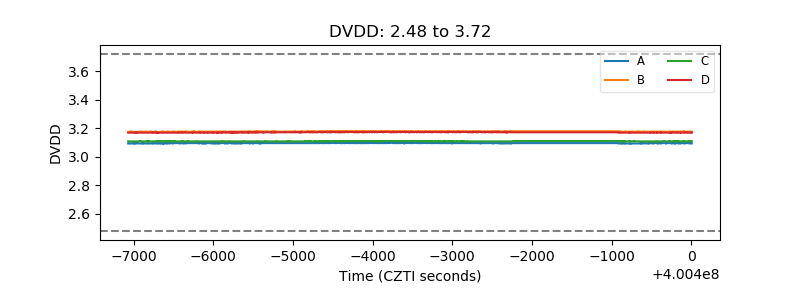 |
| Temperature 1 | 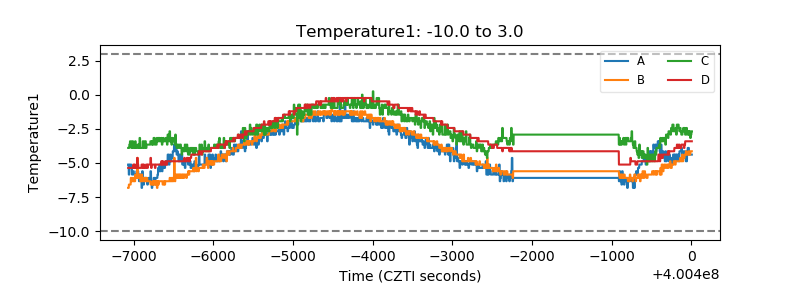 |
| Veto HV Monitor | 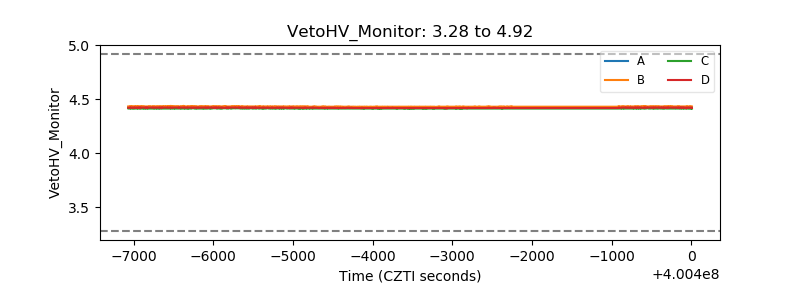 |
| Veto LLD |  |
| Alpha Counter |  |
| _CPM_Rate | 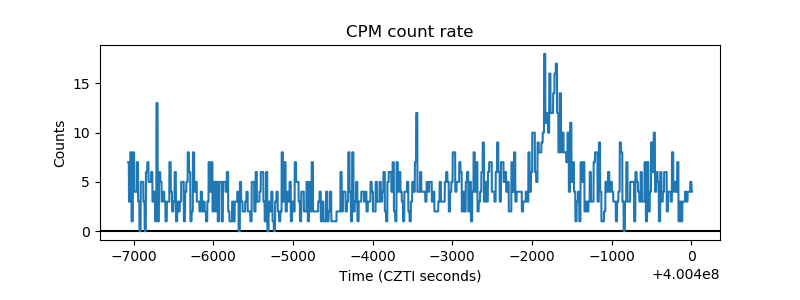 |
| CZT Counter | 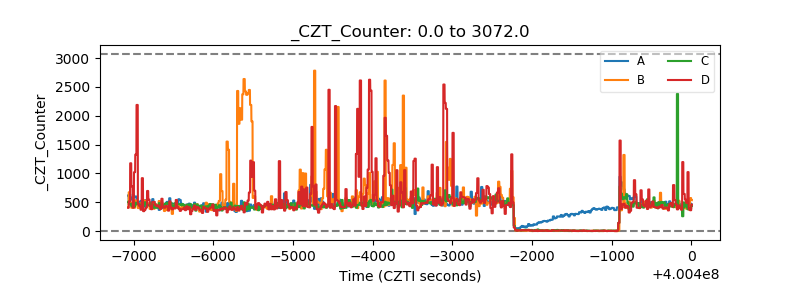 |
| +2.5 Volts monitor | 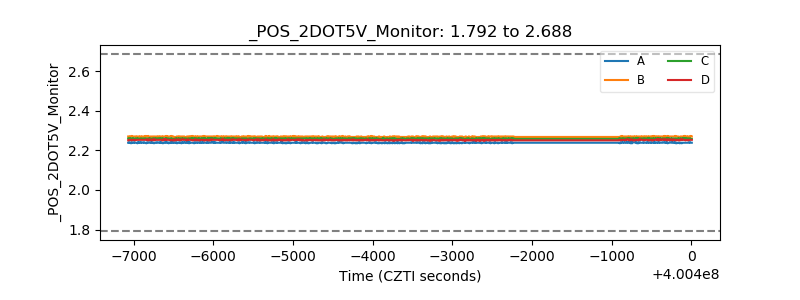 |
| +5 Volts monitor |  |
| _ROLL_ROT | 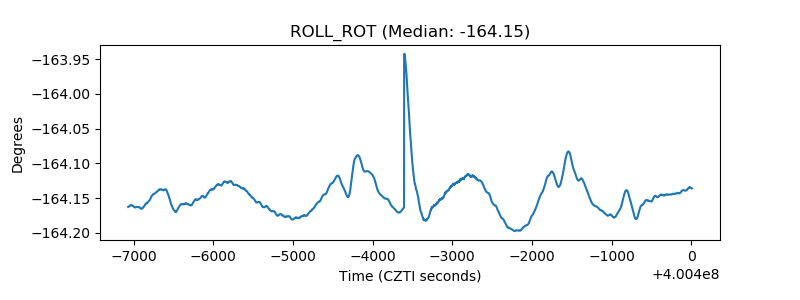 |
| _Roll_DEC | 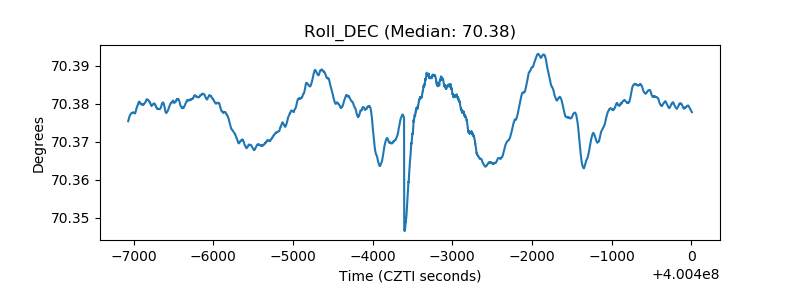 |
| _Roll_RA |  |
| Veto Counter | 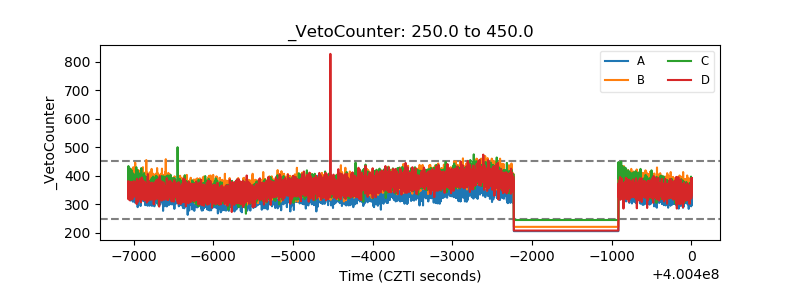 |