| Param | Original file | Final file |
|---|---|---|
| Filename | modeM0/AS1C07_001T11_9000005336_37570cztM0_level2.evt | modeM0/AS1C07_001T11_9000005336_37570cztM0_level2_quad_clean.evt |
| Size (bytes) | 450,745,920 | 107,280,000 |
| Size | 429.9 MB | 102.3 MB |
| Events in quadrant A | 3,031,580 | 717,009 |
| Events in quadrant B | 3,250,115 | 725,627 |
| Events in quadrant C | 2,917,343 | 718,531 |
| Events in quadrant D | 4,042,835 | 667,360 |
| Mode M0 | |||
|---|---|---|---|
| Quadrant | BADHDUFLAG | Total packets | Discarded packets |
| A | 0 | 12620 | 3 |
| B | 0 | 13611 | 2 |
| C | 0 | 12411 | 2 |
| D | 0 | 16139 | 2 |
| Mode M9 | |||
|---|---|---|---|
| Quadrant | BADHDUFLAG | Total packets | Discarded packets |
| A | 0 | 14 | 0 |
| B | 0 | 14 | 0 |
| C | 0 | 14 | 0 |
| D | 0 | 15 | 0 |
| Mode SS | |||
|---|---|---|---|
| Quadrant | BADHDUFLAG | Total packets | Discarded packets |
| A | 0 | 122 | 0 |
| B | 0 | 122 | 0 |
| C | 0 | 122 | 0 |
| D | 0 | 122 | 0 |
| Quadrant | Total seconds | Saturated seconds | Saturation percentage |
|---|---|---|---|
| A | 6022 | 11 | 0.182664% |
| B | 6022 | 78 | 1.295251% |
| C | 6022 | 13 | 0.215875% |
| D | 6022 | 322 | 5.347061% |
Noise dominated data is calculated using 1-second bins in cleaned event files. If a bin has >2000 counts, and if more than 50% of those come from <1% of pixels, then it is considered to be noise-dominated and hence unusable.
| Quadrant | # 1 sec bins | Bins with >0 counts | Bins with >2000 counts | High rate bins dominated by noise | Noise dominated (total time) | Noise dominated (detector-on time) | Marked lightcurve |
|---|---|---|---|---|---|---|---|
| A | 7306 | 6023 | 2 | 2 | 0.03% | 0.03% | 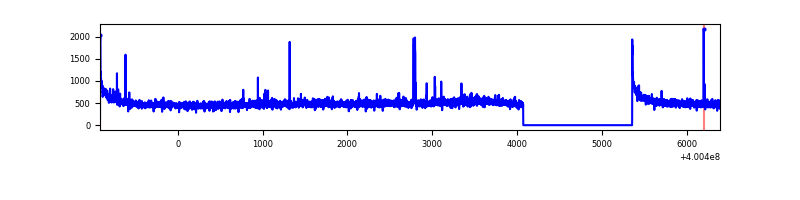 |
| B | 7306 | 6023 | 47 | 47 | 0.64% | 0.78% | 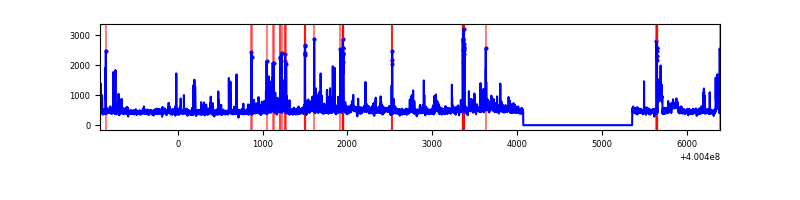 |
| C | 7306 | 6023 | 9 | 9 | 0.12% | 0.15% | 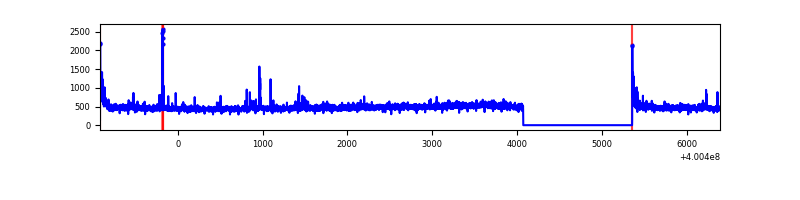 |
| D | 7305 | 6022 | 285 | 285 | 3.90% | 4.73% | 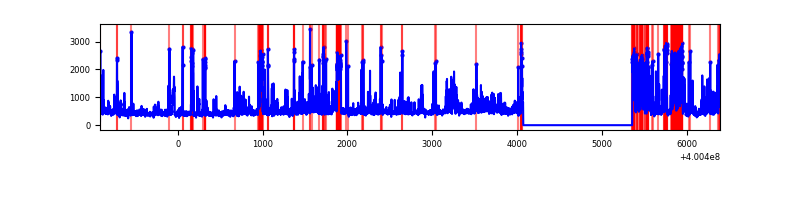 |
Top three noisy pixels from each quadrant. If the there are fewer than three noisy pixels in the level2.evt file, extra rows are filled as -1
| Pixel properties | Quadrant properties | ||||||
|---|---|---|---|---|---|---|---|
| Quadrant | DetID | PixID | Counts | Sigma | Mean | Median | Sigma |
| A | 10 | 83 | 347577 | 2553.71 | 668 | 654 | 135.9 |
| A | 12 | 189 | 31414 | 226.42 | 668 | 654 | 135.9 |
| A | 13 | 6 | 25943 | 186.15 | 668 | 654 | 135.9 |
| B | 0 | 213 | 157029 | 1226.17 | 664 | 646 | 127.5 |
| B | 5 | 200 | 146069 | 1140.24 | 664 | 646 | 127.5 |
| B | 5 | 255 | 124349 | 969.93 | 664 | 646 | 127.5 |
| C | 15 | 214 | 262365 | 1720.38 | 651 | 655 | 152.1 |
| C | 0 | 10 | 53792 | 349.3 | 651 | 655 | 152.1 |
| C | 14 | 254 | 52320 | 339.63 | 651 | 655 | 152.1 |
| D | 1 | 47 | 379884 | 2443.33 | 635 | 617 | 155.2 |
| D | 13 | 249 | 355306 | 2284.99 | 635 | 617 | 155.2 |
| D | 2 | 250 | 237982 | 1529.16 | 635 | 617 | 155.2 |
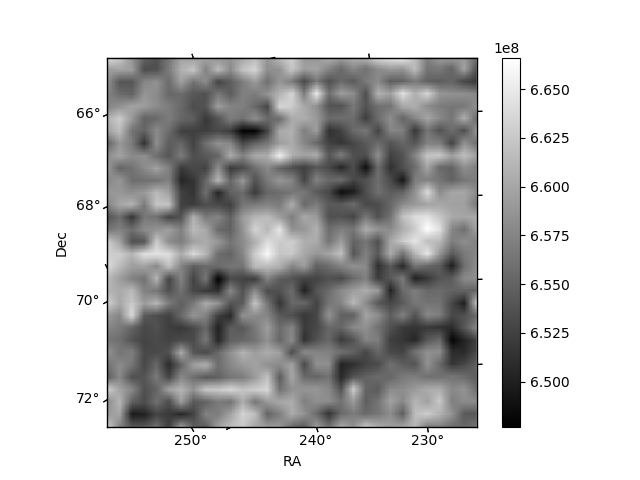
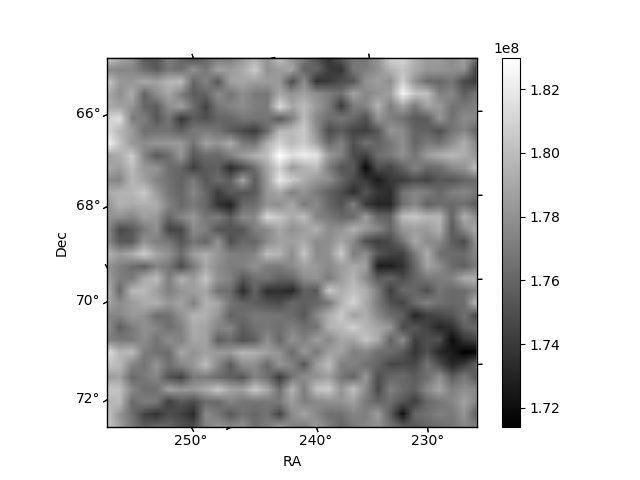
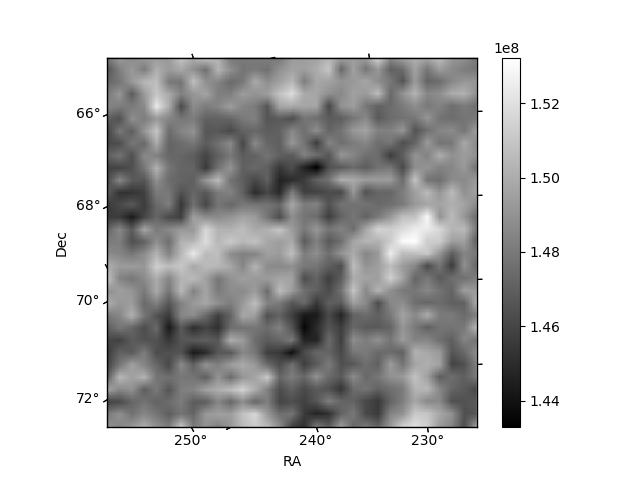
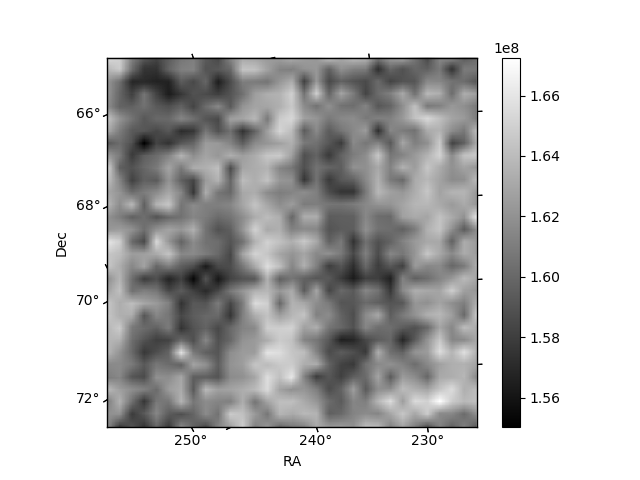
Histogram calculated using DETX and DETY for each event in the final _common_clean file
| Quadrant A | 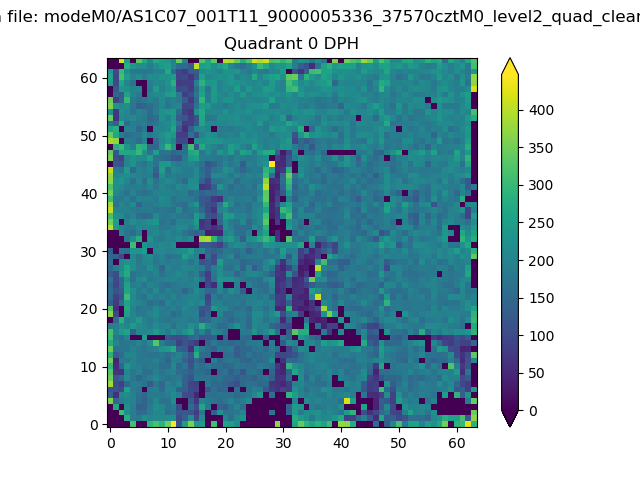 |
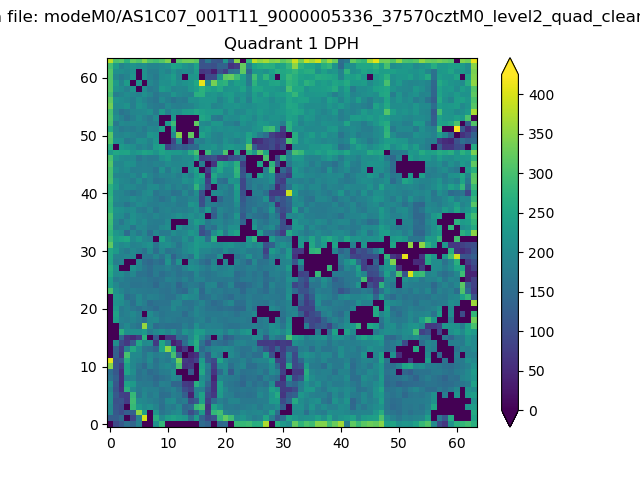 |
Quadrant B |
|---|---|---|---|
| Quadrant D | 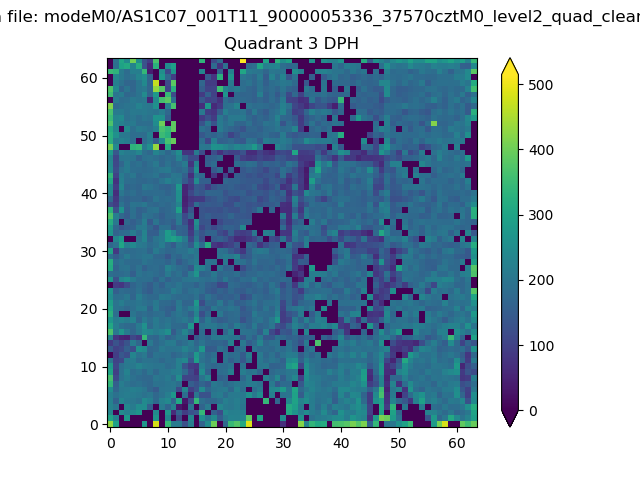 |
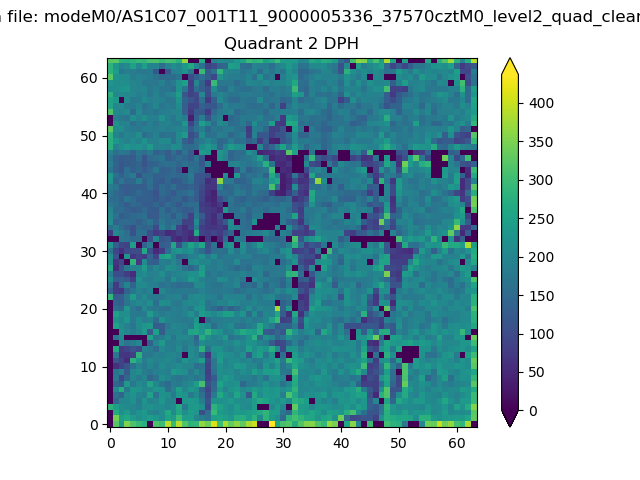 |
Quadrant C |
| Plot type | Count rate plots | Images |
|---|---|---|
| Comparison with Poisson distribution Blue bars denote a histogram of data divided into 1 sec bins. Red curve is a Poisson curve with rate = median count rate of data. |
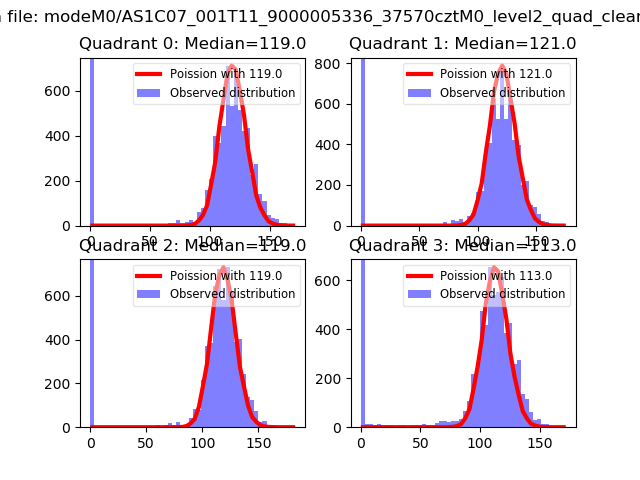 |
 |
| Quadrant-wise count rates Data is divided into 100 sec bins |
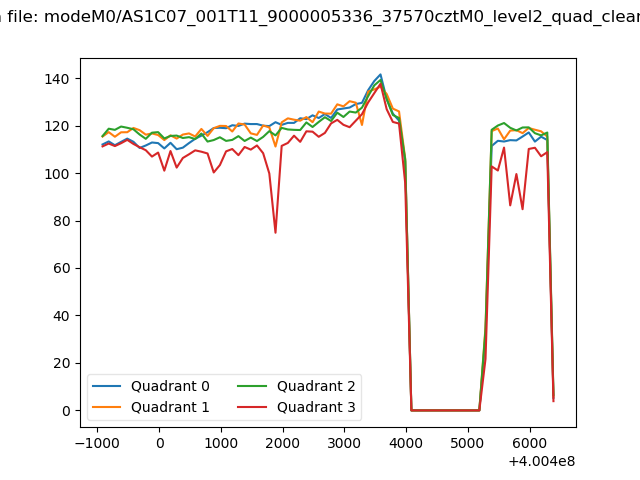 |
|
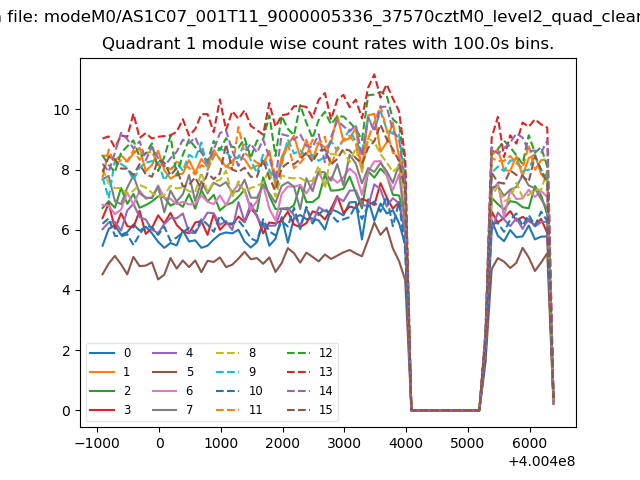
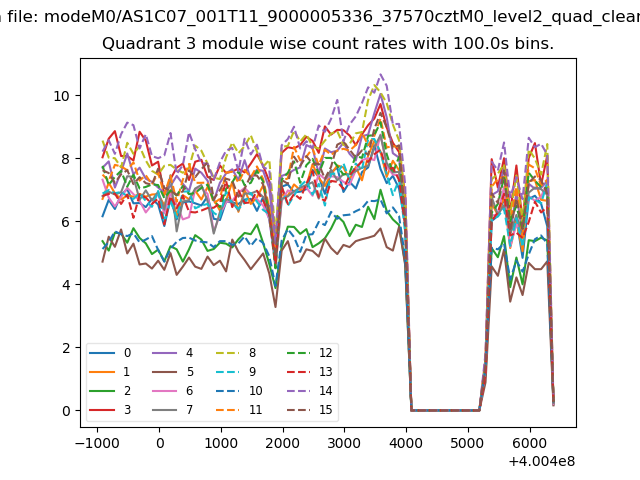
| Module-wise count rates for Quadrant A Data is divided into 100 sec bins |
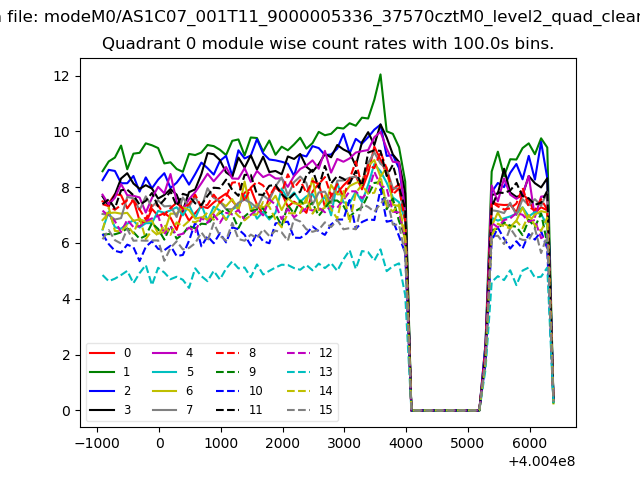 |
 |
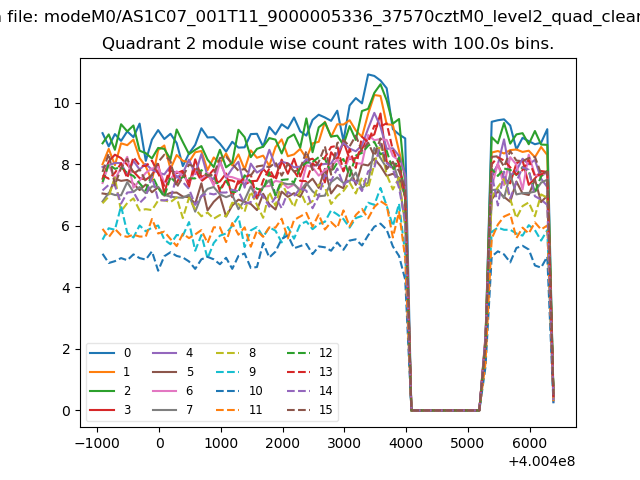
| Module-wise count rates for Quadrant B Data is divided into 100 sec bins |
 |
 |
| Module-wise count rates for Quadrant C Data is divided into 100 sec bins |
 |
 |
| Module-wise count rates for Quadrant D Data is divided into 100 sec bins |
 |
 |
| Parameter | Plot |
|---|---|
| CZT HV Monitor | 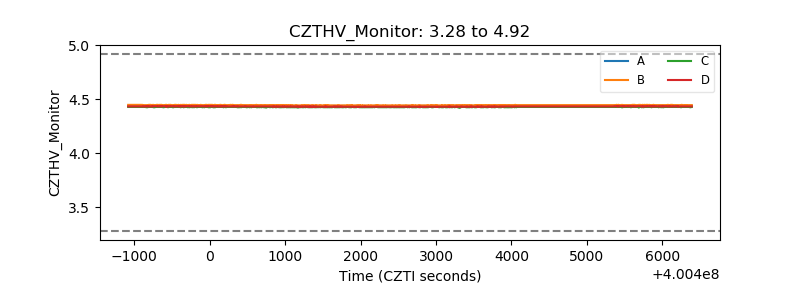 |
| D_VDD | 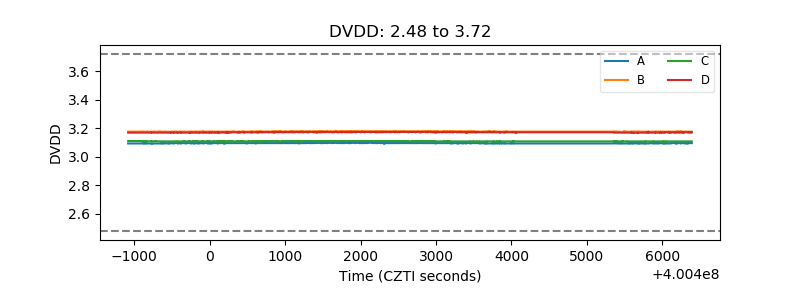 |
| Temperature 1 | 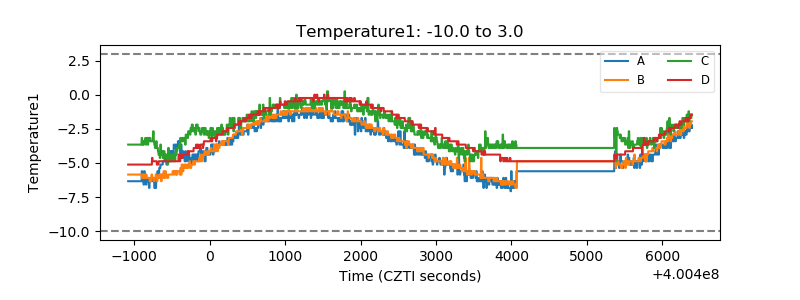 |
| Veto HV Monitor | 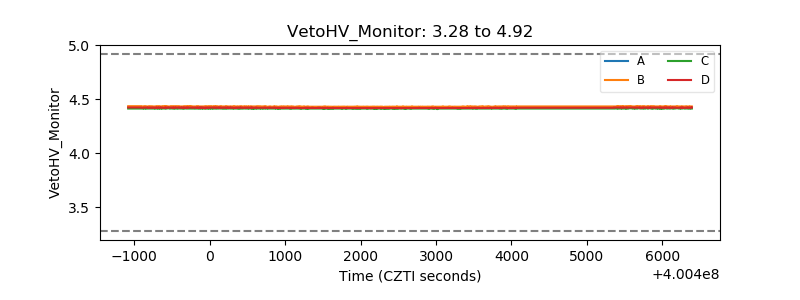 |
| Veto LLD | 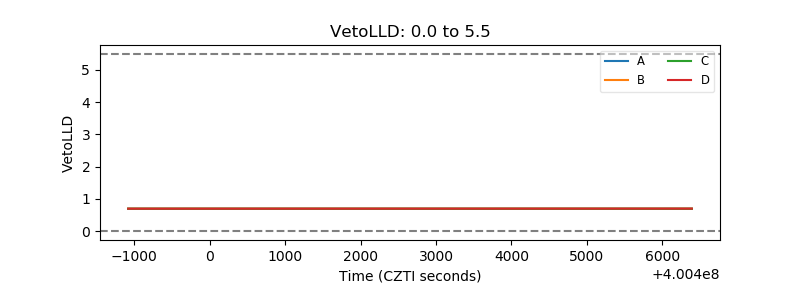 |
| Alpha Counter | 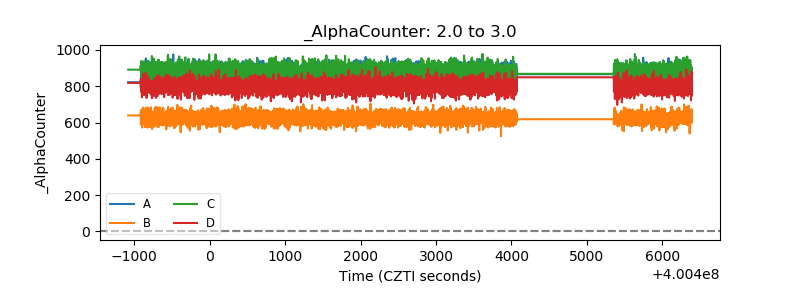 |
| _CPM_Rate | 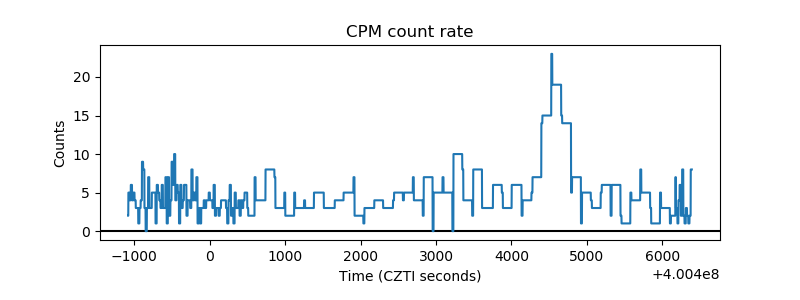 |
| CZT Counter | 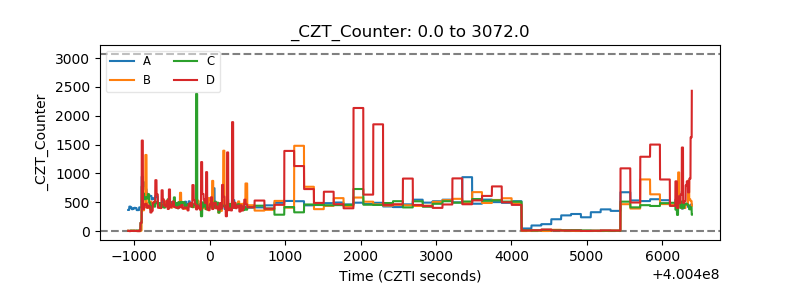 |
| +2.5 Volts monitor | 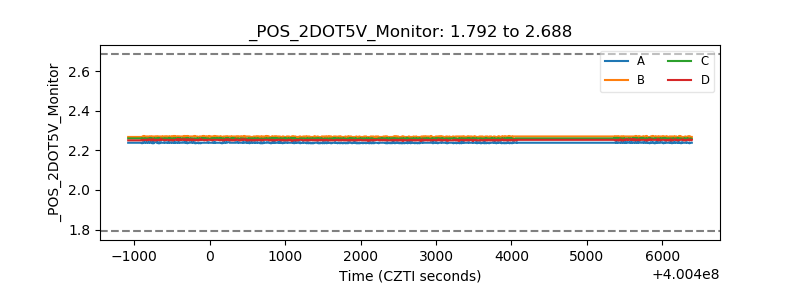 |
| +5 Volts monitor | 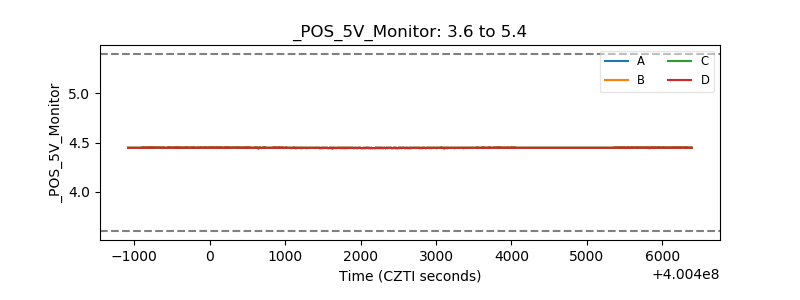 |
| _ROLL_ROT | 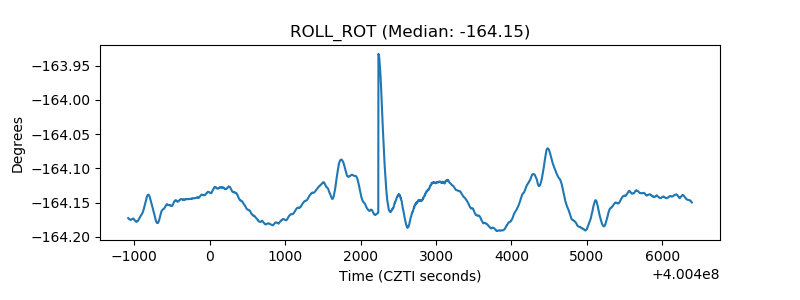 |
| _Roll_DEC | 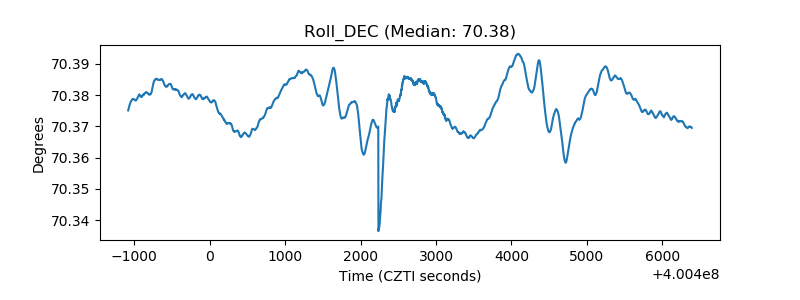 |
| _Roll_RA | 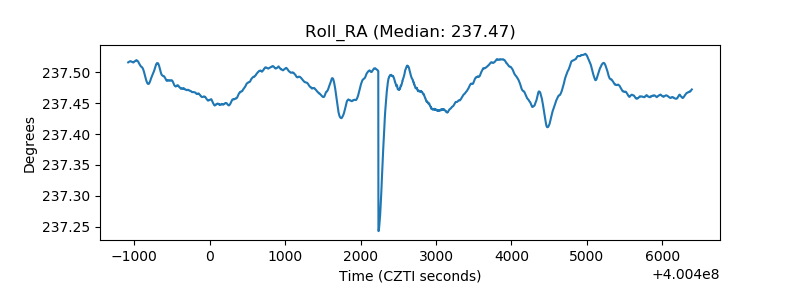 |
| Veto Counter | 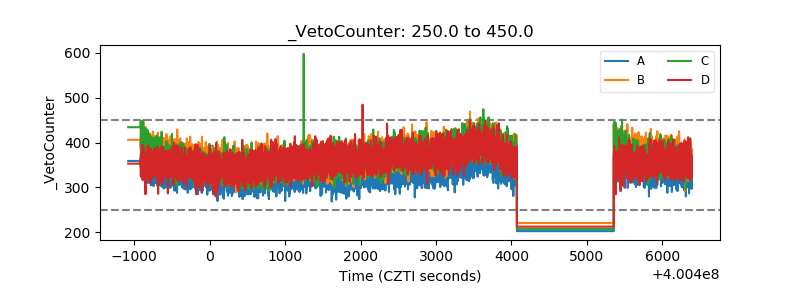 |