| Param | Original file | Final file |
|---|---|---|
| Filename | modeM0/AS1C07_001T11_9000005336_37572cztM0_level2.evt | modeM0/AS1C07_001T11_9000005336_37572cztM0_level2_quad_clean.evt |
| Size (bytes) | 207,345,600 | 35,447,040 |
| Size | 197.7 MB | 33.8 MB |
| Events in quadrant A | 1,051,990 | 240,581 |
| Events in quadrant B | 1,325,988 | 243,846 |
| Events in quadrant C | 983,513 | 243,010 |
| Events in quadrant D | 2,773,354 | 193,339 |
| Mode M0 | |||
|---|---|---|---|
| Quadrant | BADHDUFLAG | Total packets | Discarded packets |
| A | 0 | 4401 | 1 |
| B | 0 | 5357 | 1 |
| C | 0 | 4312 | 1 |
| D | 0 | 9698 | 1 |
| Mode M9 | |||
|---|---|---|---|
| Quadrant | BADHDUFLAG | Total packets | Discarded packets |
| A | 0 | 4 | 0 |
| B | 0 | 4 | 0 |
| C | 0 | 4 | 0 |
| D | 0 | 5 | 0 |
| Mode SS | |||
|---|---|---|---|
| Quadrant | BADHDUFLAG | Total packets | Discarded packets |
| A | 0 | 42 | 0 |
| B | 0 | 42 | 0 |
| C | 0 | 42 | 0 |
| D | 0 | 42 | 0 |
| Quadrant | Total seconds | Saturated seconds | Saturation percentage |
|---|---|---|---|
| A | 2095 | 8 | 0.381862% |
| B | 2095 | 70 | 3.341289% |
| C | 2095 | 4 | 0.190931% |
| D | 2095 | 660 | 31.503580% |
Noise dominated data is calculated using 1-second bins in cleaned event files. If a bin has >2000 counts, and if more than 50% of those come from <1% of pixels, then it is considered to be noise-dominated and hence unusable.
| Quadrant | # 1 sec bins | Bins with >0 counts | Bins with >2000 counts | High rate bins dominated by noise | Noise dominated (total time) | Noise dominated (detector-on time) | Marked lightcurve |
|---|---|---|---|---|---|---|---|
| A | 2095 | 2095 | 1 | 1 | 0.05% | 0.05% | 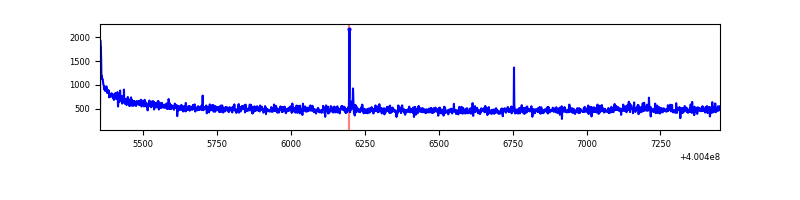 |
| B | 2095 | 2095 | 54 | 54 | 2.58% | 2.58% | 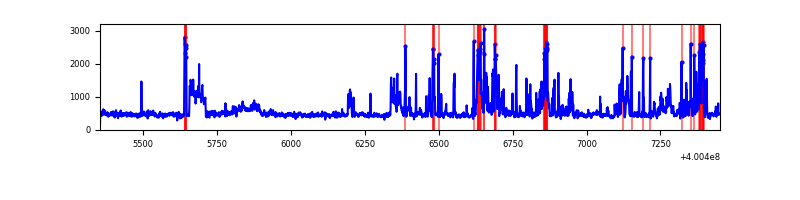 |
| C | 2095 | 2095 | 2 | 2 | 0.10% | 0.10% | 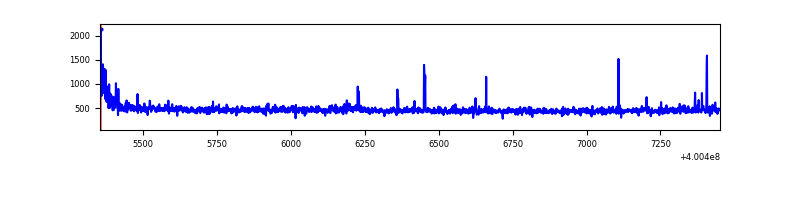 |
| D | 2095 | 2095 | 650 | 650 | 31.03% | 31.03% | 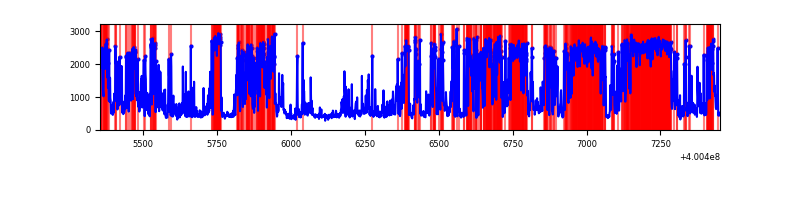 |
Top three noisy pixels from each quadrant. If the there are fewer than three noisy pixels in the level2.evt file, extra rows are filled as -1
| Pixel properties | Quadrant properties | ||||||
|---|---|---|---|---|---|---|---|
| Quadrant | DetID | PixID | Counts | Sigma | Mean | Median | Sigma |
| A | 10 | 83 | 136077 | 2849.09 | 229 | 225 | 47.7 |
| A | 12 | 189 | 10540 | 216.33 | 229 | 225 | 47.7 |
| A | 13 | 6 | 10428 | 213.98 | 229 | 225 | 47.7 |
| B | 5 | 172 | 175266 | 3862.01 | 224 | 217 | 45.3 |
| B | 5 | 200 | 87142 | 1917.78 | 224 | 217 | 45.3 |
| B | 5 | 255 | 68382 | 1503.89 | 224 | 217 | 45.3 |
| C | 15 | 214 | 91902 | 1775.02 | 217 | 217 | 51.7 |
| C | 0 | 10 | 25078 | 481.31 | 217 | 217 | 51.7 |
| C | 14 | 254 | 14757 | 281.49 | 217 | 217 | 51.7 |
| D | 1 | 47 | 980382 | 20190.71 | 190 | 184 | 48.5 |
| D | 13 | 171 | 498781 | 10270.4 | 190 | 184 | 48.5 |
| D | 13 | 249 | 180378 | 3711.74 | 190 | 184 | 48.5 |
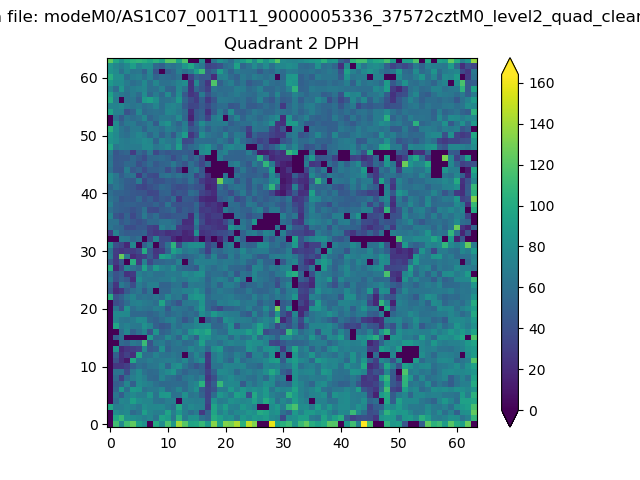
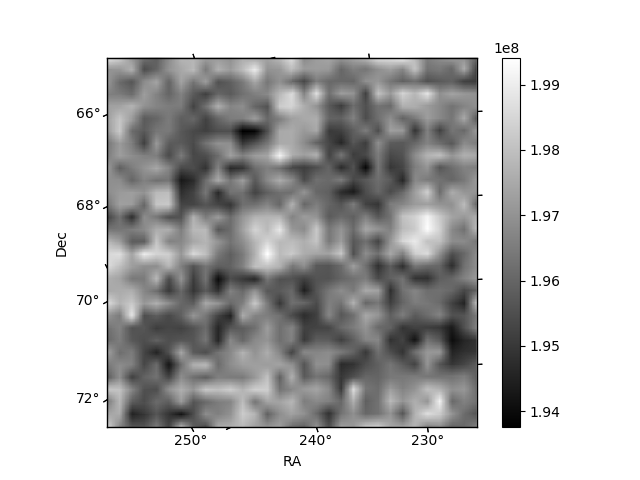
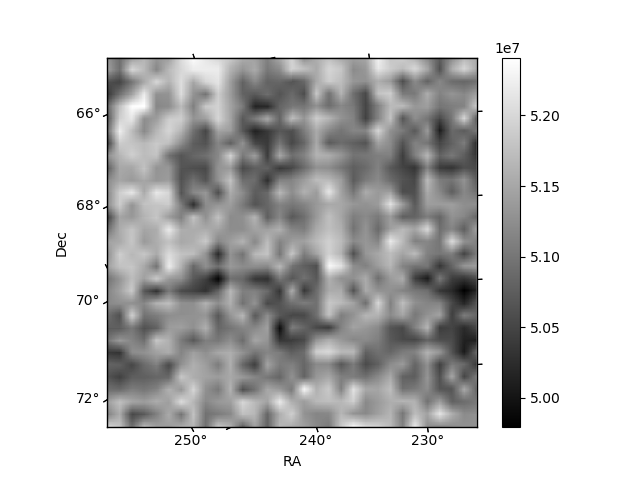
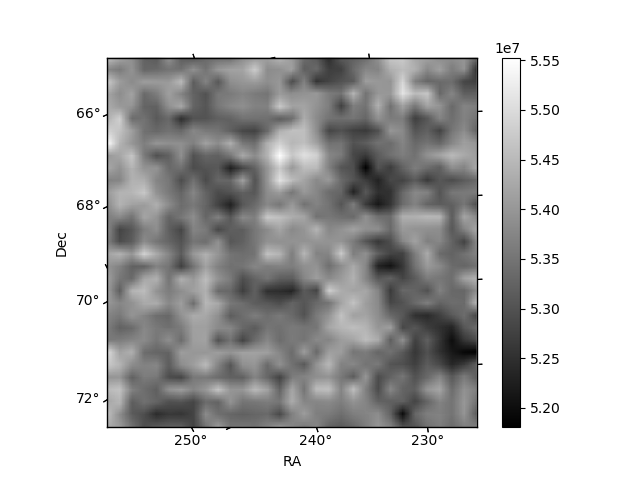
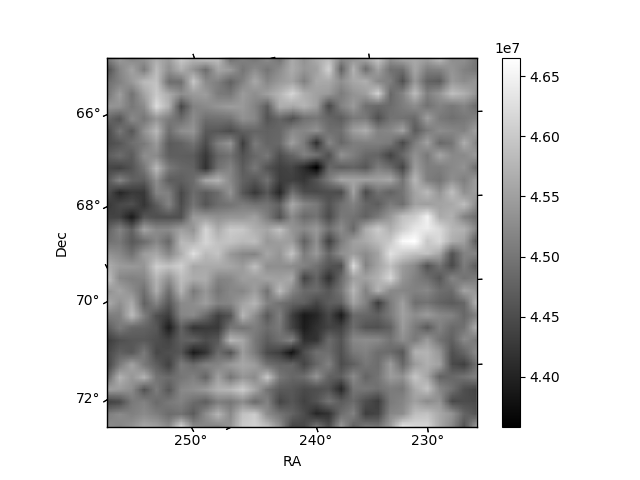
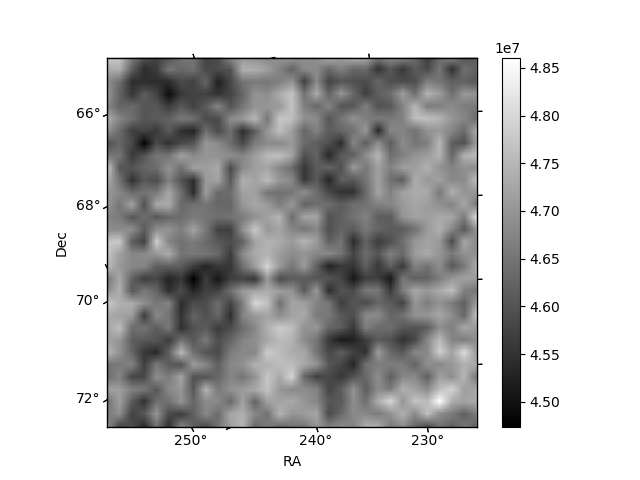
Histogram calculated using DETX and DETY for each event in the final _common_clean file
| Quadrant A | 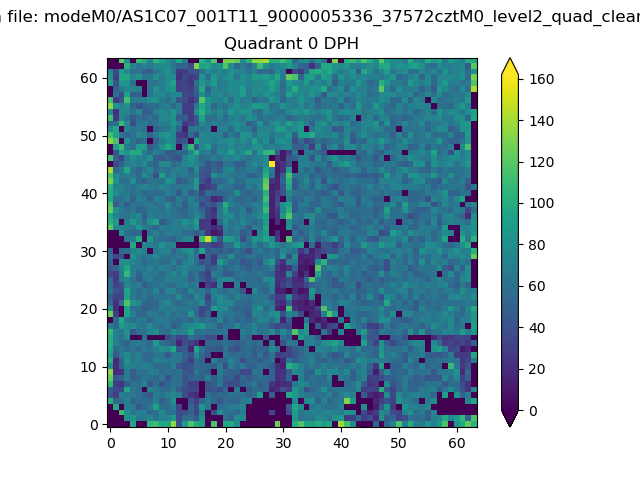 |
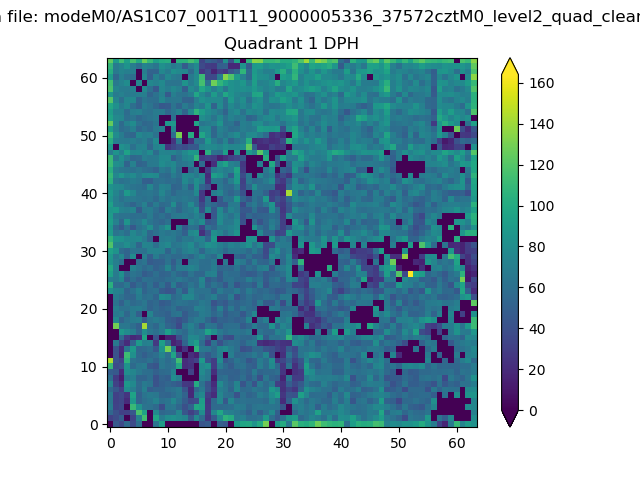 |
Quadrant B |
|---|---|---|---|
| Quadrant D | 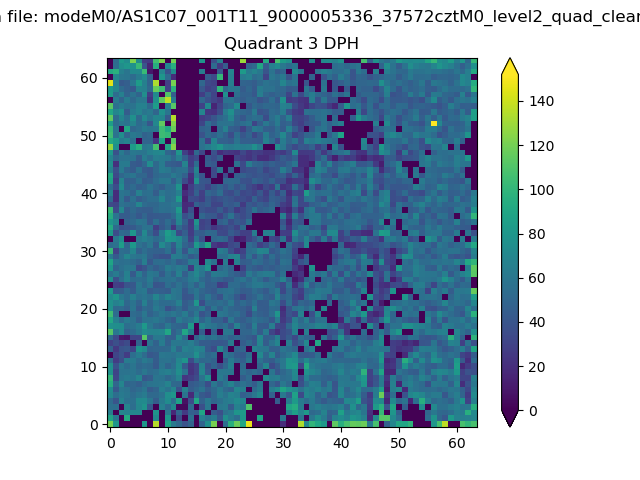 |
 |
Quadrant C |
| Plot type | Count rate plots | Images |
|---|---|---|
| Comparison with Poisson distribution Blue bars denote a histogram of data divided into 1 sec bins. Red curve is a Poisson curve with rate = median count rate of data. |
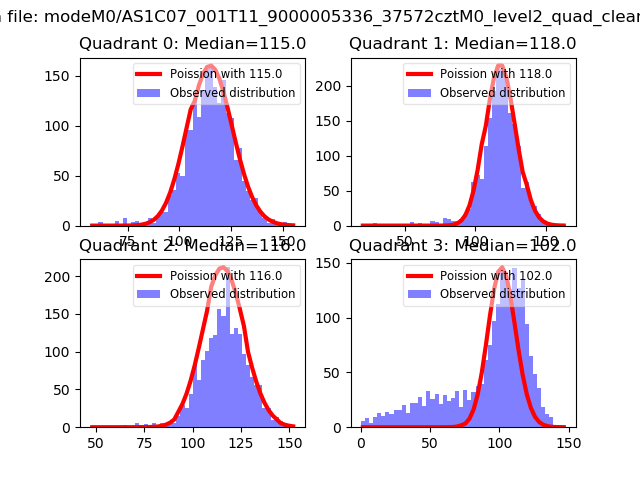 |
 |
| Quadrant-wise count rates Data is divided into 100 sec bins |
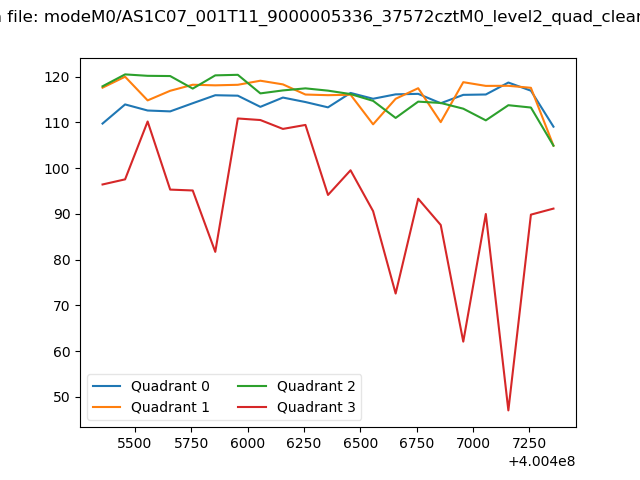 |
|
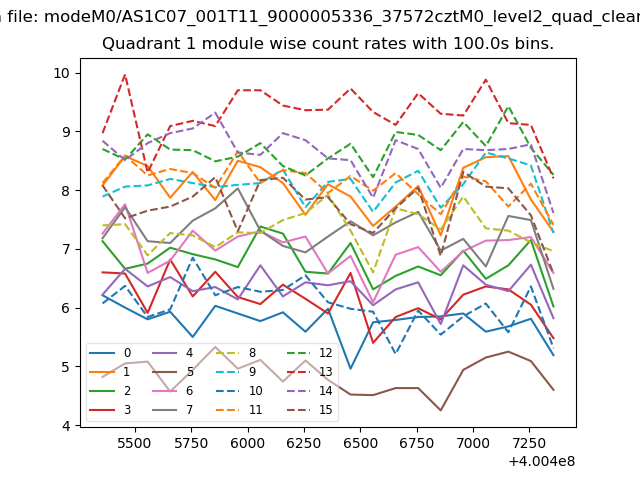
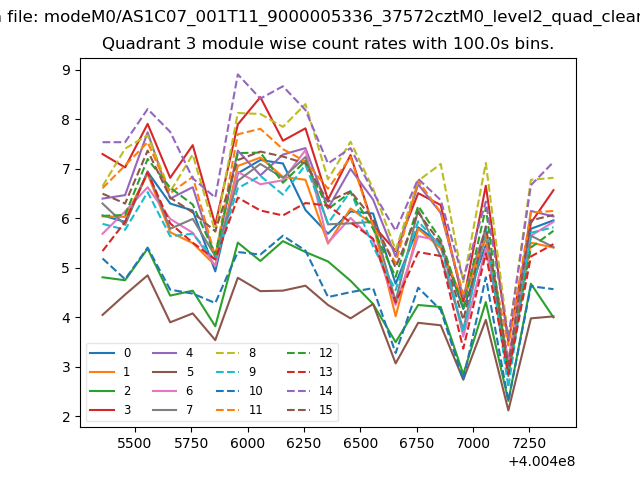
| Module-wise count rates for Quadrant A Data is divided into 100 sec bins |
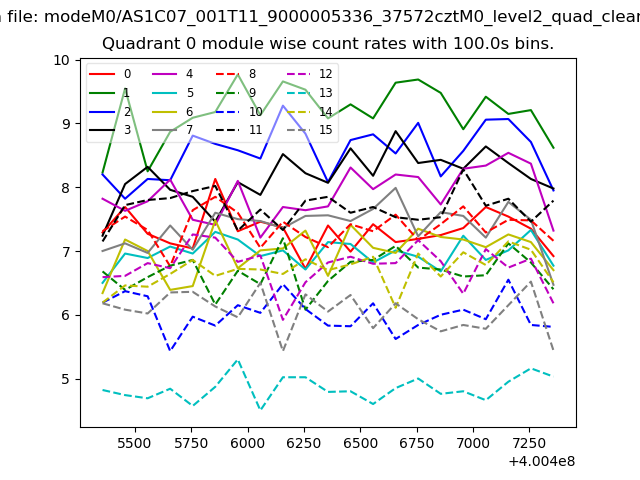 |
 |
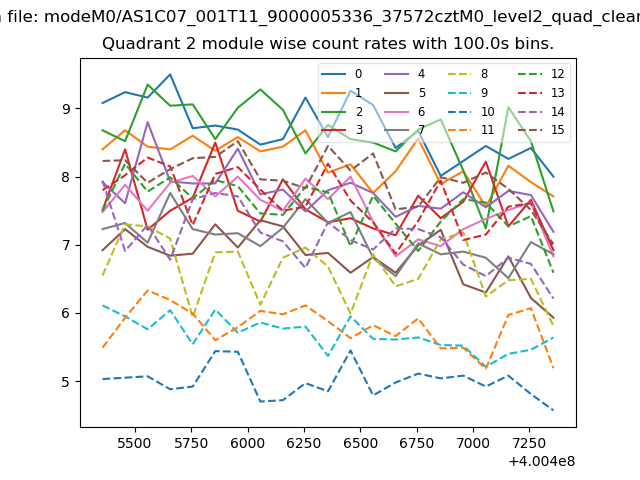
| Module-wise count rates for Quadrant B Data is divided into 100 sec bins |
 |
 |
| Module-wise count rates for Quadrant C Data is divided into 100 sec bins |
 |
 |
| Module-wise count rates for Quadrant D Data is divided into 100 sec bins |
 |
 |
| Parameter | Plot |
|---|---|
| CZT HV Monitor |  |
| D_VDD | 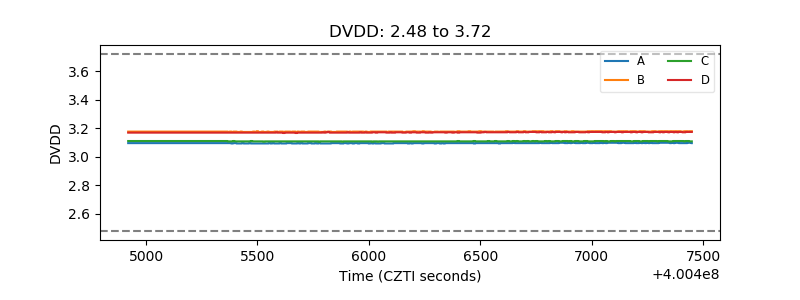 |
| Temperature 1 | 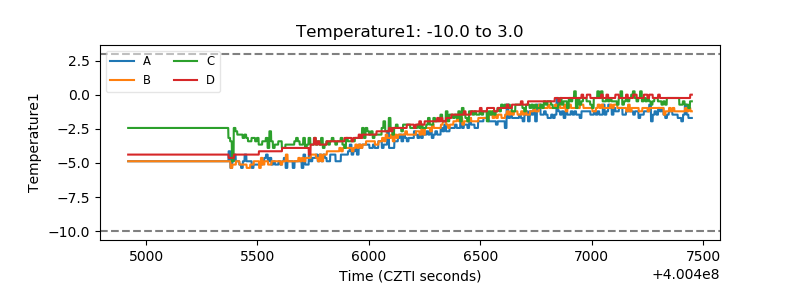 |
| Veto HV Monitor | 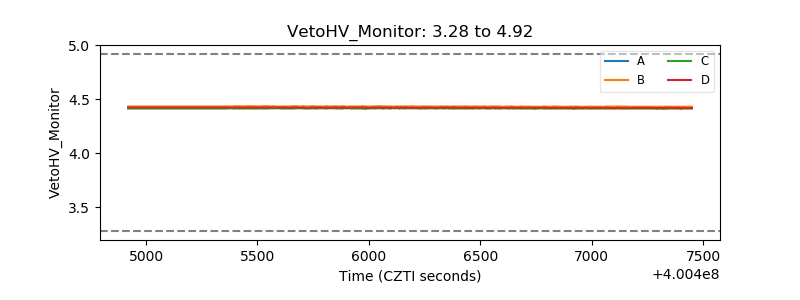 |
| Veto LLD | 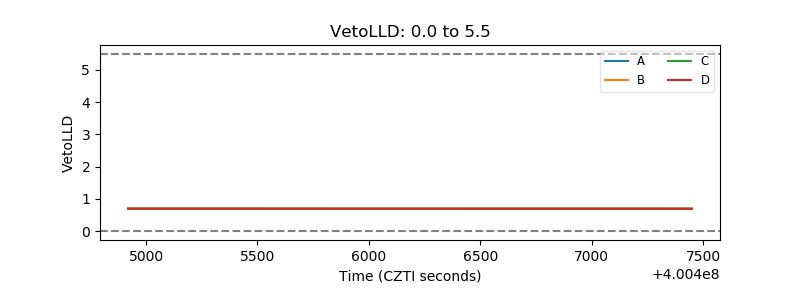 |
| Alpha Counter | 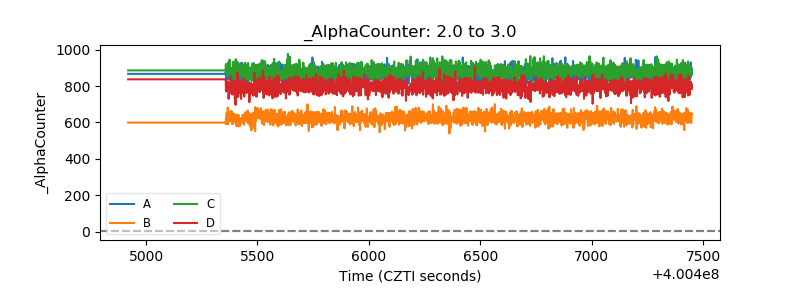 |
| _CPM_Rate | 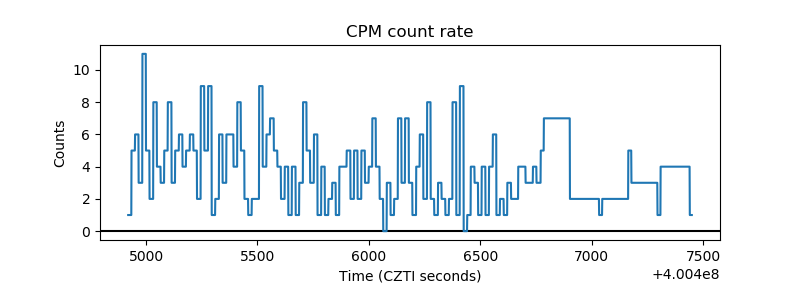 |
| CZT Counter | 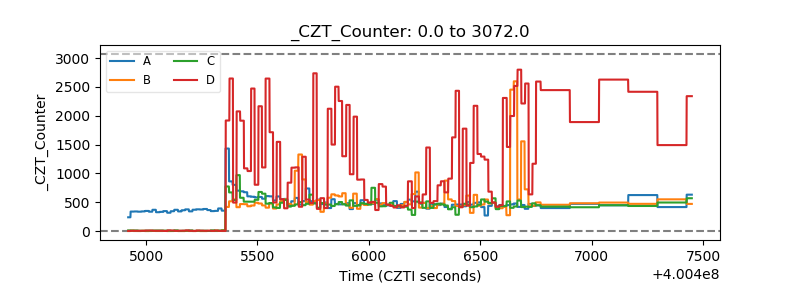 |
| +2.5 Volts monitor | 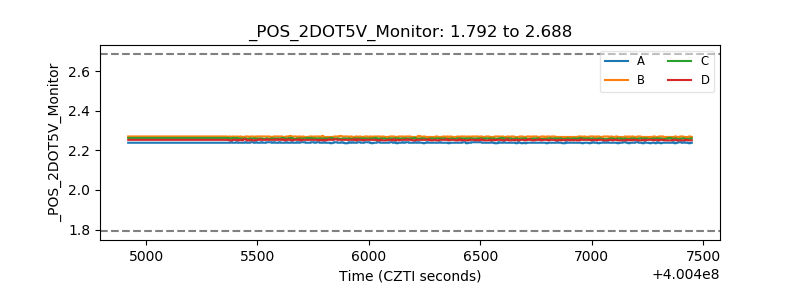 |
| +5 Volts monitor | 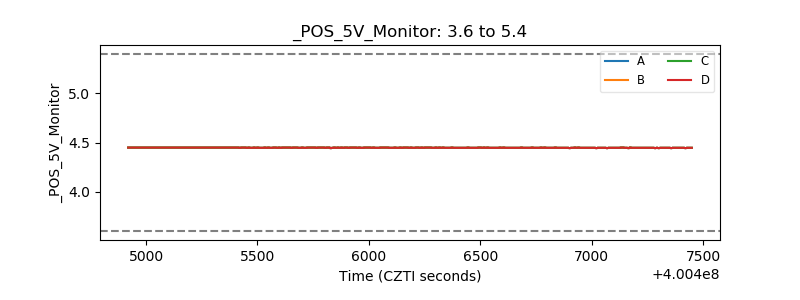 |
| _ROLL_ROT | 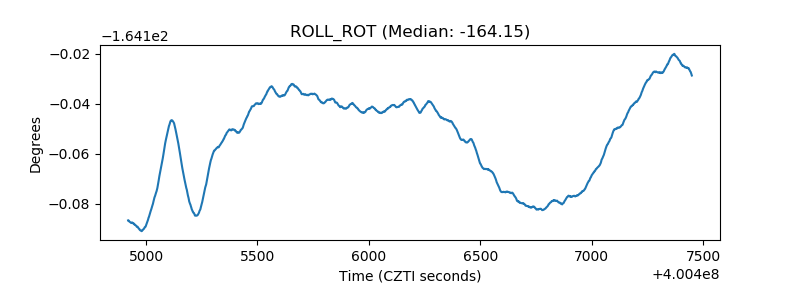 |
| _Roll_DEC | 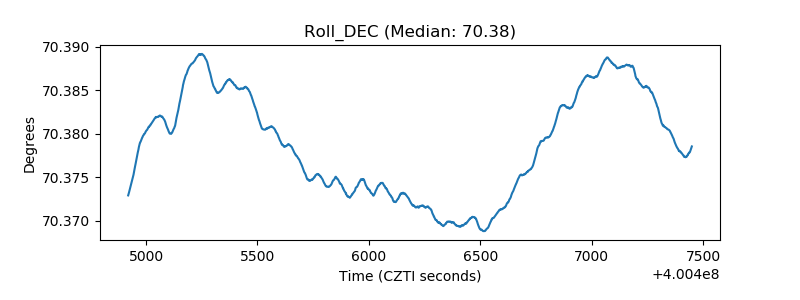 |
| _Roll_RA | 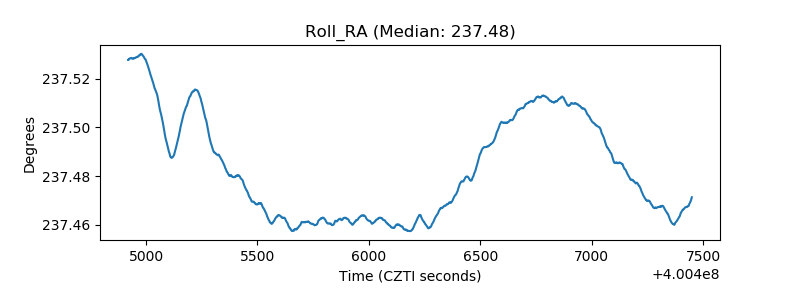 |
| Veto Counter | 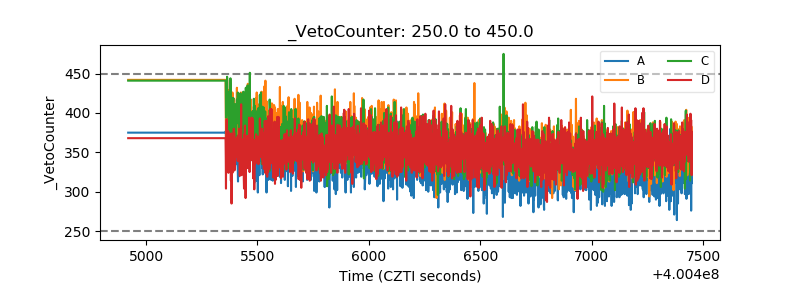 |