| Param | Original file | Final file |
|---|---|---|
| Filename | modeM0/AS1T05_053T01_9000005338cztM0_level2.fits | modeM0/AS1T05_053T01_9000005338cztM0_level2_quad_clean.evt |
| Size (bytes) | 1,314,414,720 | 1,389,591,360 |
| Size | 1.2 GB | 1.3 GB |
| Events in quadrant A | 7,968,608 | 8,478,975 |
| Events in quadrant B | 7,525,520 | 8,221,832 |
| Events in quadrant C | 7,828,104 | 8,294,002 |
| Events in quadrant D | 6,603,150 | 7,212,739 |
| Mode SS | |||
|---|---|---|---|
| Quadrant | BADHDUFLAG | Total packets | Discarded packets |
| A | 0 | 2944 | 0 |
| B | 0 | 2944 | 0 |
| C | 0 | 2944 | 0 |
| D | 0 | 2944 | 0 |
| Mode M0 | |||
|---|---|---|---|
| Quadrant | BADHDUFLAG | Total packets | Discarded packets |
| A | 0 | 314580 | 0 |
| B | 0 | 352060 | 0 |
| C | 0 | 302438 | 0 |
| D | 0 | 389530 | 0 |
| Mode M9 | |||
|---|---|---|---|
| Quadrant | BADHDUFLAG | Total packets | Discarded packets |
| A | 0 | 544 | 0 |
| B | 0 | 544 | 0 |
| C | 0 | 544 | 0 |
| D | 0 | 544 | 0 |
| Quadrant | Total seconds | Saturated seconds | Saturation percentage |
|---|---|---|---|
| A | 144185 | 744 | 0.516004% |
| B | 144186 | 4852 | 3.365098% |
| C | 144186 | 683 | 0.473694% |
| D | 144186 | 7202 | 4.994937% |
Noise dominated data is calculated using 1-second bins in cleaned event files. If a bin has >2000 counts, and if more than 50% of those come from <1% of pixels, then it is considered to be noise-dominated and hence unusable.
| Quadrant | # 1 sec bins | Bins with >0 counts | Bins with >2000 counts | High rate bins dominated by noise | Noise dominated (total time) | Noise dominated (detector-on time) | Marked lightcurve |
|---|---|---|---|---|---|---|---|
| A | 198466 | 144161 | 0 | 0 | 0.00% | 0.00% | 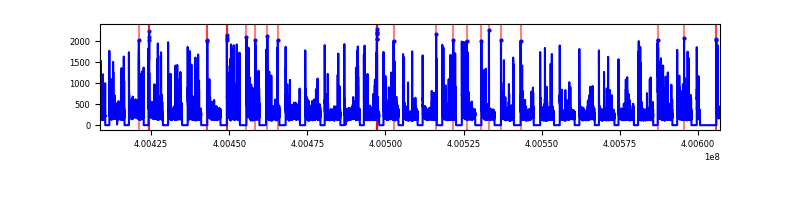 |
| B | 198466 | 144107 | 0 | 0 | 0.00% | 0.00% |  |
| C | 198466 | 144167 | 0 | 0 | 0.00% | 0.00% |  |
| D | 198466 | 143952 | 0 | 0 | 0.00% | 0.00% | 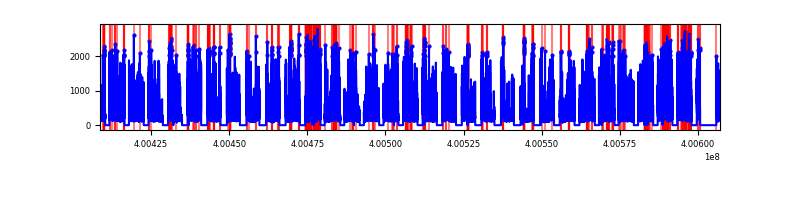 |
Top three noisy pixels from each quadrant. If the there are fewer than three noisy pixels in the level2.evt file, extra rows are filled as -1
| Pixel properties | Quadrant properties | ||||||
|---|---|---|---|---|---|---|---|
| Quadrant | DetID | PixID | Counts | Sigma | Mean | Median | Sigma |
| A | 0 | 29 | 6691 | 9.16 | 2082 | 1951 | 517.3 |
| A | 7 | 110 | 6601 | 8.99 | 2082 | 1951 | 517.3 |
| A | 9 | 19 | 6497 | 8.79 | 2082 | 1951 | 517.3 |
| B | 2 | 9 | 6675 | 12.43 | 1997 | 1908 | 383.4 |
| B | 3 | 80 | 5971 | 10.6 | 1997 | 1908 | 383.4 |
| B | 2 | 8 | 5299 | 8.84 | 1997 | 1908 | 383.4 |
| C | 1 | 81 | 6709 | 9.1 | 2068 | 1937 | 524.7 |
| C | 1 | 80 | 6511 | 8.72 | 2068 | 1937 | 524.7 |
| C | 3 | 203 | 6336 | 8.38 | 2068 | 1937 | 524.7 |
| D | 4 | 160 | 4923 | 6.31 | 1892 | 1719 | 507.6 |
| D | 7 | 3 | 4855 | 6.18 | 1892 | 1719 | 507.6 |
| D | 10 | 189 | 4763 | 6.0 | 1892 | 1719 | 507.6 |
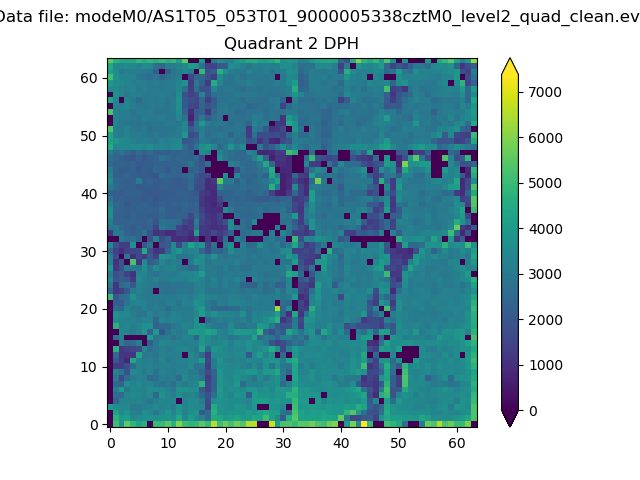
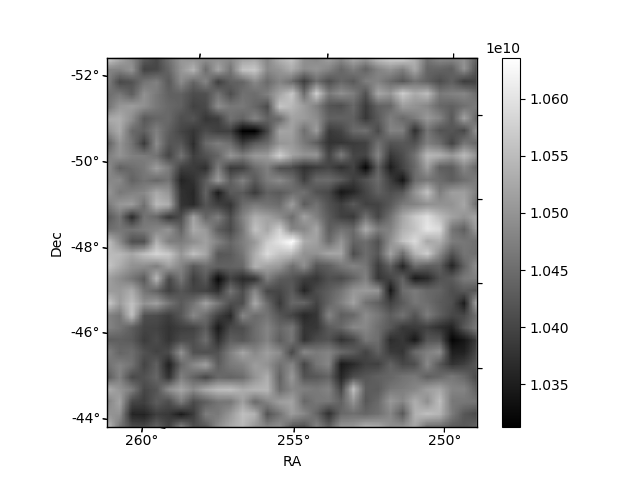
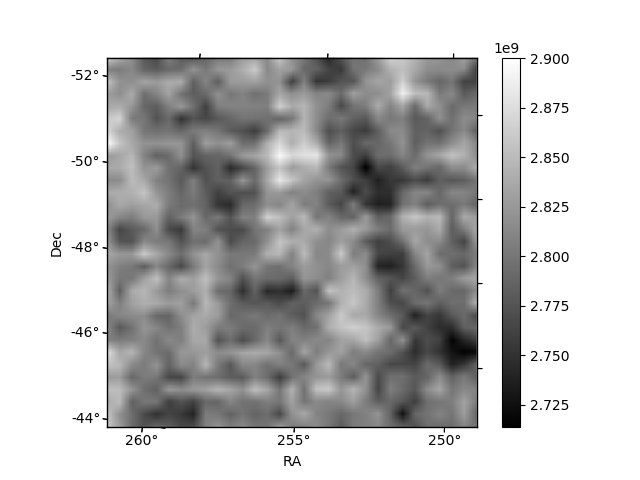
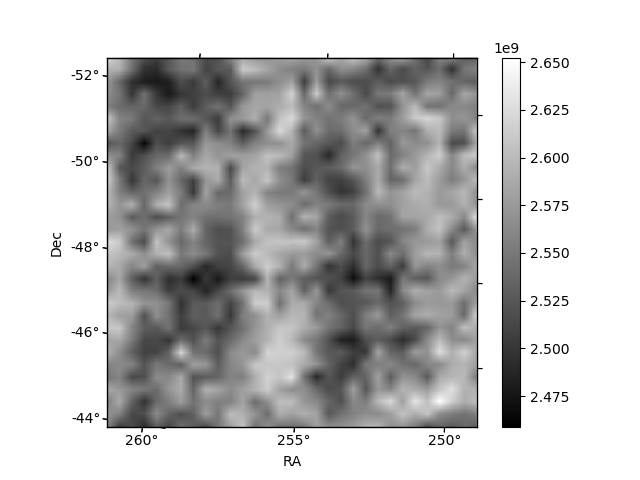
Histogram calculated using DETX and DETY for each event in the final _common_clean file
| Quadrant A | 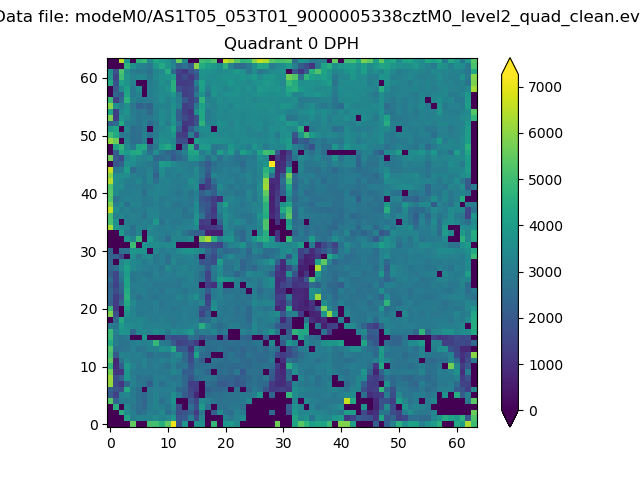 |
 |
Quadrant B |
|---|---|---|---|
| Quadrant D |  |
 |
Quadrant C |
| Plot type | Count rate plots | Images |
|---|---|---|
| Comparison with Poisson distribution Blue bars denote a histogram of data divided into 1 sec bins. Red curve is a Poisson curve with rate = median count rate of data. |
 |
 |
| Quadrant-wise count rates Data is divided into 100 sec bins |
 |
|
| Module-wise count rates for Quadrant A Data is divided into 100 sec bins |
 |
 |
| Module-wise count rates for Quadrant B Data is divided into 100 sec bins |
 |
 |
| Module-wise count rates for Quadrant C Data is divided into 100 sec bins |
 |
 |
| Module-wise count rates for Quadrant D Data is divided into 100 sec bins |
 |
 |
| Parameter | Plot |
|---|---|
| CZT HV Monitor | 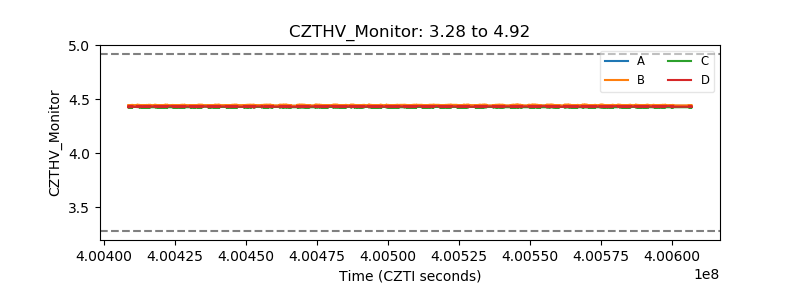 |
| D_VDD |  |
| Temperature 1 |  |
| Veto HV Monitor |  |
| Veto LLD |  |
| Alpha Counter |  |
| _CPM_Rate | 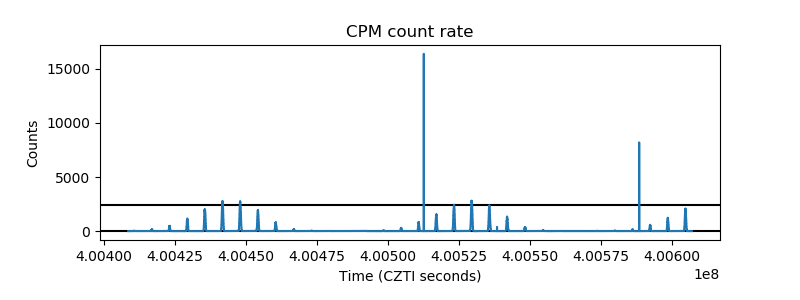 |
| CZT Counter |  |
| +2.5 Volts monitor |  |
| +5 Volts monitor |  |
| _ROLL_ROT |  |
| _Roll_DEC |  |
| _Roll_RA | 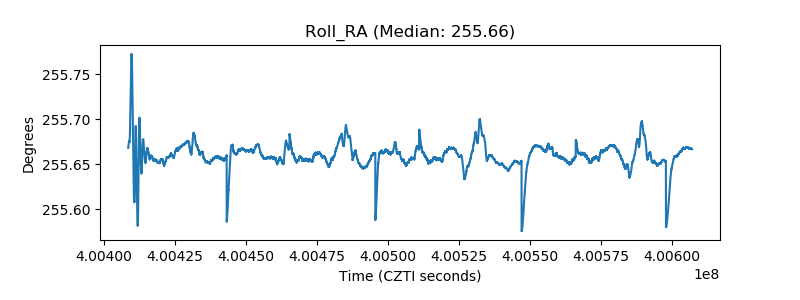 |
| Veto Counter |  |