| Param | Original file | Final file |
|---|---|---|
| Filename | modeM0/AS1T05_053T01_9000005338_37572cztM0_level2.evt | modeM0/AS1T05_053T01_9000005338_37572cztM0_level2_quad_clean.evt |
| Size (bytes) | 334,157,760 | 65,223,360 |
| Size | 318.7 MB | 62.2 MB |
| Events in quadrant A | 2,281,195 | 418,662 |
| Events in quadrant B | 2,279,699 | 425,219 |
| Events in quadrant C | 2,111,663 | 428,913 |
| Events in quadrant D | 3,154,896 | 399,785 |
| Mode SS | |||
|---|---|---|---|
| Quadrant | BADHDUFLAG | Total packets | Discarded packets |
| A | 0 | 86 | 0 |
| B | 0 | 86 | 0 |
| C | 0 | 86 | 0 |
| D | 0 | 86 | 0 |
| Mode M0 | |||
|---|---|---|---|
| Quadrant | BADHDUFLAG | Total packets | Discarded packets |
| A | 0 | 9179 | 4 |
| B | 0 | 9524 | 1 |
| C | 0 | 8878 | 1 |
| D | 0 | 12287 | 1 |
| Mode M9 | |||
|---|---|---|---|
| Quadrant | BADHDUFLAG | Total packets | Discarded packets |
| A | 0 | 14 | 0 |
| B | 0 | 14 | 0 |
| C | 0 | 14 | 0 |
| D | 0 | 14 | 0 |
| Quadrant | Total seconds | Saturated seconds | Saturation percentage |
|---|---|---|---|
| A | 4300 | 12 | 0.279070% |
| B | 4301 | 37 | 0.860265% |
| C | 4301 | 8 | 0.186003% |
| D | 4301 | 215 | 4.998837% |
Noise dominated data is calculated using 1-second bins in cleaned event files. If a bin has >2000 counts, and if more than 50% of those come from <1% of pixels, then it is considered to be noise-dominated and hence unusable.
| Quadrant | # 1 sec bins | Bins with >0 counts | Bins with >2000 counts | High rate bins dominated by noise | Noise dominated (total time) | Noise dominated (detector-on time) | Marked lightcurve |
|---|---|---|---|---|---|---|---|
| A | 5644 | 4302 | 3 | 3 | 0.05% | 0.07% | 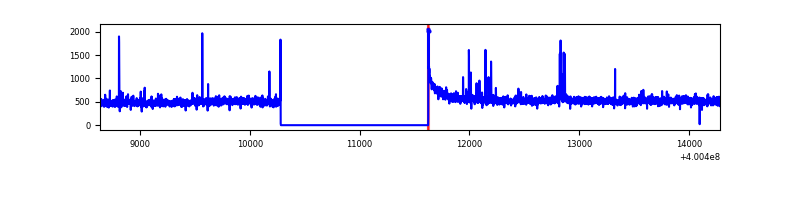 |
| B | 5644 | 4302 | 25 | 25 | 0.44% | 0.58% | 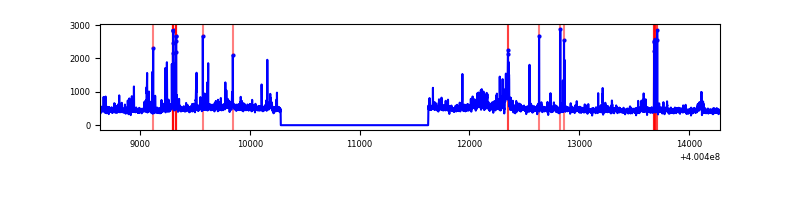 |
| C | 5644 | 4302 | 5 | 5 | 0.09% | 0.12% | 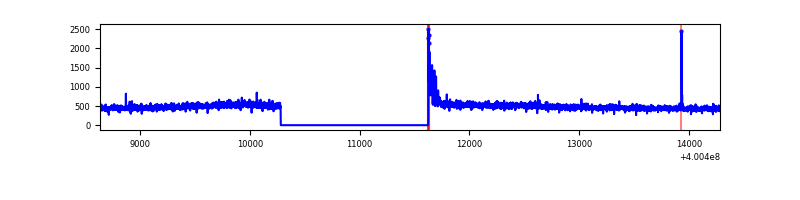 |
| D | 5644 | 4302 | 193 | 193 | 3.42% | 4.49% | 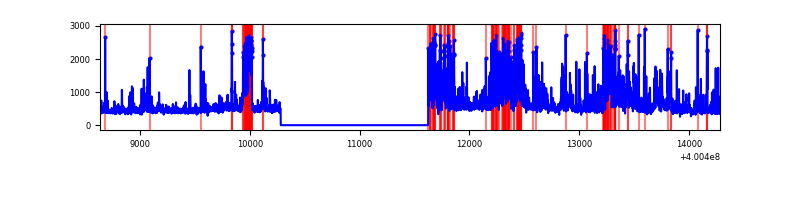 |
Top three noisy pixels from each quadrant. If the there are fewer than three noisy pixels in the level2.evt file, extra rows are filled as -1
| Pixel properties | Quadrant properties | ||||||
|---|---|---|---|---|---|---|---|
| Quadrant | DetID | PixID | Counts | Sigma | Mean | Median | Sigma |
| A | 10 | 83 | 230893 | 2295.79 | 490 | 482 | 100.4 |
| A | 15 | 222 | 70948 | 702.12 | 490 | 482 | 100.4 |
| A | 12 | 189 | 30950 | 303.58 | 490 | 482 | 100.4 |
| B | 5 | 172 | 111546 | 1176.86 | 487 | 475 | 94.4 |
| B | 5 | 255 | 50745 | 532.64 | 487 | 475 | 94.4 |
| B | 0 | 197 | 38960 | 407.77 | 487 | 475 | 94.4 |
| C | 15 | 214 | 182340 | 1609.6 | 477 | 479 | 113.0 |
| C | 0 | 10 | 48263 | 422.92 | 477 | 479 | 113.0 |
| C | 15 | 159 | 6201 | 50.64 | 477 | 479 | 113.0 |
| D | 1 | 47 | 421560 | 3570.16 | 469 | 455 | 118.0 |
| D | 12 | 233 | 239640 | 2027.83 | 469 | 455 | 118.0 |
| D | 2 | 153 | 168677 | 1426.2 | 469 | 455 | 118.0 |
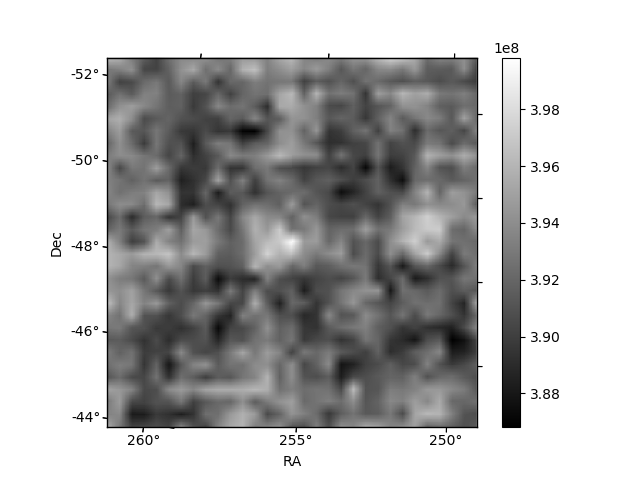
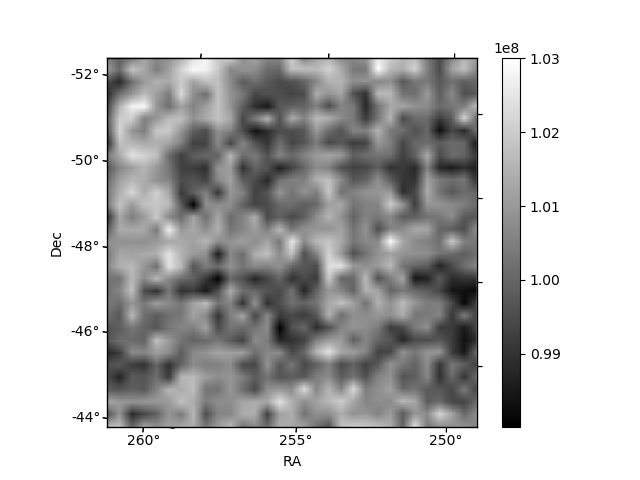
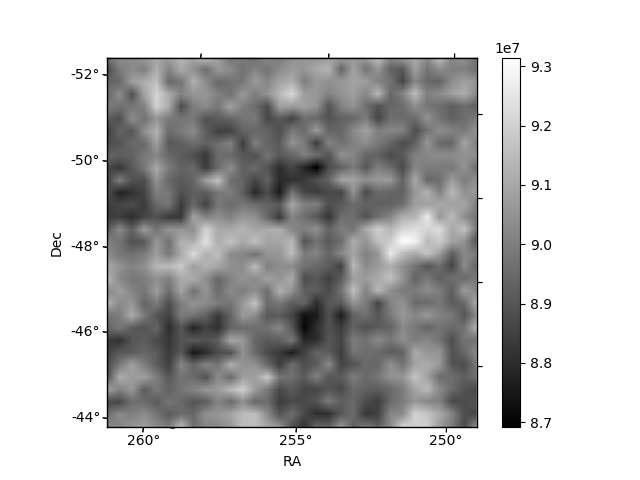
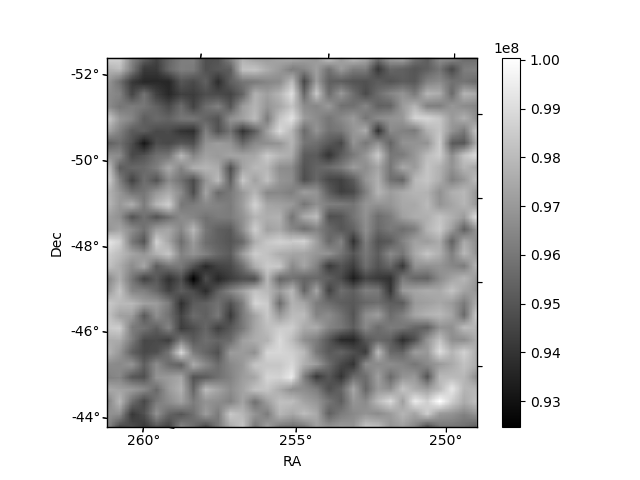
Histogram calculated using DETX and DETY for each event in the final _common_clean file
| Quadrant A | 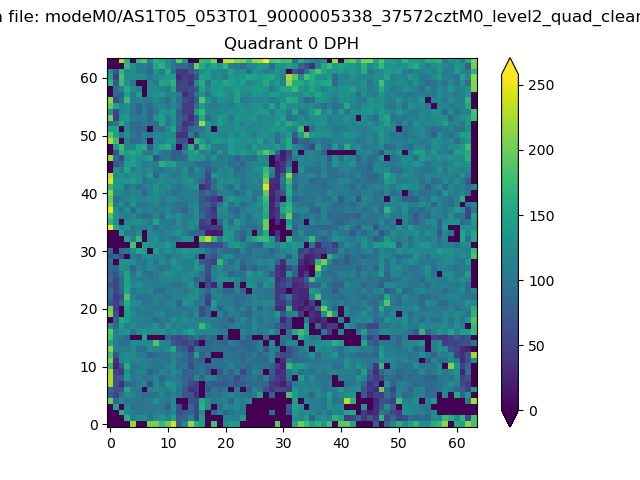 |
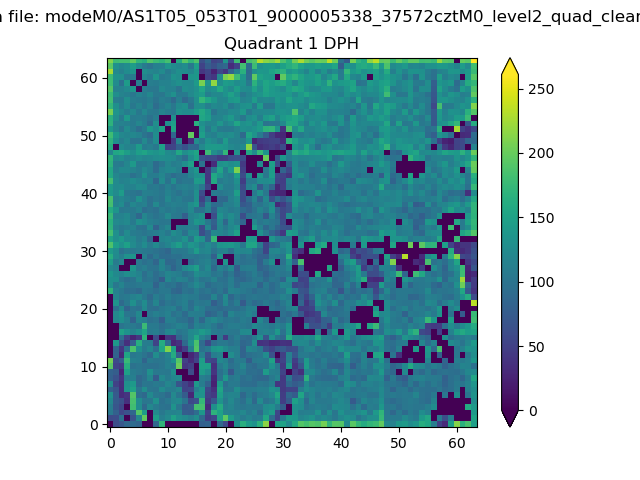 |
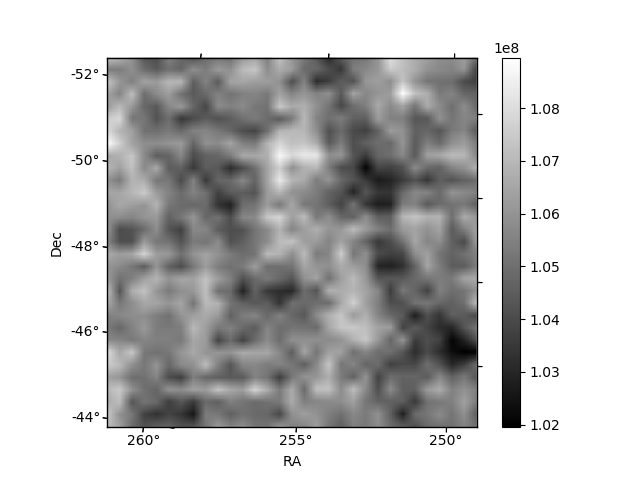
Quadrant B |
|---|---|---|---|
| Quadrant D | 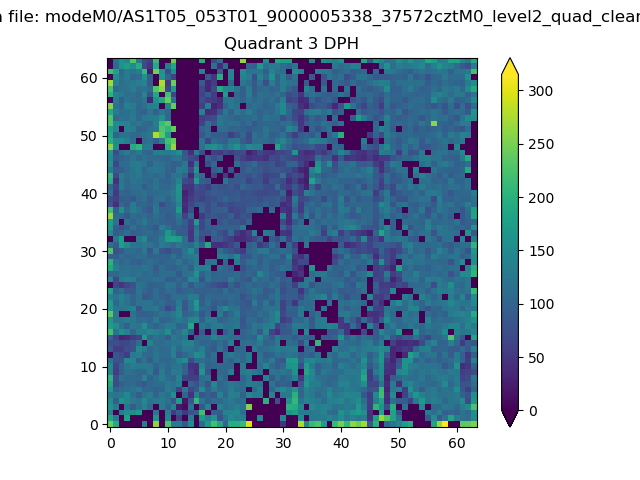 |
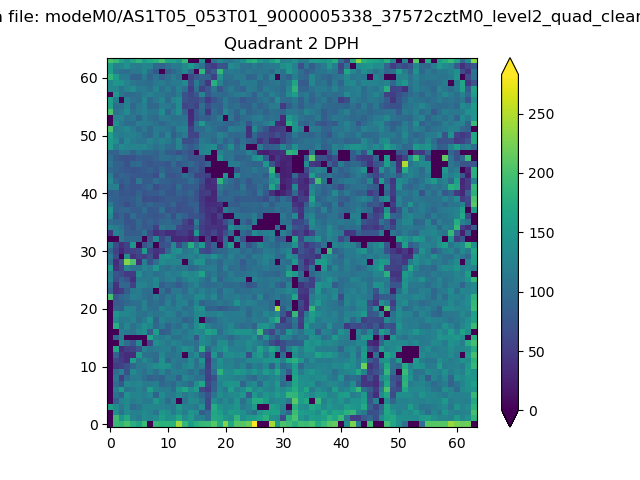 |
Quadrant C |
| Plot type | Count rate plots | Images |
|---|---|---|
| Comparison with Poisson distribution Blue bars denote a histogram of data divided into 1 sec bins. Red curve is a Poisson curve with rate = median count rate of data. |
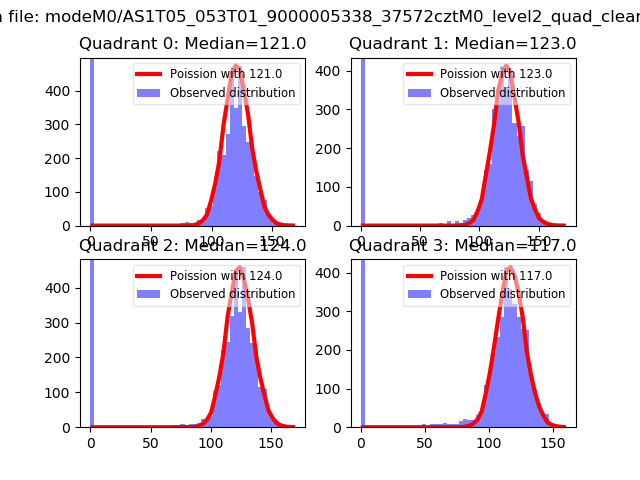 |
 |
| Quadrant-wise count rates Data is divided into 100 sec bins |
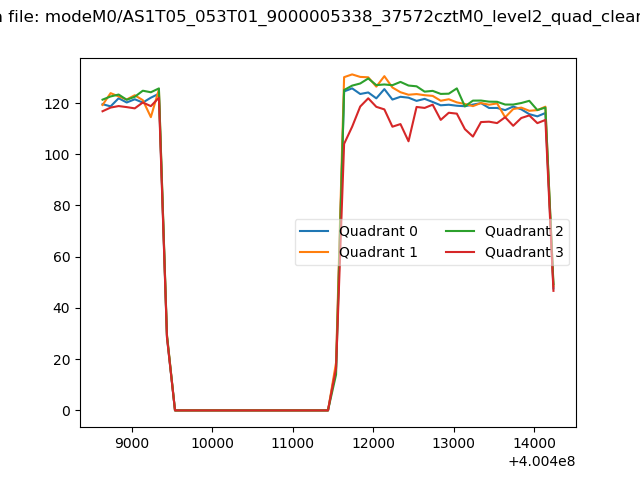 |
|
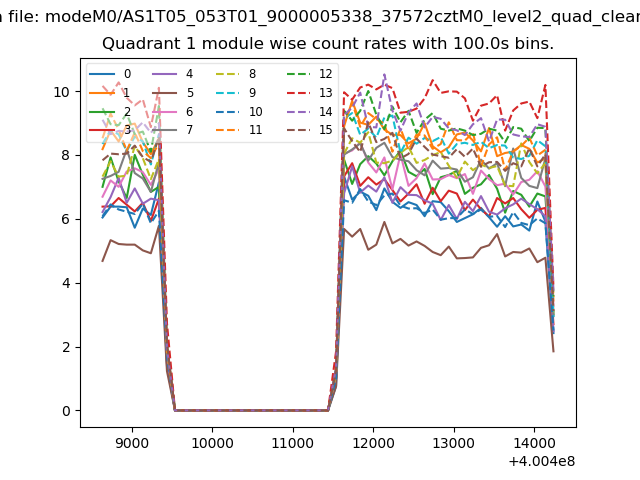
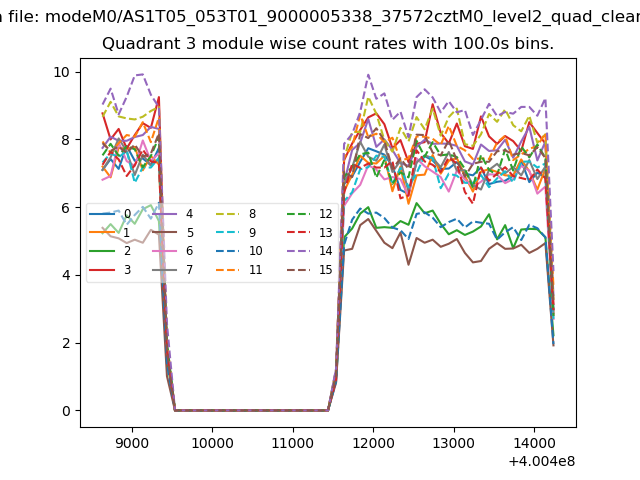
| Module-wise count rates for Quadrant A Data is divided into 100 sec bins |
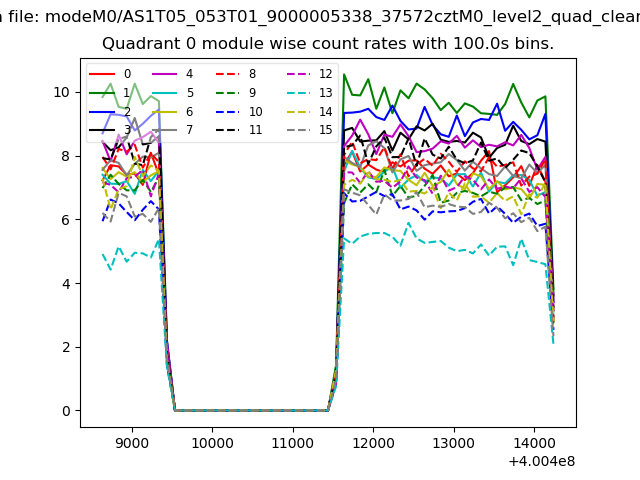 |
 |
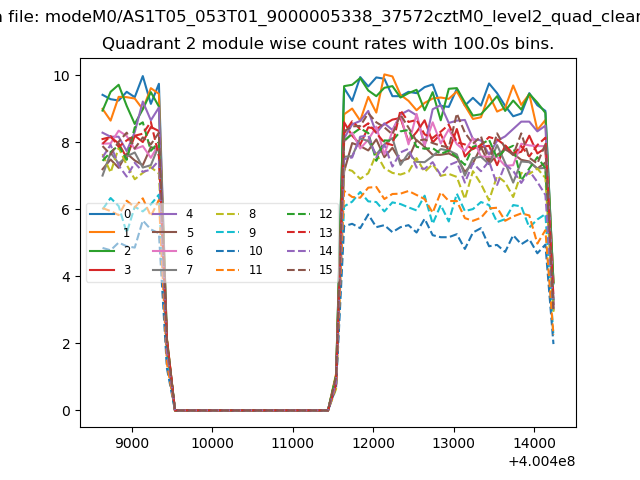
| Module-wise count rates for Quadrant B Data is divided into 100 sec bins |
 |
 |
| Module-wise count rates for Quadrant C Data is divided into 100 sec bins |
 |
 |
| Module-wise count rates for Quadrant D Data is divided into 100 sec bins |
 |
 |
| Parameter | Plot |
|---|---|
| CZT HV Monitor |  |
| D_VDD | 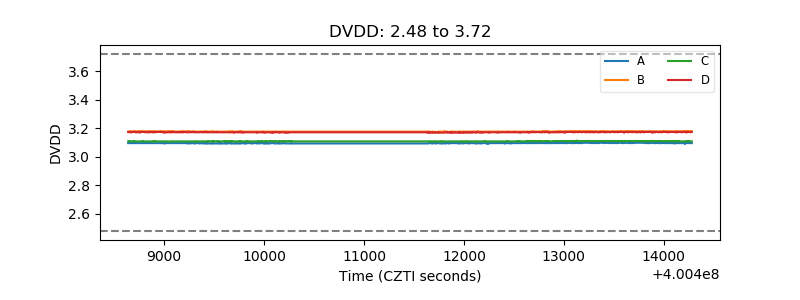 |
| Temperature 1 | 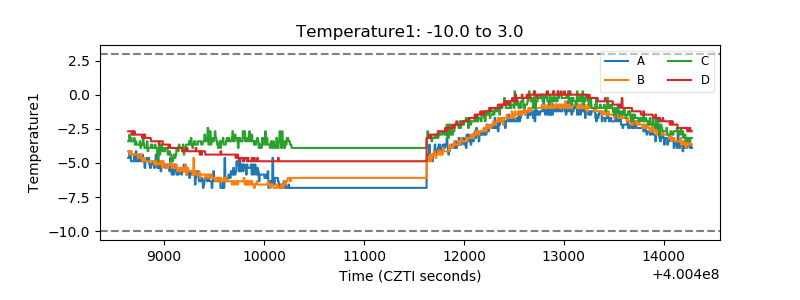 |
| Veto HV Monitor | 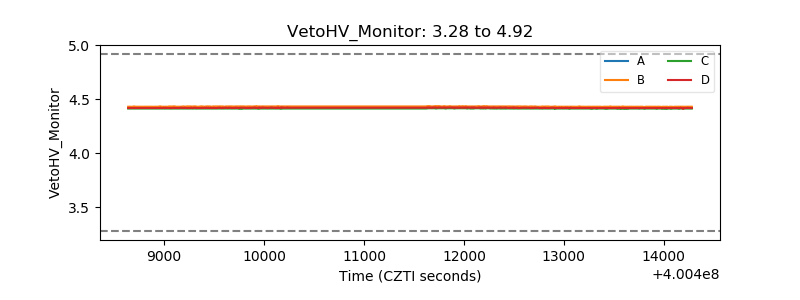 |
| Veto LLD | 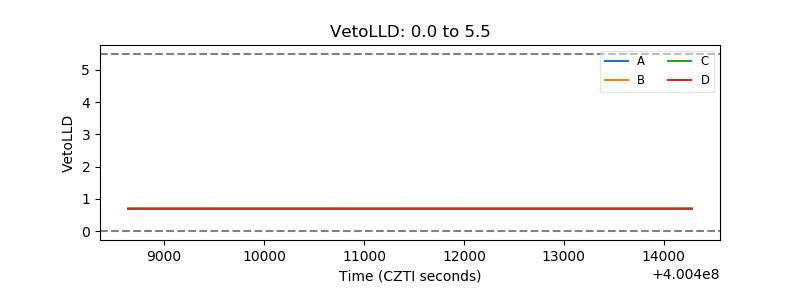 |
| Alpha Counter | 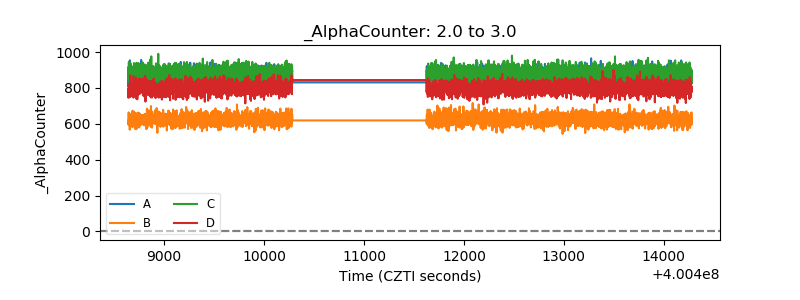 |
| _CPM_Rate | 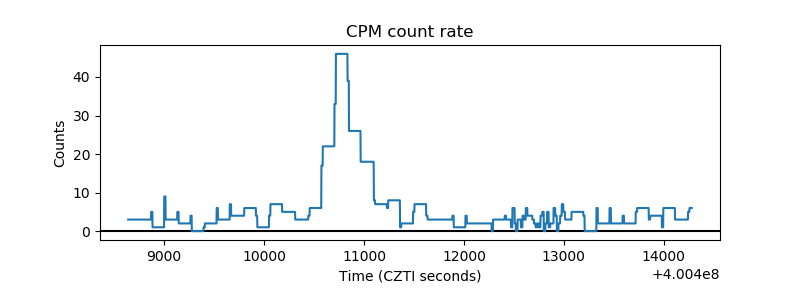 |
| CZT Counter | 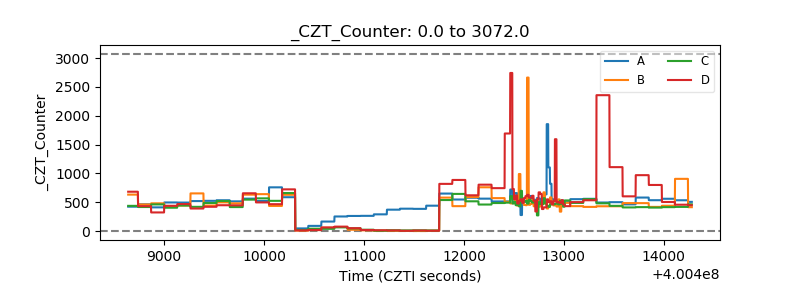 |
| +2.5 Volts monitor | 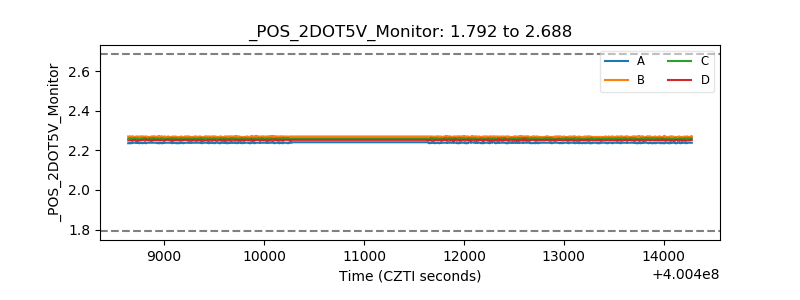 |
| +5 Volts monitor | 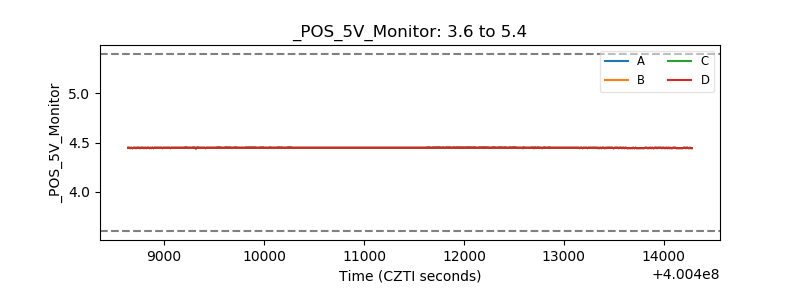 |
| _ROLL_ROT | 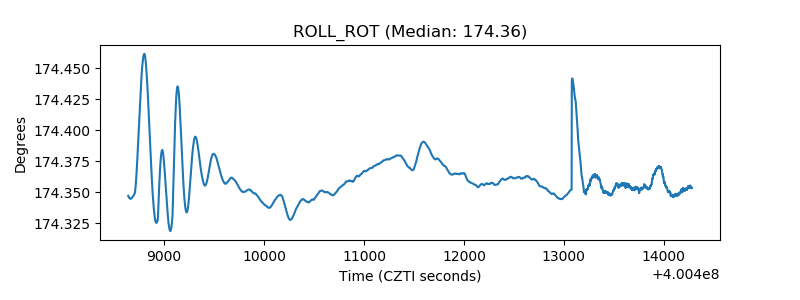 |
| _Roll_DEC | 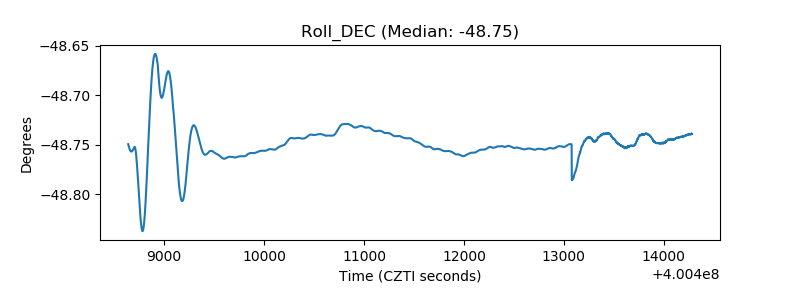 |
| _Roll_RA | 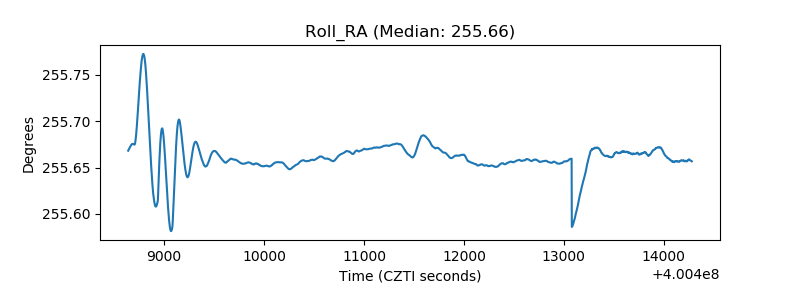 |
| Veto Counter | 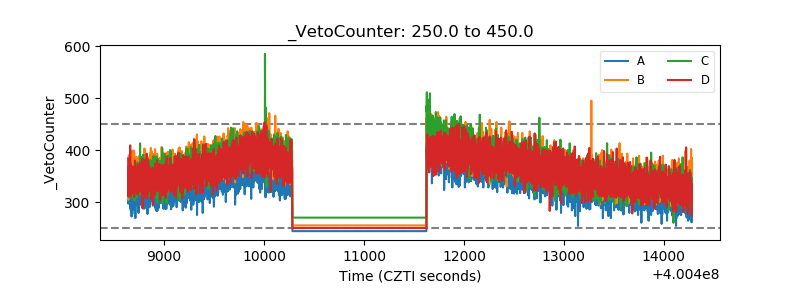 |