| Param | Original file | Final file |
|---|---|---|
| Filename | modeM0/AS1T05_053T01_9000005338_37573cztM0_level2.evt | modeM0/AS1T05_053T01_9000005338_37573cztM0_level2_quad_clean.evt |
| Size (bytes) | 719,343,360 | 117,835,200 |
| Size | 686.0 MB | 112.4 MB |
| Events in quadrant A | 5,121,306 | 748,086 |
| Events in quadrant B | 6,267,034 | 722,250 |
| Events in quadrant C | 4,305,631 | 764,644 |
| Events in quadrant D | 5,494,427 | 720,876 |
| Mode SS | |||
|---|---|---|---|
| Quadrant | BADHDUFLAG | Total packets | Discarded packets |
| A | 0 | 180 | 0 |
| B | 0 | 180 | 0 |
| C | 0 | 180 | 0 |
| D | 0 | 180 | 0 |
| Mode M0 | |||
|---|---|---|---|
| Quadrant | BADHDUFLAG | Total packets | Discarded packets |
| A | 0 | 20379 | 3 |
| B | 0 | 24227 | 2 |
| C | 0 | 18285 | 2 |
| D | 0 | 22397 | 2 |
| Mode M9 | |||
|---|---|---|---|
| Quadrant | BADHDUFLAG | Total packets | Discarded packets |
| A | 0 | 30 | 0 |
| B | 0 | 30 | 0 |
| C | 0 | 30 | 0 |
| D | 0 | 30 | 0 |
| Quadrant | Total seconds | Saturated seconds | Saturation percentage |
|---|---|---|---|
| A | 8827 | 84 | 0.951626% |
| B | 8827 | 632 | 7.159850% |
| C | 8827 | 29 | 0.328537% |
| D | 8827 | 195 | 2.209131% |
Noise dominated data is calculated using 1-second bins in cleaned event files. If a bin has >2000 counts, and if more than 50% of those come from <1% of pixels, then it is considered to be noise-dominated and hence unusable.
| Quadrant | # 1 sec bins | Bins with >0 counts | Bins with >2000 counts | High rate bins dominated by noise | Noise dominated (total time) | Noise dominated (detector-on time) | Marked lightcurve |
|---|---|---|---|---|---|---|---|
| A | 11814 | 8829 | 52 | 52 | 0.44% | 0.59% | 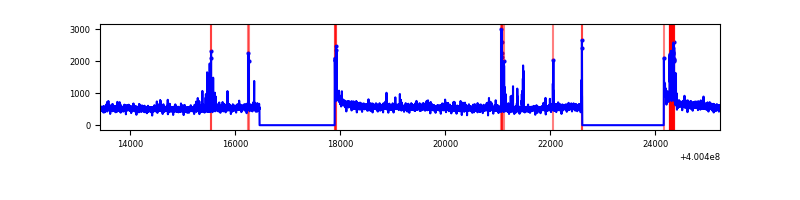 |
| B | 11814 | 8829 | 526 | 526 | 4.45% | 5.96% | 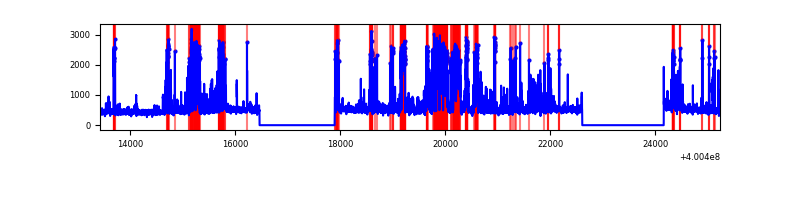 |
| C | 11814 | 8829 | 25 | 25 | 0.21% | 0.28% | 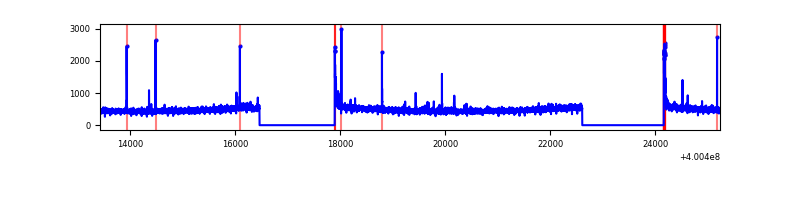 |
| D | 11814 | 8829 | 189 | 189 | 1.60% | 2.14% | 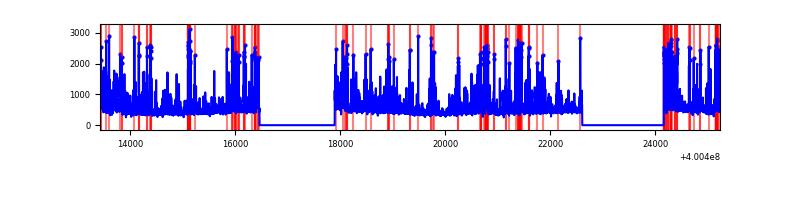 |
Top three noisy pixels from each quadrant. If the there are fewer than three noisy pixels in the level2.evt file, extra rows are filled as -1
| Pixel properties | Quadrant properties | ||||||
|---|---|---|---|---|---|---|---|
| Quadrant | DetID | PixID | Counts | Sigma | Mean | Median | Sigma |
| A | 10 | 83 | 467439 | 2293.19 | 1000 | 980 | 203.4 |
| A | 15 | 222 | 446967 | 2192.55 | 1000 | 980 | 203.4 |
| A | 13 | 248 | 116083 | 565.87 | 1000 | 980 | 203.4 |
| B | 5 | 200 | 967783 | 5236.86 | 969 | 944 | 184.6 |
| B | 5 | 255 | 583335 | 3154.5 | 969 | 944 | 184.6 |
| B | 5 | 172 | 309212 | 1669.72 | 969 | 944 | 184.6 |
| C | 15 | 214 | 375277 | 1648.1 | 970 | 977 | 227.1 |
| C | 0 | 10 | 93647 | 408.04 | 970 | 977 | 227.1 |
| C | 15 | 159 | 18688 | 77.98 | 970 | 977 | 227.1 |
| D | 1 | 47 | 525557 | 2217.14 | 963 | 935 | 236.6 |
| D | 2 | 250 | 522939 | 2206.08 | 963 | 935 | 236.6 |
| D | 12 | 233 | 193190 | 812.5 | 963 | 935 | 236.6 |
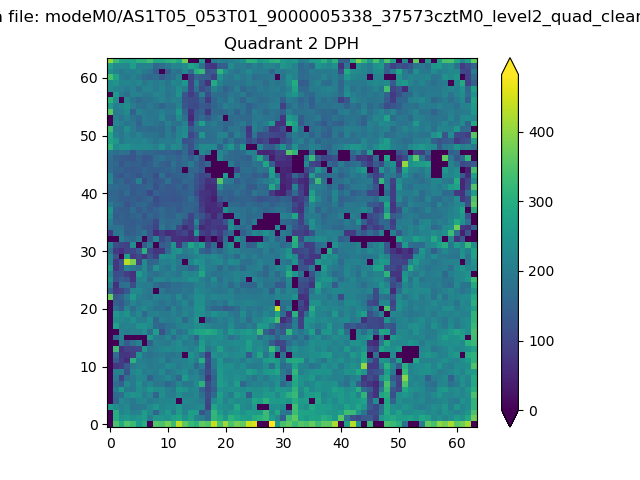
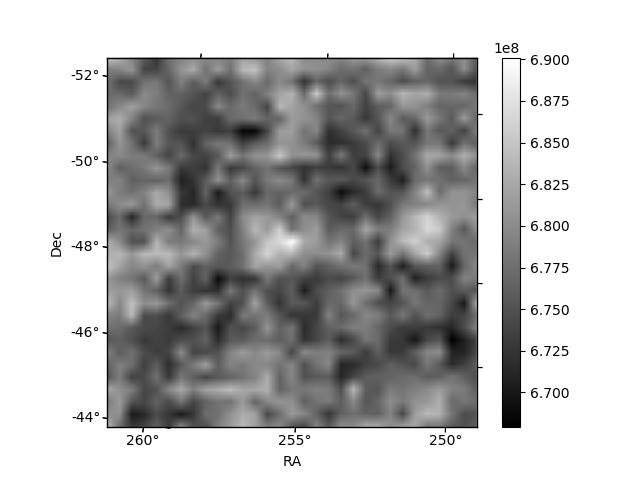
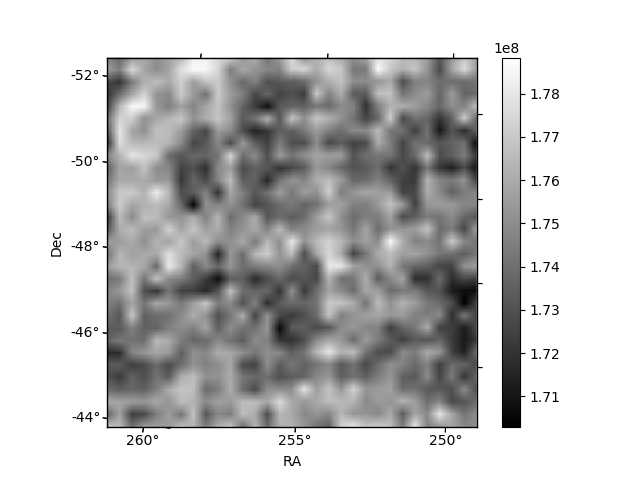
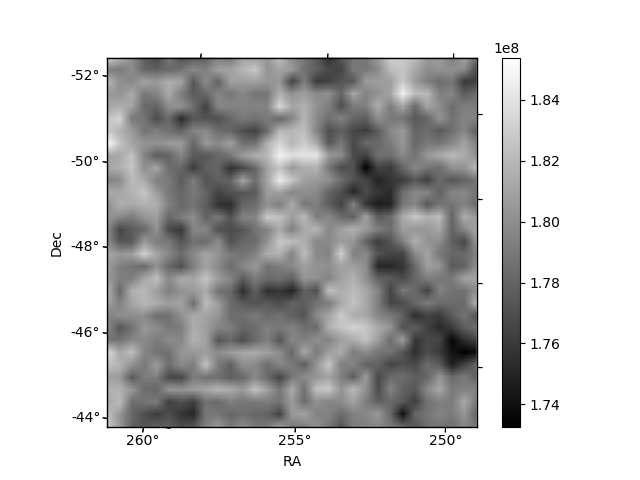
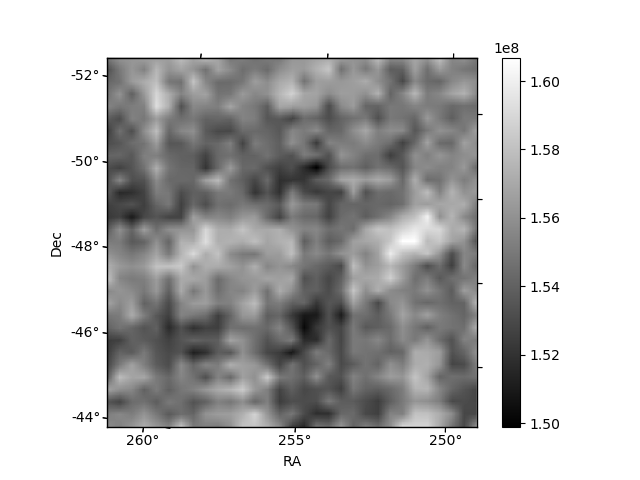
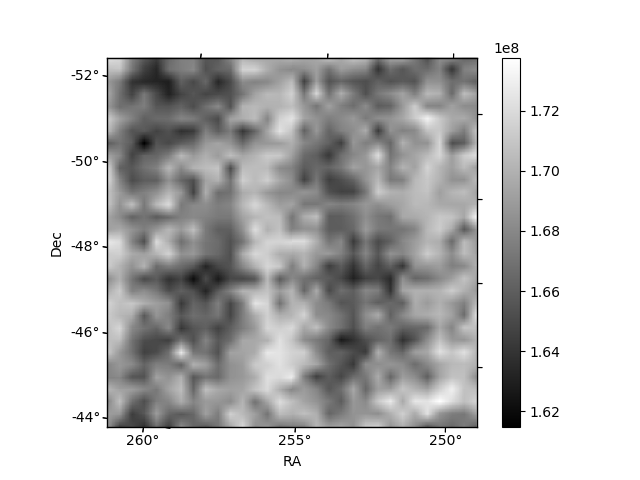
Histogram calculated using DETX and DETY for each event in the final _common_clean file
| Quadrant A | 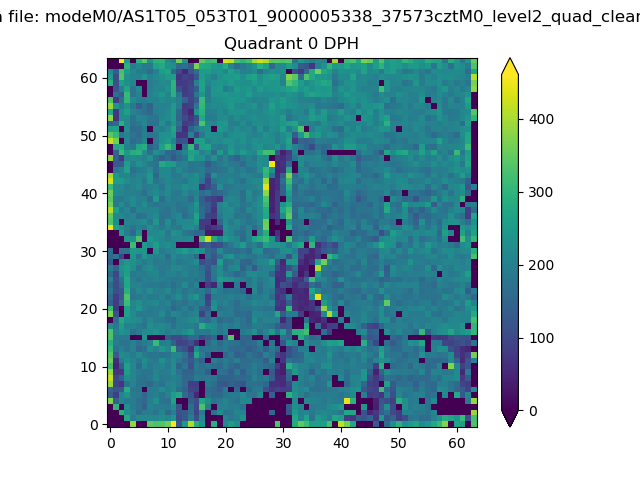 |
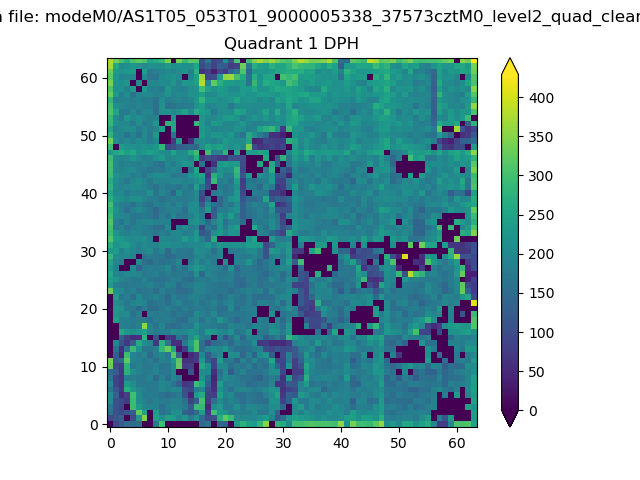 |
Quadrant B |
|---|---|---|---|
| Quadrant D | 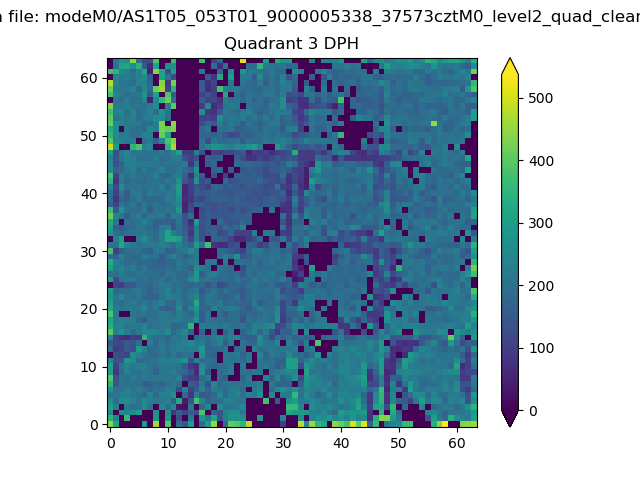 |
 |
Quadrant C |
| Plot type | Count rate plots | Images |
|---|---|---|
| Comparison with Poisson distribution Blue bars denote a histogram of data divided into 1 sec bins. Red curve is a Poisson curve with rate = median count rate of data. |
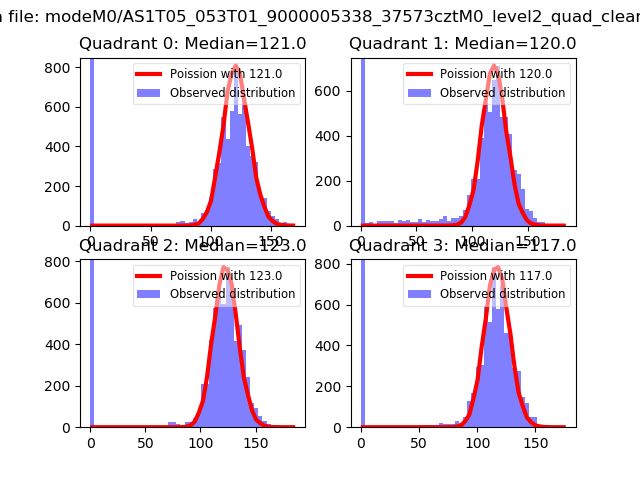 |
 |
| Quadrant-wise count rates Data is divided into 100 sec bins |
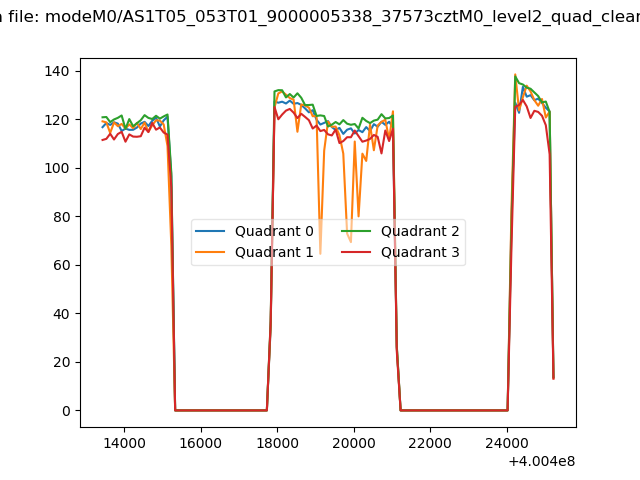 |
|
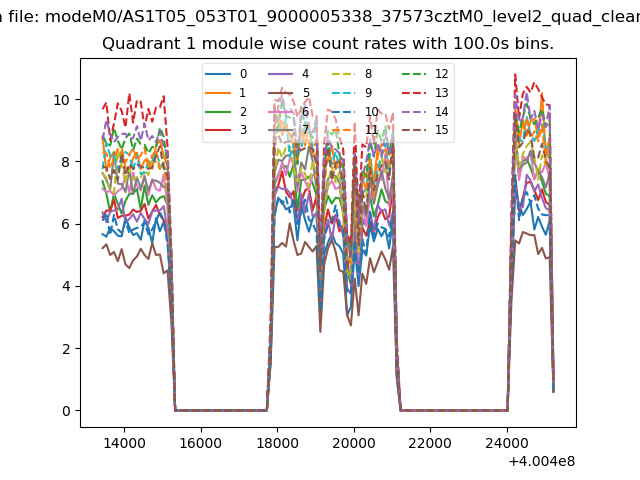
| Module-wise count rates for Quadrant A Data is divided into 100 sec bins |
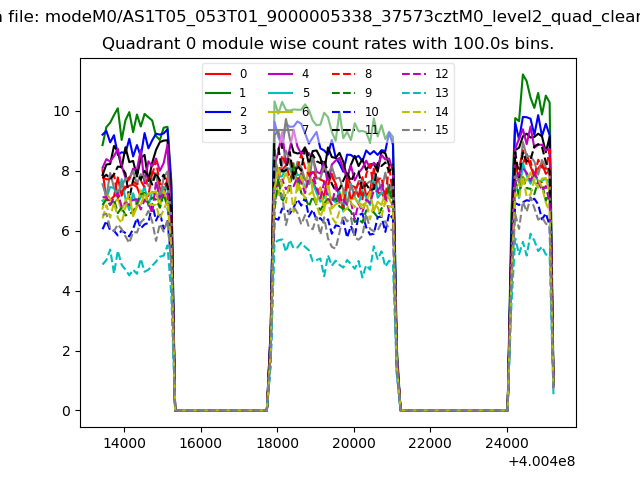 |
 |
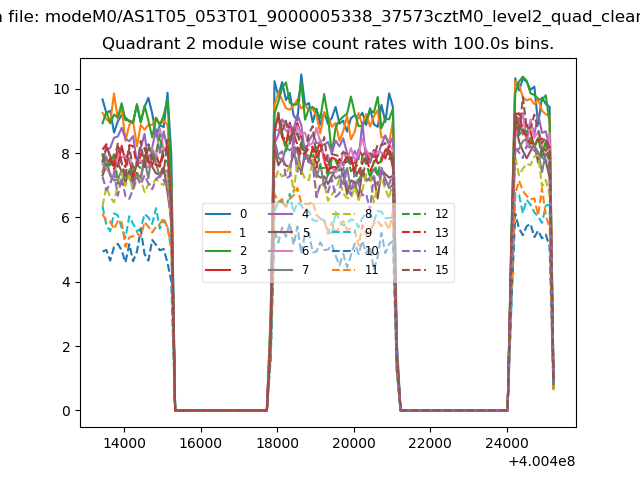
| Module-wise count rates for Quadrant B Data is divided into 100 sec bins |
 |
 |
| Module-wise count rates for Quadrant C Data is divided into 100 sec bins |
 |
 |
| Module-wise count rates for Quadrant D Data is divided into 100 sec bins |
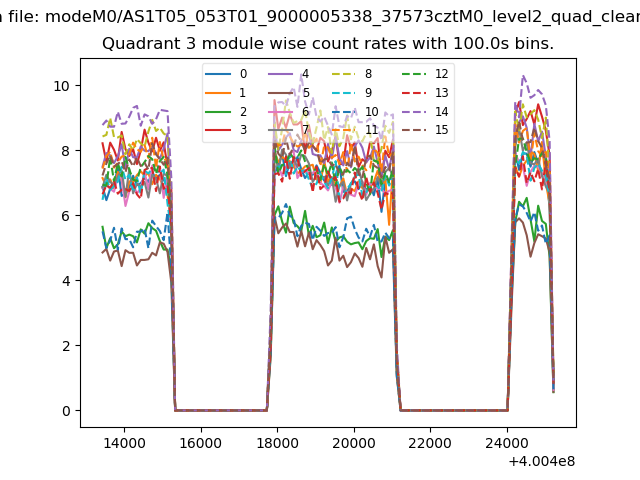 |
 |
| Parameter | Plot |
|---|---|
| CZT HV Monitor | 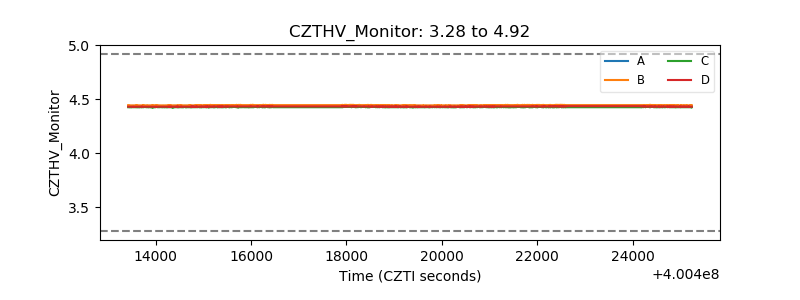 |
| D_VDD | 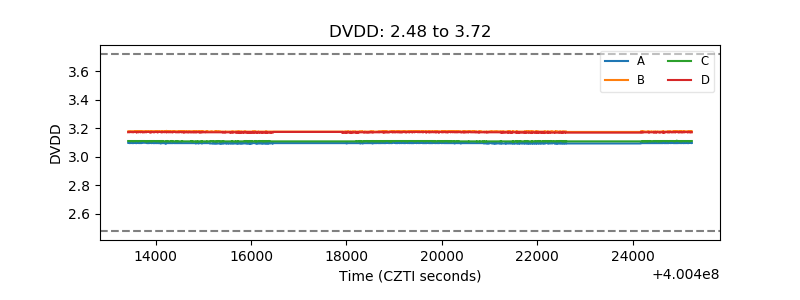 |
| Temperature 1 | 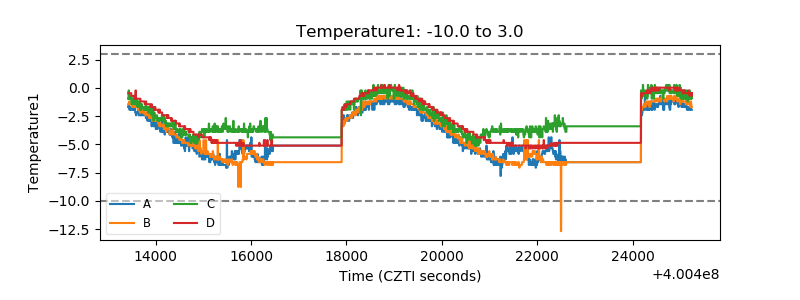 |
| Veto HV Monitor | 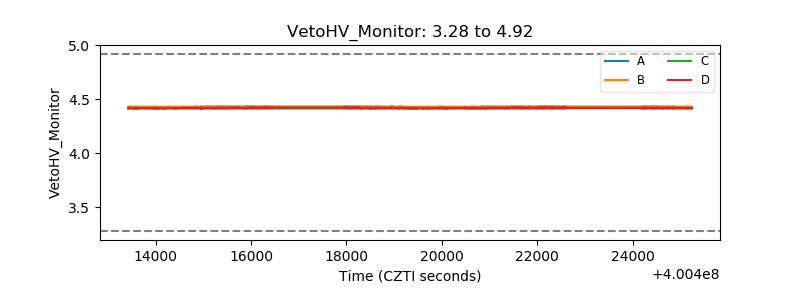 |
| Veto LLD | 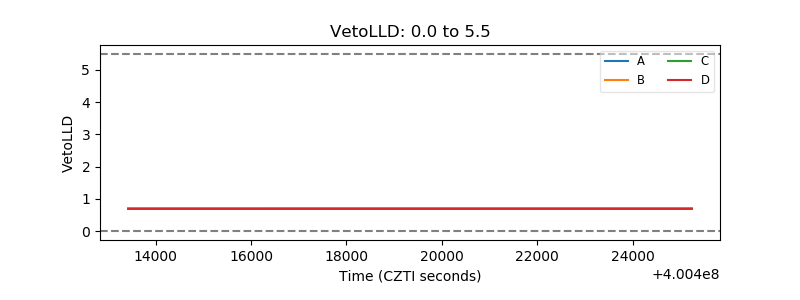 |
| Alpha Counter | 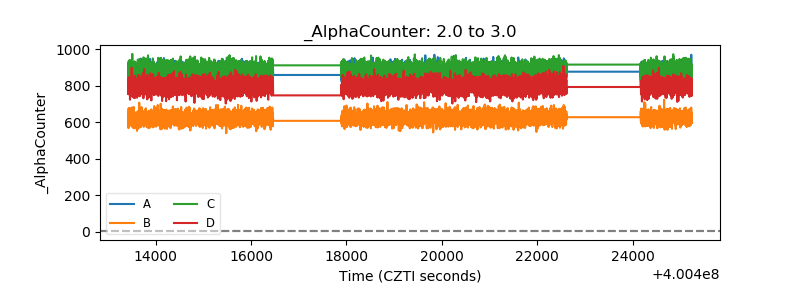 |
| _CPM_Rate | 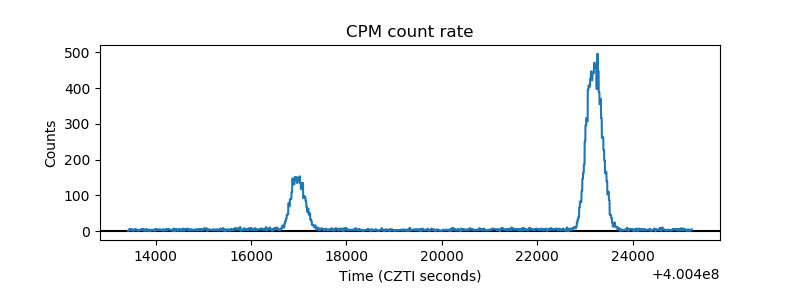 |
| CZT Counter | 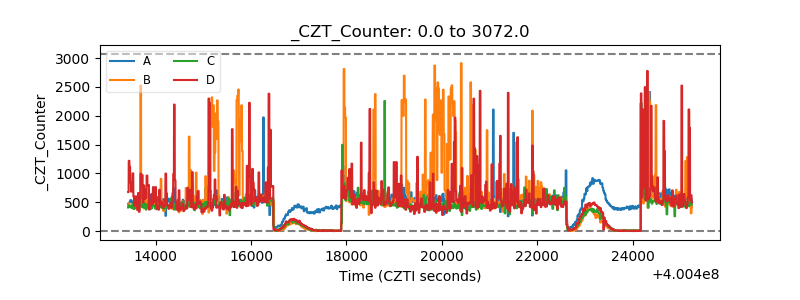 |
| +2.5 Volts monitor | 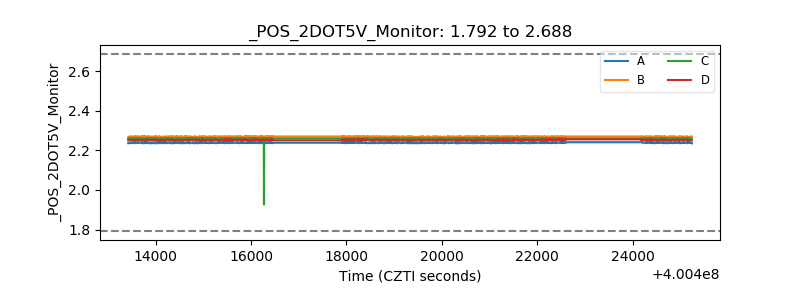 |
| +5 Volts monitor | 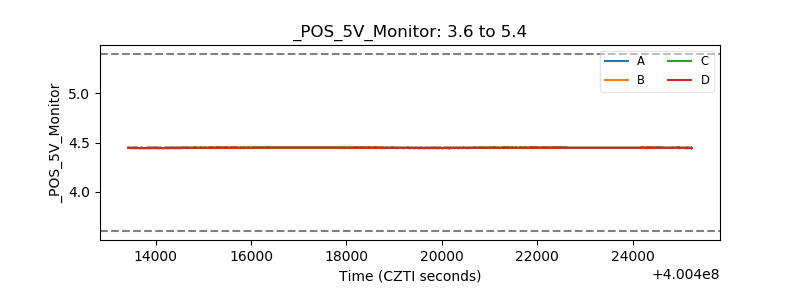 |
| _ROLL_ROT | 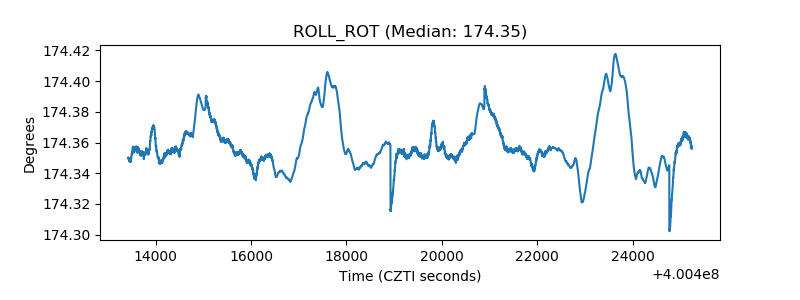 |
| _Roll_DEC | 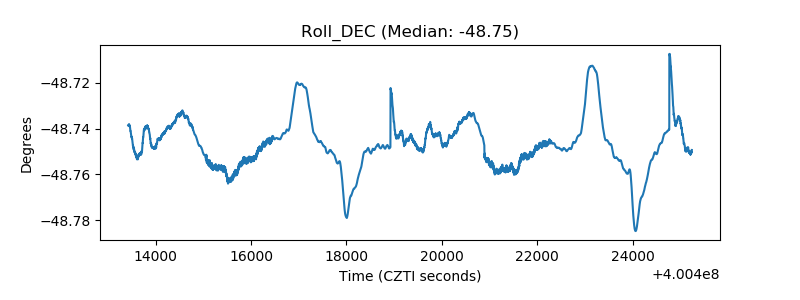 |
| _Roll_RA | 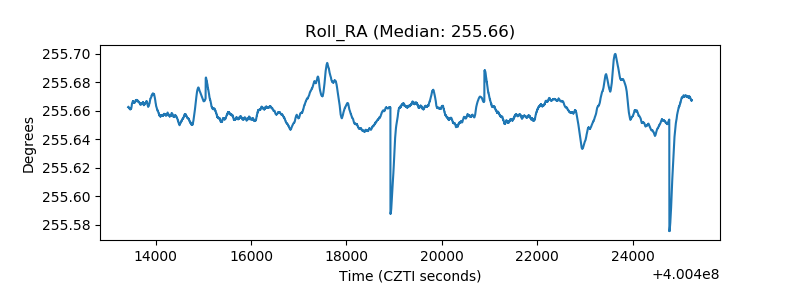 |
| Veto Counter | 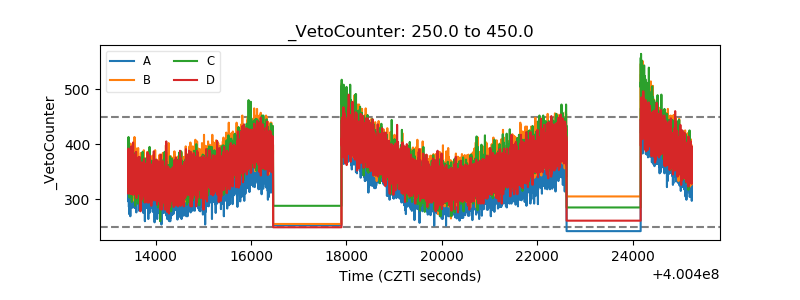 |