| Param | Original file | Final file |
|---|---|---|
| Filename | modeM0/AS1T05_053T01_9000005338_37574cztM0_level2.evt | modeM0/AS1T05_053T01_9000005338_37574cztM0_level2_quad_clean.evt |
| Size (bytes) | 430,470,720 | 76,541,760 |
| Size | 410.5 MB | 73.0 MB |
| Events in quadrant A | 3,340,224 | 485,110 |
| Events in quadrant B | 3,191,187 | 487,766 |
| Events in quadrant C | 2,814,730 | 490,127 |
| Events in quadrant D | 3,309,095 | 461,898 |
| Mode SS | |||
|---|---|---|---|
| Quadrant | BADHDUFLAG | Total packets | Discarded packets |
| A | 0 | 114 | 0 |
| B | 0 | 114 | 0 |
| C | 0 | 114 | 0 |
| D | 0 | 114 | 0 |
| Mode M0 | |||
|---|---|---|---|
| Quadrant | BADHDUFLAG | Total packets | Discarded packets |
| A | 0 | 13333 | 3 |
| B | 0 | 13095 | 2 |
| C | 0 | 11893 | 2 |
| D | 0 | 13733 | 2 |
| Mode M9 | |||
|---|---|---|---|
| Quadrant | BADHDUFLAG | Total packets | Discarded packets |
| A | 0 | 18 | 0 |
| B | 0 | 18 | 0 |
| C | 0 | 18 | 0 |
| D | 0 | 19 | 0 |
| Quadrant | Total seconds | Saturated seconds | Saturation percentage |
|---|---|---|---|
| A | 5618 | 72 | 1.281595% |
| B | 5618 | 106 | 1.886792% |
| C | 5618 | 33 | 0.587398% |
| D | 5618 | 134 | 2.385190% |
Noise dominated data is calculated using 1-second bins in cleaned event files. If a bin has >2000 counts, and if more than 50% of those come from <1% of pixels, then it is considered to be noise-dominated and hence unusable.
| Quadrant | # 1 sec bins | Bins with >0 counts | Bins with >2000 counts | High rate bins dominated by noise | Noise dominated (total time) | Noise dominated (detector-on time) | Marked lightcurve |
|---|---|---|---|---|---|---|---|
| A | 7321 | 5619 | 44 | 44 | 0.60% | 0.78% | 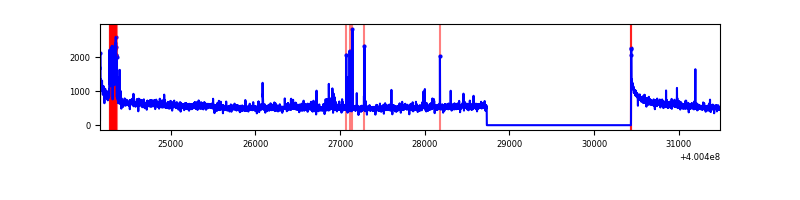 |
| B | 7321 | 5619 | 61 | 61 | 0.83% | 1.09% | 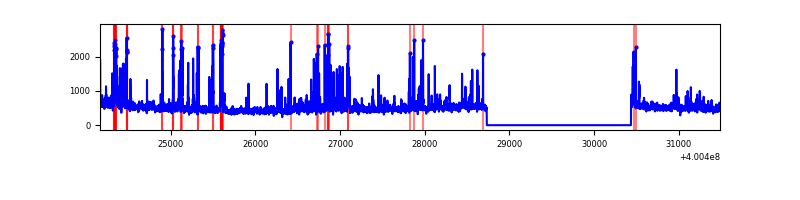 |
| C | 7321 | 5619 | 27 | 27 | 0.37% | 0.48% | 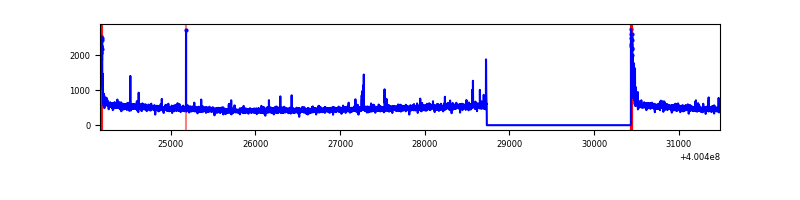 |
| D | 7321 | 5619 | 137 | 137 | 1.87% | 2.44% | 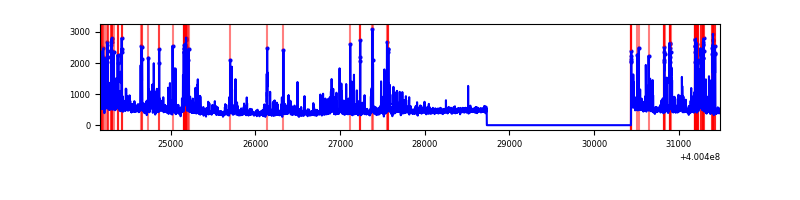 |
Top three noisy pixels from each quadrant. If the there are fewer than three noisy pixels in the level2.evt file, extra rows are filled as -1
| Pixel properties | Quadrant properties | ||||||
|---|---|---|---|---|---|---|---|
| Quadrant | DetID | PixID | Counts | Sigma | Mean | Median | Sigma |
| A | 10 | 83 | 343870 | 2639.79 | 642 | 632 | 130.0 |
| A | 15 | 222 | 268128 | 2057.27 | 642 | 632 | 130.0 |
| A | 13 | 248 | 113877 | 870.95 | 642 | 632 | 130.0 |
| B | 5 | 255 | 195787 | 1602.17 | 638 | 622 | 121.8 |
| B | 5 | 172 | 178266 | 1458.34 | 638 | 622 | 121.8 |
| B | 5 | 200 | 83945 | 684.02 | 638 | 622 | 121.8 |
| C | 15 | 214 | 241966 | 1656.7 | 619 | 624 | 145.7 |
| C | 0 | 10 | 111186 | 758.96 | 619 | 624 | 145.7 |
| C | 3 | 233 | 19197 | 127.49 | 619 | 624 | 145.7 |
| D | 2 | 250 | 280595 | 1848.3 | 615 | 597 | 151.5 |
| D | 1 | 47 | 214052 | 1409.04 | 615 | 597 | 151.5 |
| D | 10 | 199 | 92688 | 607.9 | 615 | 597 | 151.5 |
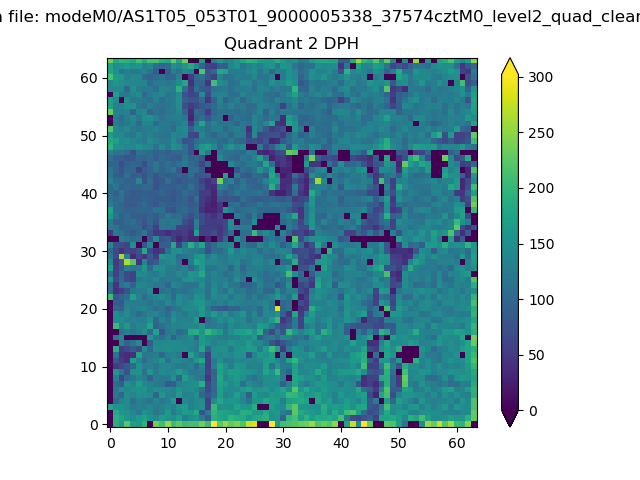
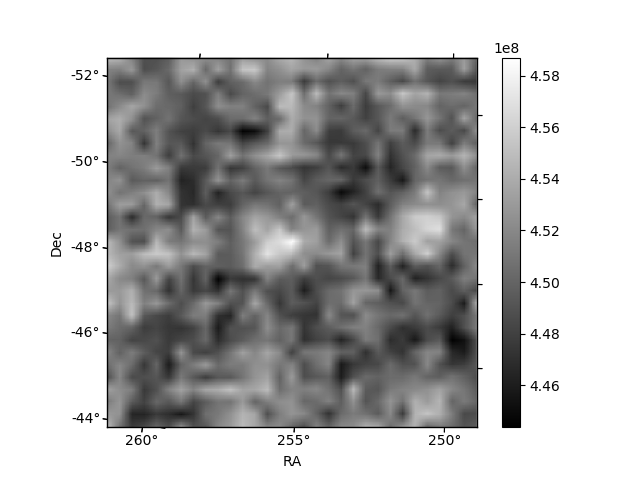
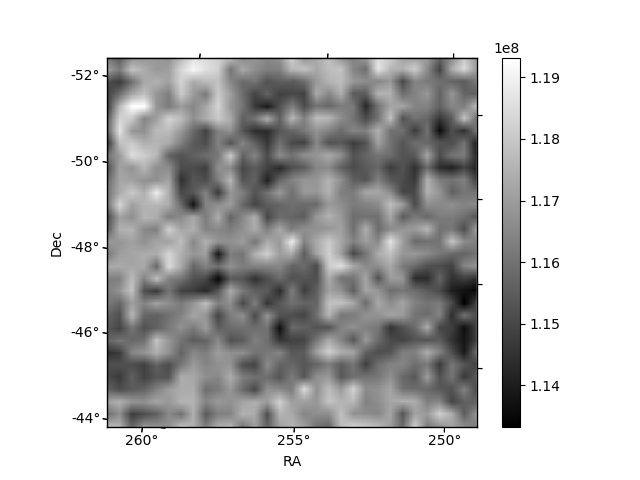
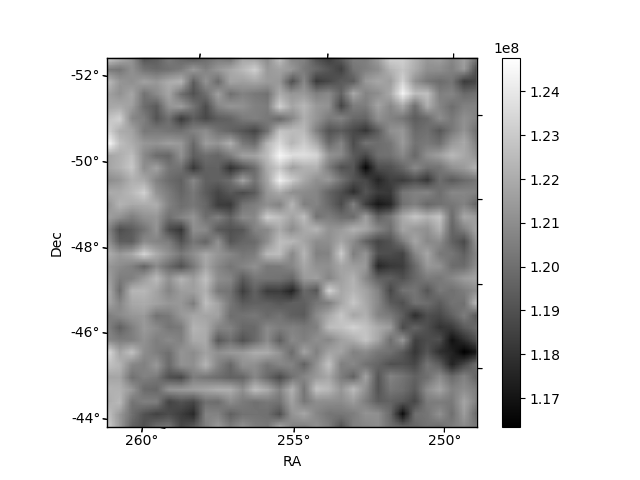
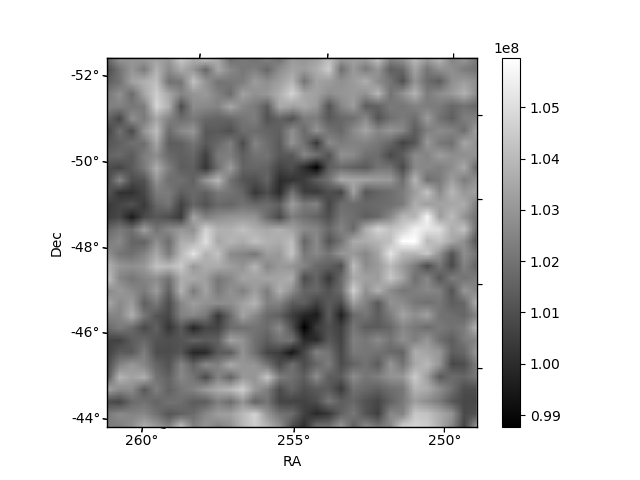
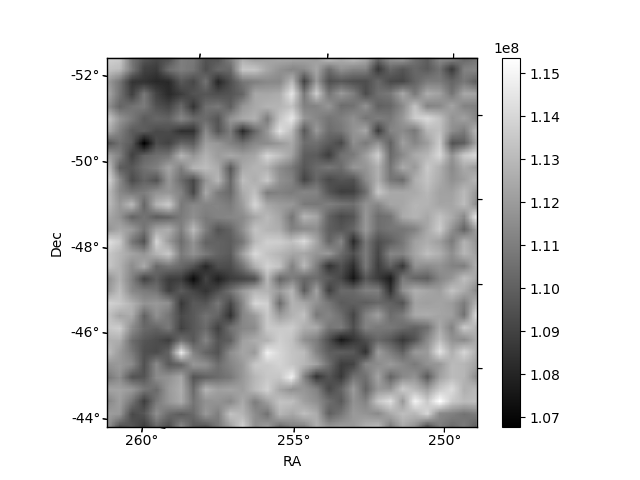
Histogram calculated using DETX and DETY for each event in the final _common_clean file
| Quadrant A | 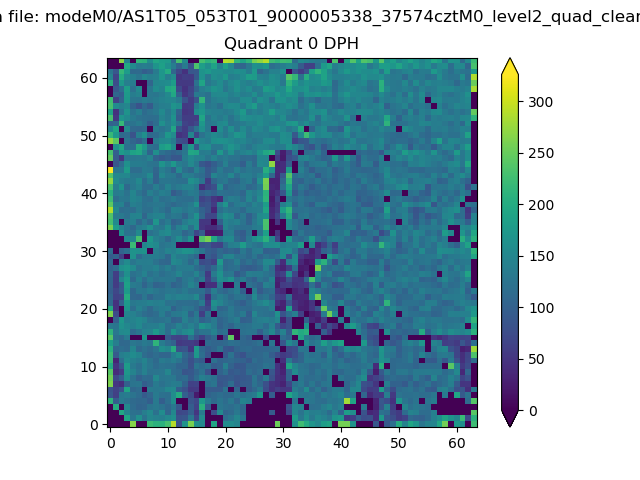 |
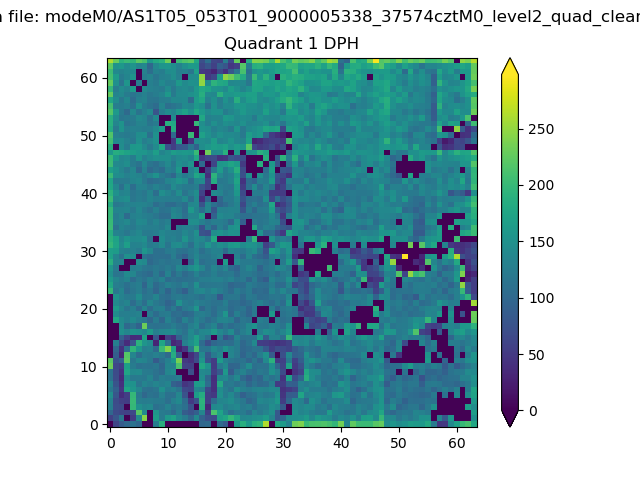 |
Quadrant B |
|---|---|---|---|
| Quadrant D | 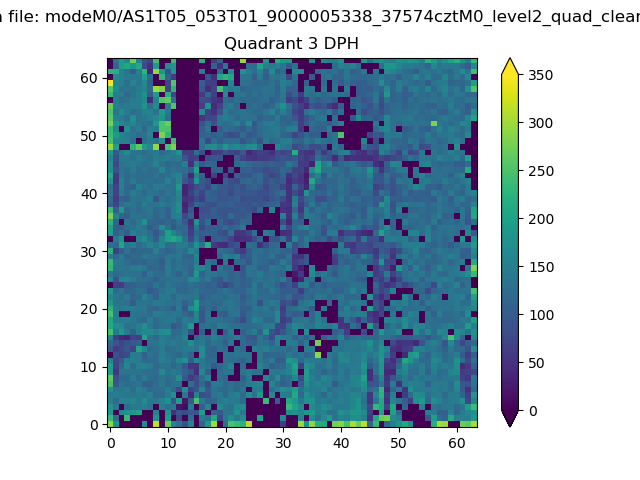 |
 |
Quadrant C |
| Plot type | Count rate plots | Images |
|---|---|---|
| Comparison with Poisson distribution Blue bars denote a histogram of data divided into 1 sec bins. Red curve is a Poisson curve with rate = median count rate of data. |
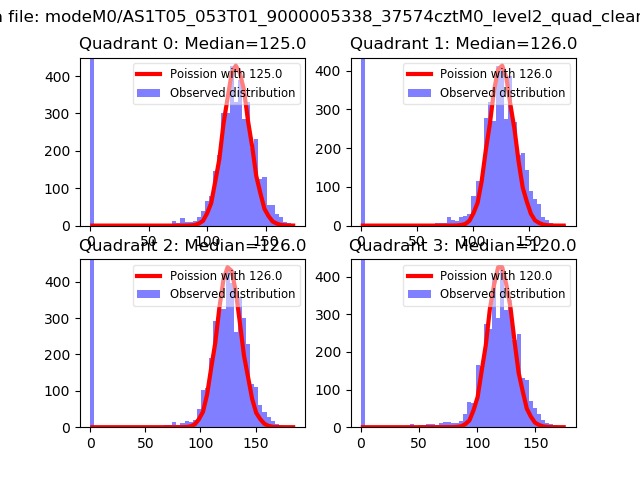 |
 |
| Quadrant-wise count rates Data is divided into 100 sec bins |
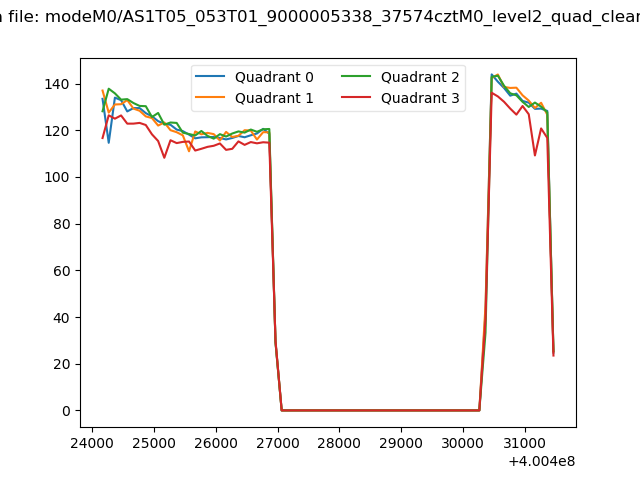 |
|
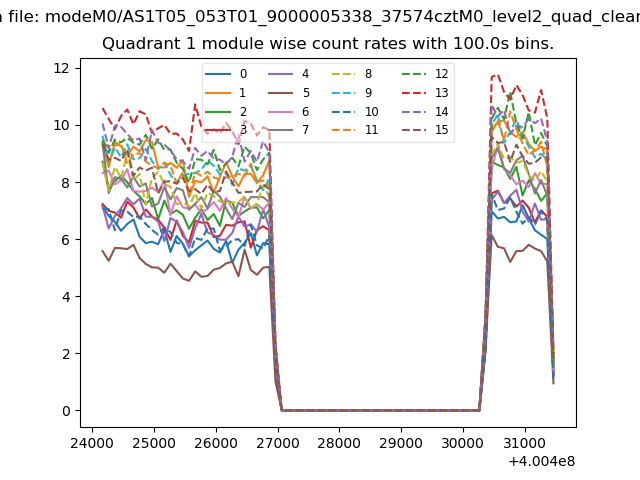
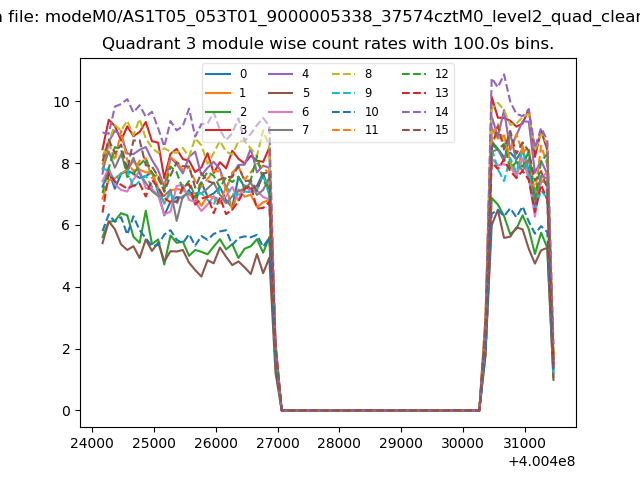
| Module-wise count rates for Quadrant A Data is divided into 100 sec bins |
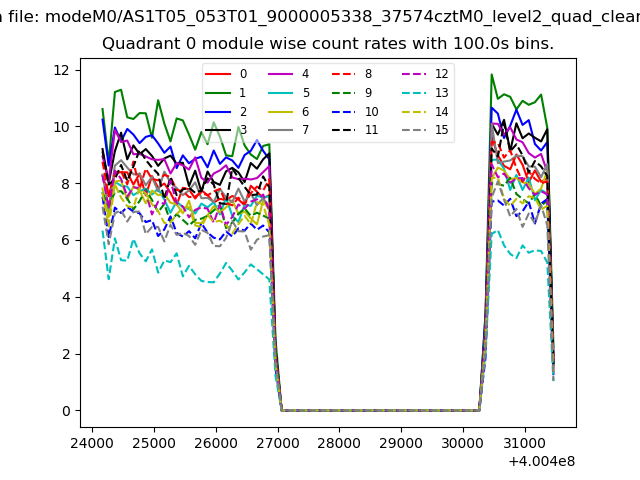 |
 |
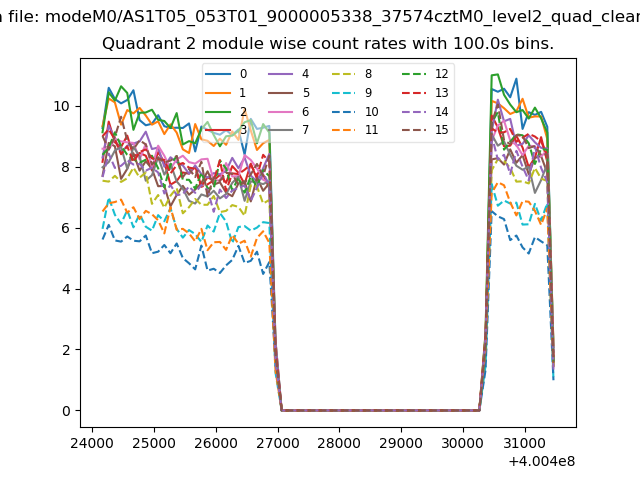
| Module-wise count rates for Quadrant B Data is divided into 100 sec bins |
 |
 |
| Module-wise count rates for Quadrant C Data is divided into 100 sec bins |
 |
 |
| Module-wise count rates for Quadrant D Data is divided into 100 sec bins |
 |
 |
| Parameter | Plot |
|---|---|
| CZT HV Monitor | 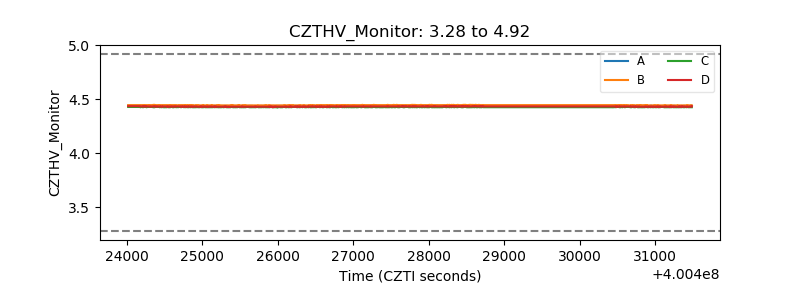 |
| D_VDD | 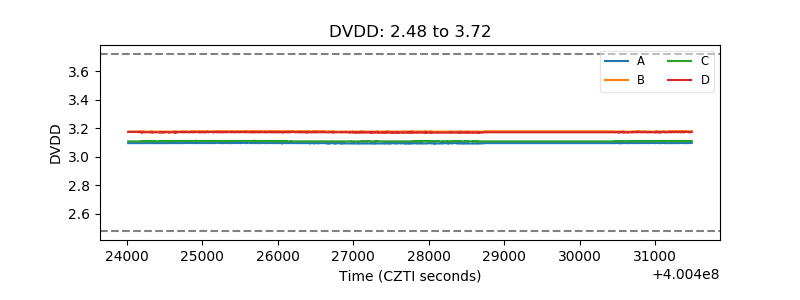 |
| Temperature 1 | 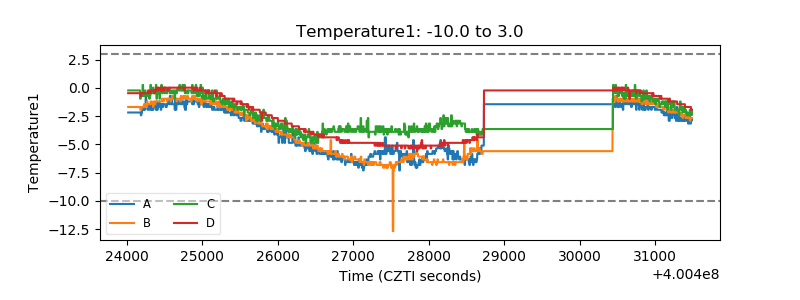 |
| Veto HV Monitor |  |
| Veto LLD | 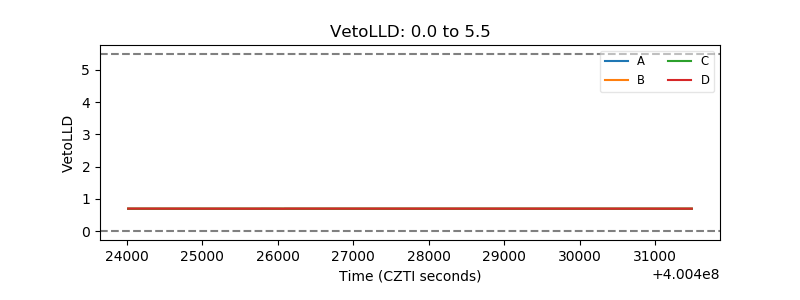 |
| Alpha Counter | 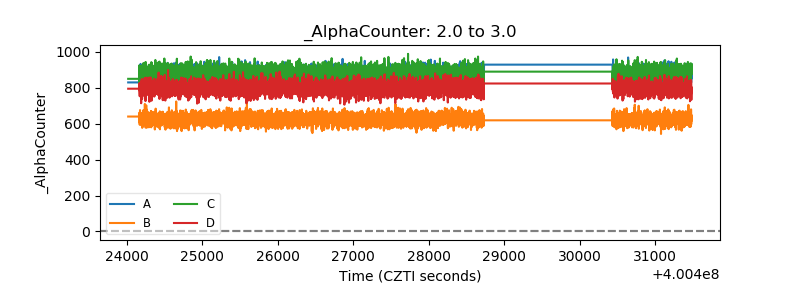 |
| _CPM_Rate | 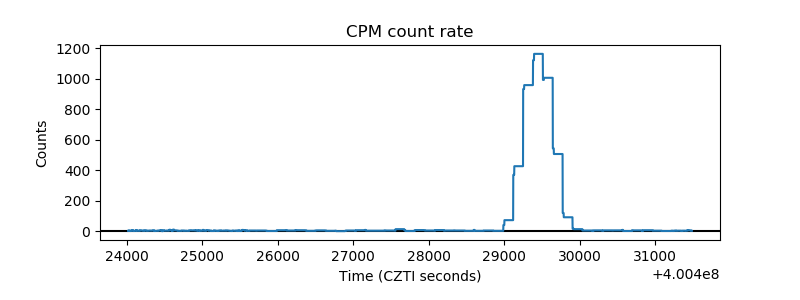 |
| CZT Counter | 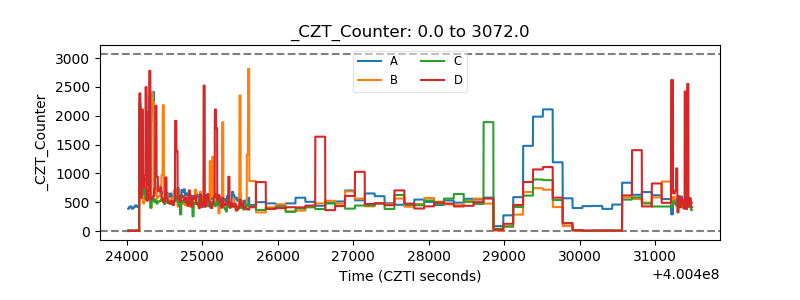 |
| +2.5 Volts monitor | 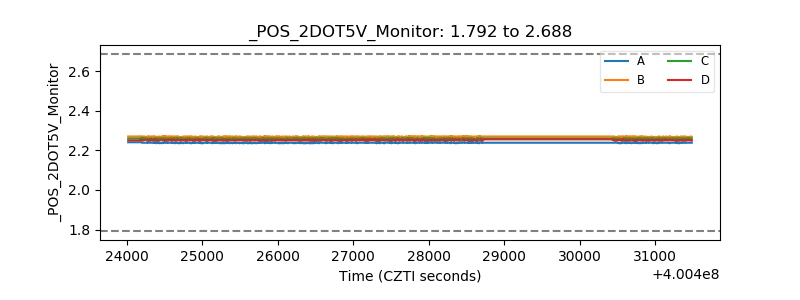 |
| +5 Volts monitor | 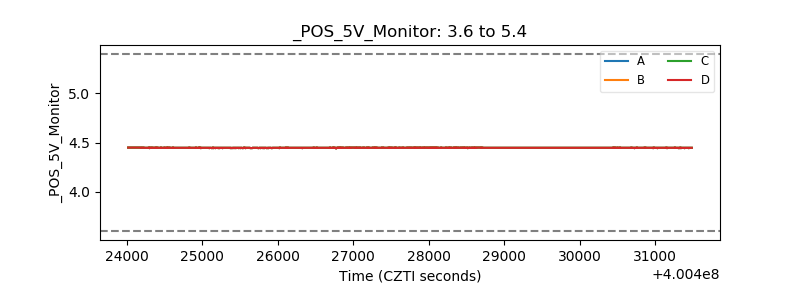 |
| _ROLL_ROT | 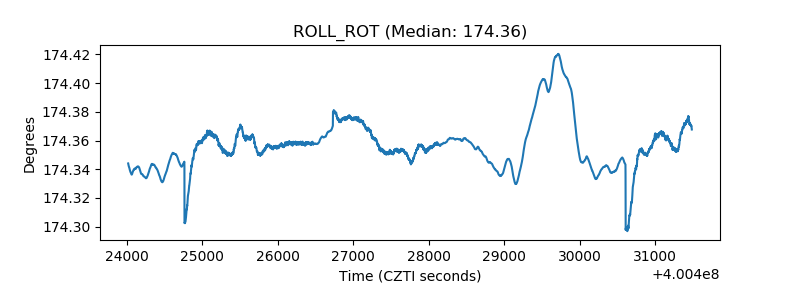 |
| _Roll_DEC | 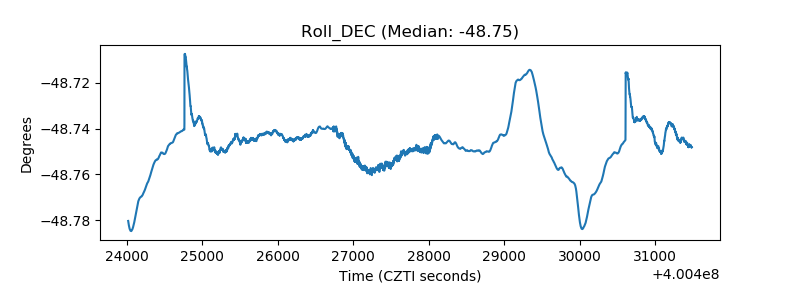 |
| _Roll_RA | 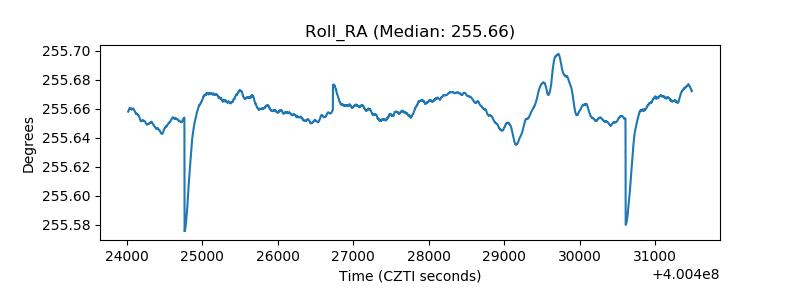 |
| Veto Counter | 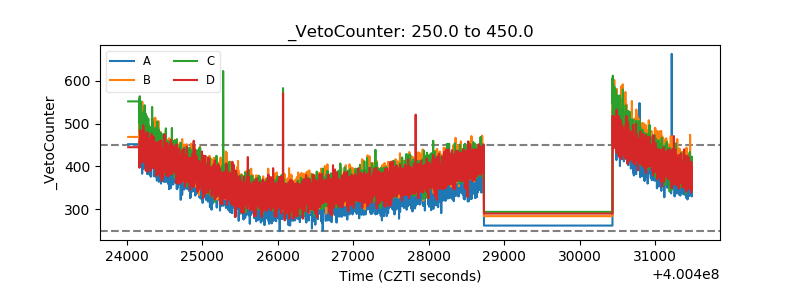 |