| Param | Original file | Final file |
|---|---|---|
| Filename | modeM0/AS1T05_053T01_9000005338_37576cztM0_level2.evt | modeM0/AS1T05_053T01_9000005338_37576cztM0_level2_quad_clean.evt |
| Size (bytes) | 439,459,200 | 69,298,560 |
| Size | 419.1 MB | 66.1 MB |
| Events in quadrant A | 3,101,403 | 438,300 |
| Events in quadrant B | 3,233,161 | 443,657 |
| Events in quadrant C | 2,688,221 | 438,690 |
| Events in quadrant D | 3,921,485 | 401,628 |
| Mode SS | |||
|---|---|---|---|
| Quadrant | BADHDUFLAG | Total packets | Discarded packets |
| A | 0 | 110 | 0 |
| B | 0 | 110 | 0 |
| C | 0 | 110 | 0 |
| D | 0 | 110 | 0 |
| Mode M0 | |||
|---|---|---|---|
| Quadrant | BADHDUFLAG | Total packets | Discarded packets |
| A | 0 | 12584 | 3 |
| B | 0 | 13008 | 2 |
| C | 0 | 11288 | 2 |
| D | 0 | 15308 | 2 |
| Mode M9 | |||
|---|---|---|---|
| Quadrant | BADHDUFLAG | Total packets | Discarded packets |
| A | 0 | 18 | 0 |
| B | 0 | 18 | 0 |
| C | 0 | 18 | 0 |
| D | 0 | 19 | 0 |
| Quadrant | Total seconds | Saturated seconds | Saturation percentage |
|---|---|---|---|
| A | 5367 | 61 | 1.136575% |
| B | 5367 | 137 | 2.552636% |
| C | 5367 | 33 | 0.614869% |
| D | 5367 | 325 | 6.055525% |
Noise dominated data is calculated using 1-second bins in cleaned event files. If a bin has >2000 counts, and if more than 50% of those come from <1% of pixels, then it is considered to be noise-dominated and hence unusable.
| Quadrant | # 1 sec bins | Bins with >0 counts | Bins with >2000 counts | High rate bins dominated by noise | Noise dominated (total time) | Noise dominated (detector-on time) | Marked lightcurve |
|---|---|---|---|---|---|---|---|
| A | 7189 | 5368 | 53 | 53 | 0.74% | 0.99% | 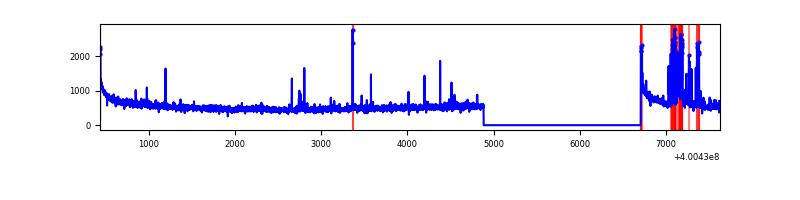 |
| B | 7189 | 5368 | 107 | 107 | 1.49% | 1.99% | 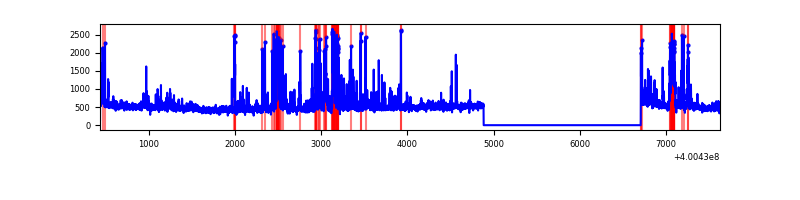 |
| C | 7189 | 5368 | 24 | 24 | 0.33% | 0.45% | 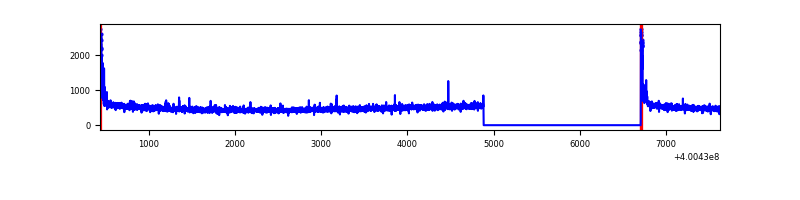 |
| D | 7189 | 5368 | 352 | 352 | 4.90% | 6.56% | 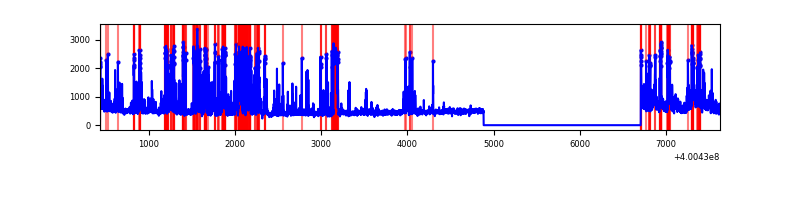 |
Top three noisy pixels from each quadrant. If the there are fewer than three noisy pixels in the level2.evt file, extra rows are filled as -1
| Pixel properties | Quadrant properties | ||||||
|---|---|---|---|---|---|---|---|
| Quadrant | DetID | PixID | Counts | Sigma | Mean | Median | Sigma |
| A | 10 | 83 | 332927 | 2652.66 | 618 | 608 | 125.3 |
| A | 9 | 143 | 199699 | 1589.2 | 618 | 608 | 125.3 |
| A | 15 | 222 | 122382 | 972.03 | 618 | 608 | 125.3 |
| B | 5 | 255 | 438079 | 3699.2 | 616 | 603 | 118.3 |
| B | 5 | 200 | 93290 | 783.74 | 616 | 603 | 118.3 |
| B | 4 | 81 | 82610 | 693.43 | 616 | 603 | 118.3 |
| C | 15 | 214 | 232981 | 1675.91 | 594 | 598 | 138.7 |
| C | 0 | 10 | 116752 | 837.68 | 594 | 598 | 138.7 |
| C | 14 | 254 | 6649 | 43.64 | 594 | 598 | 138.7 |
| D | 2 | 250 | 1046202 | 7304.55 | 580 | 563 | 143.1 |
| D | 2 | 153 | 137491 | 956.54 | 580 | 563 | 143.1 |
| D | 12 | 235 | 101542 | 705.41 | 580 | 563 | 143.1 |
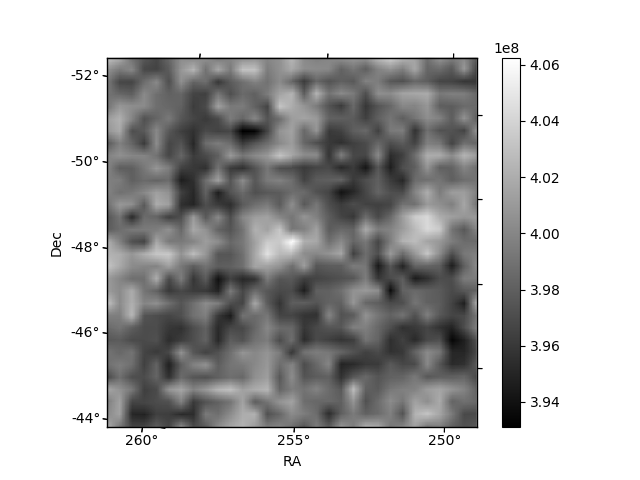
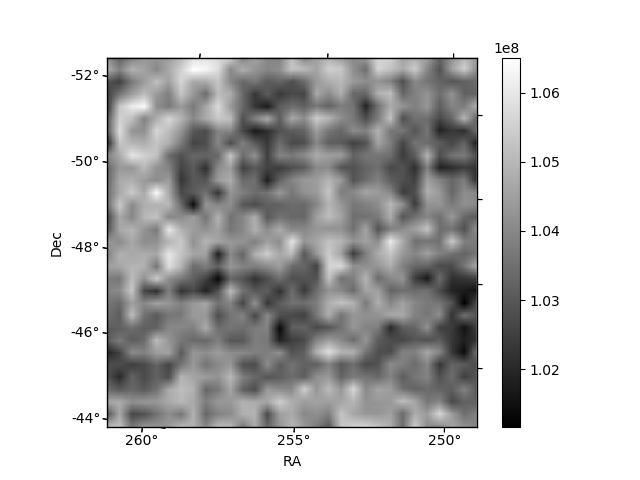
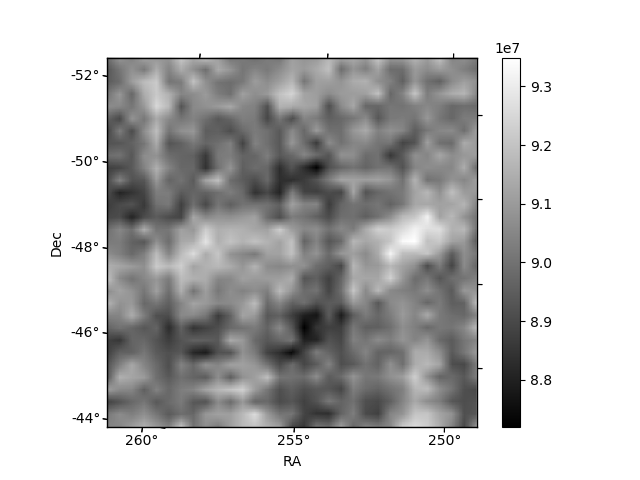
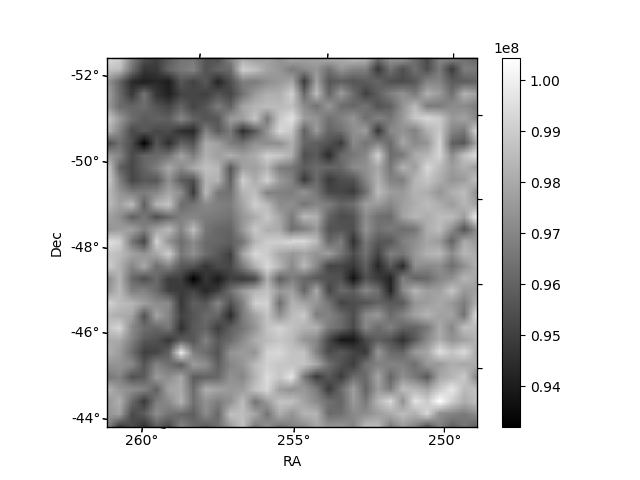
Histogram calculated using DETX and DETY for each event in the final _common_clean file
| Quadrant A | 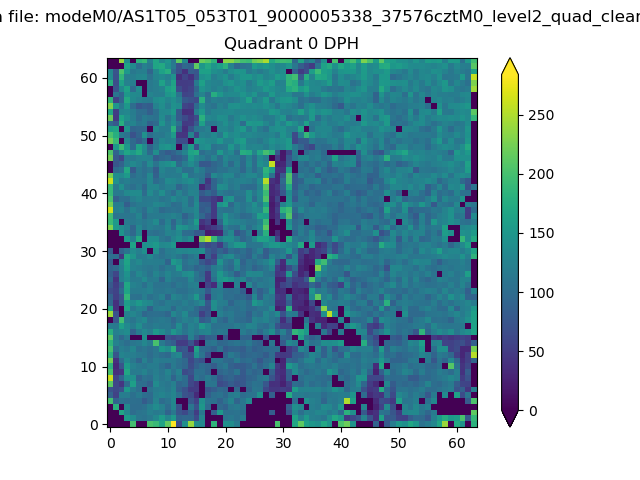 |
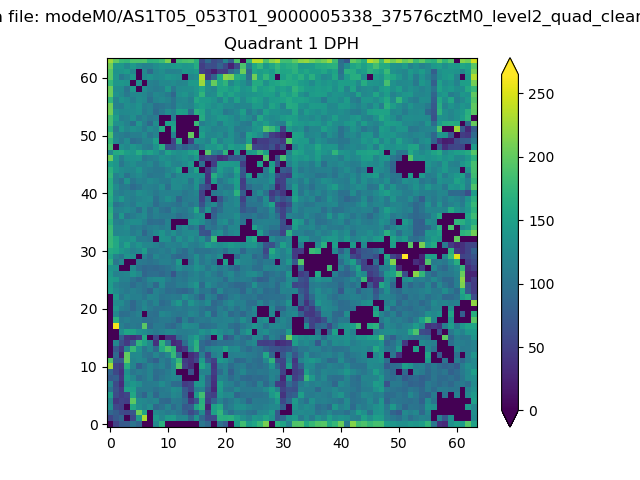 |
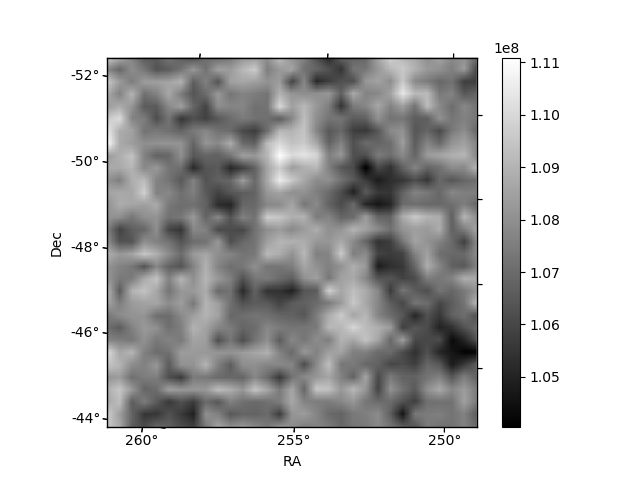
Quadrant B |
|---|---|---|---|
| Quadrant D | 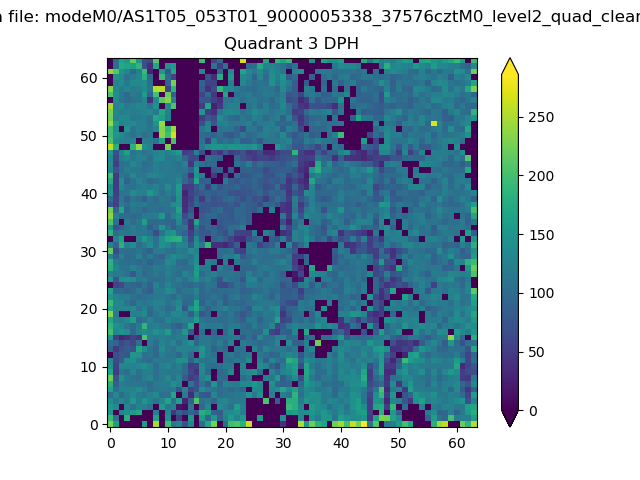 |
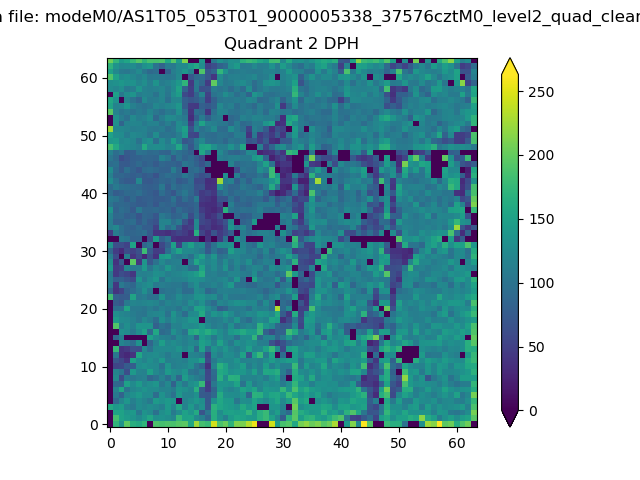 |
Quadrant C |
| Plot type | Count rate plots | Images |
|---|---|---|
| Comparison with Poisson distribution Blue bars denote a histogram of data divided into 1 sec bins. Red curve is a Poisson curve with rate = median count rate of data. |
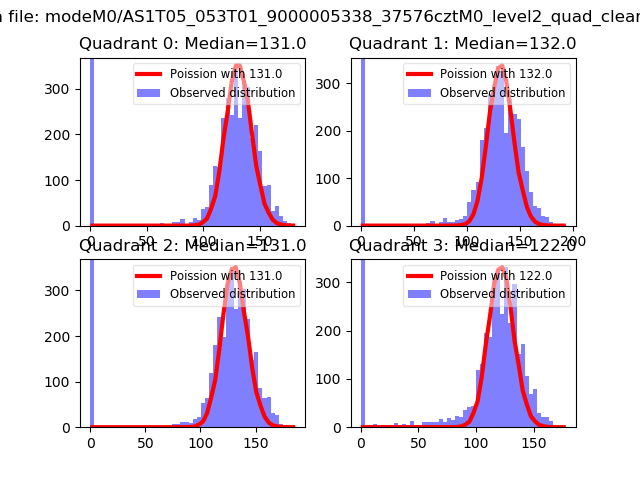 |
 |
| Quadrant-wise count rates Data is divided into 100 sec bins |
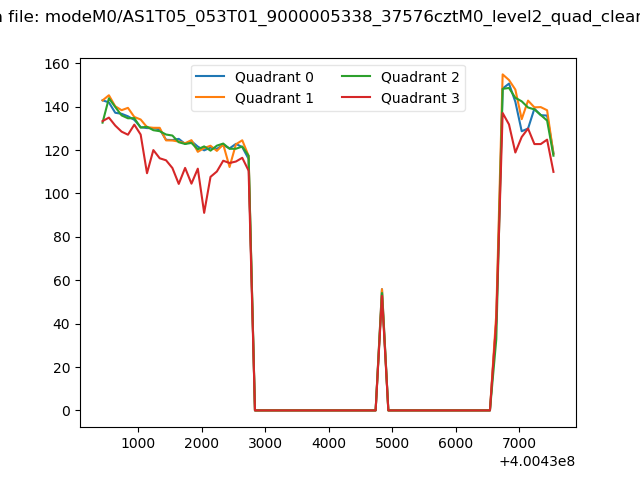 |
|
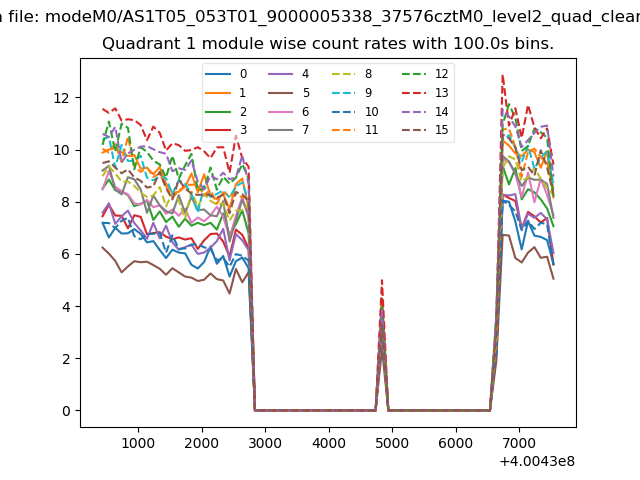
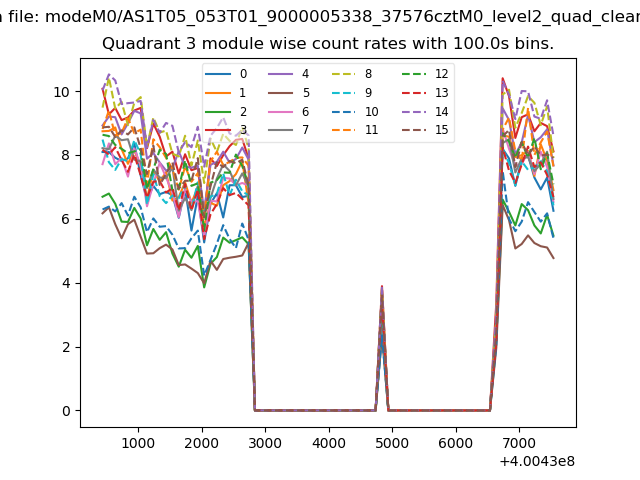
| Module-wise count rates for Quadrant A Data is divided into 100 sec bins |
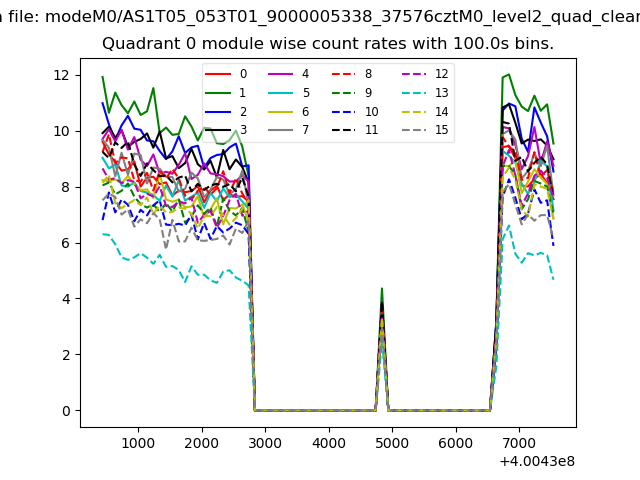 |
 |
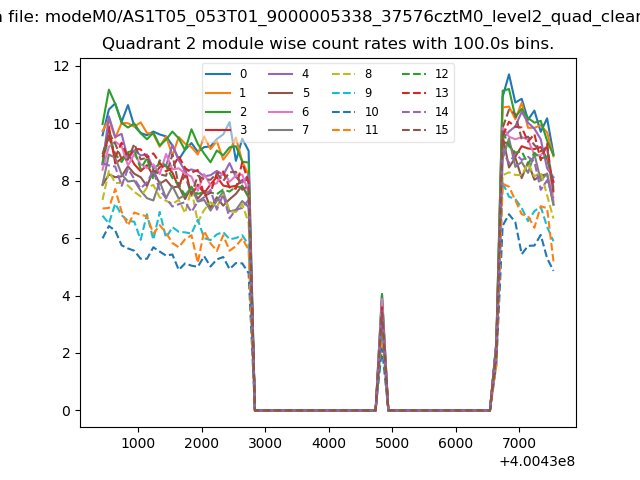
| Module-wise count rates for Quadrant B Data is divided into 100 sec bins |
 |
 |
| Module-wise count rates for Quadrant C Data is divided into 100 sec bins |
 |
 |
| Module-wise count rates for Quadrant D Data is divided into 100 sec bins |
 |
 |
| Parameter | Plot |
|---|---|
| CZT HV Monitor |  |
| D_VDD | 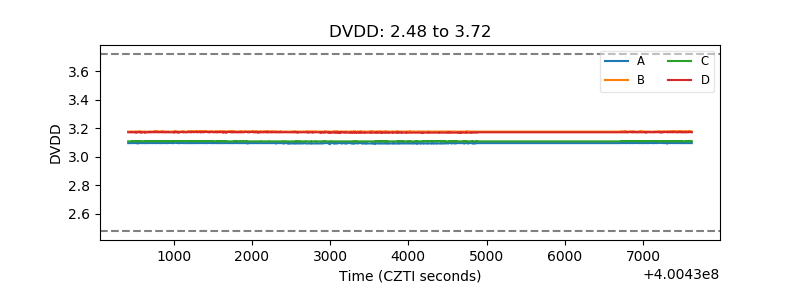 |
| Temperature 1 | 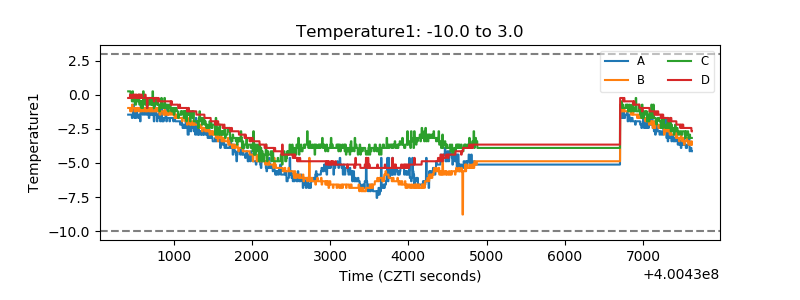 |
| Veto HV Monitor | 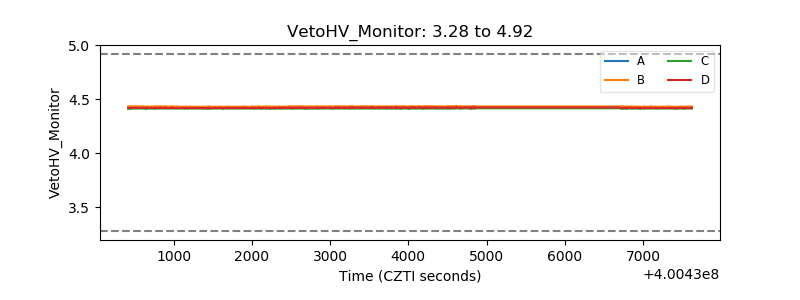 |
| Veto LLD | 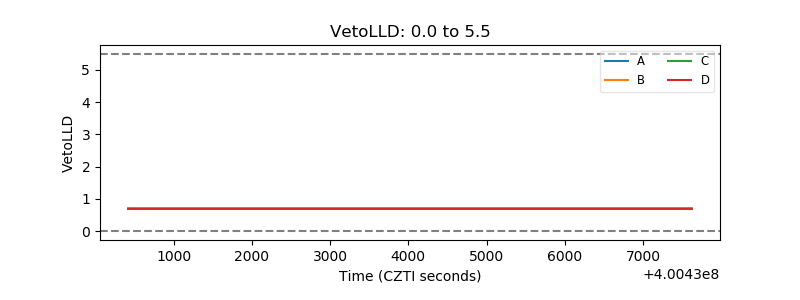 |
| Alpha Counter | 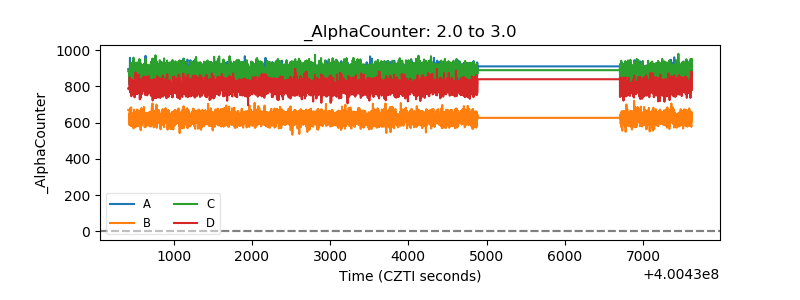 |
| _CPM_Rate | 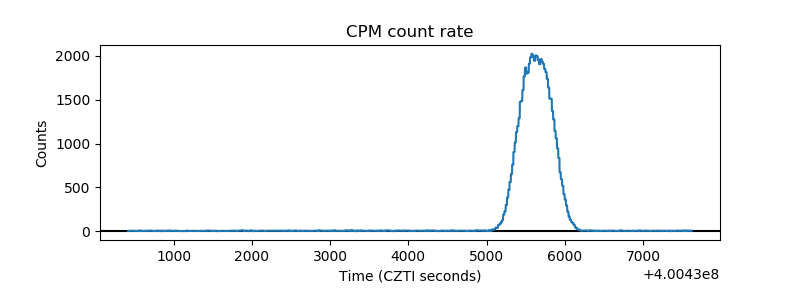 |
| CZT Counter | 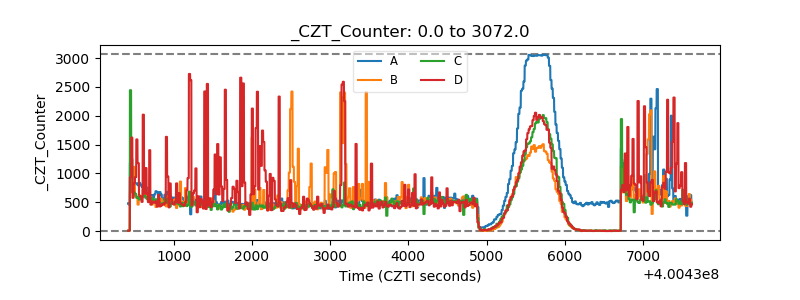 |
| +2.5 Volts monitor | 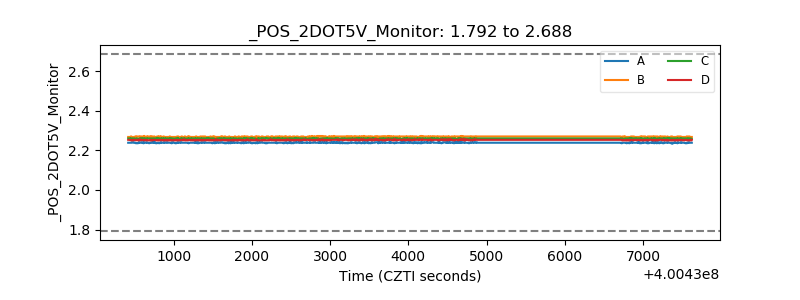 |
| +5 Volts monitor | 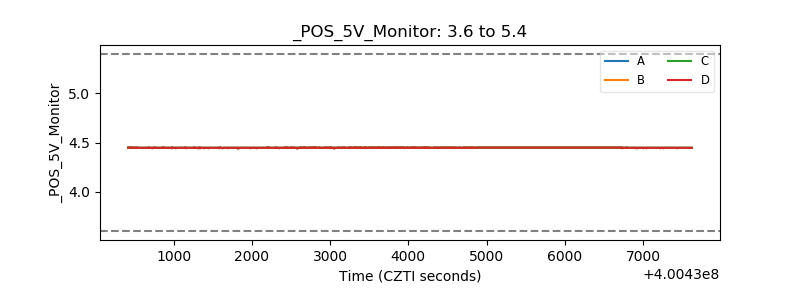 |
| _ROLL_ROT | 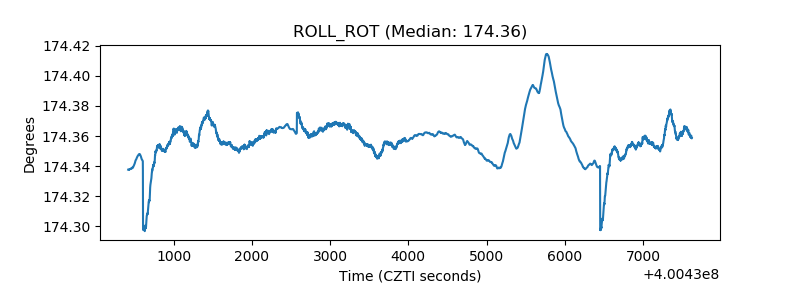 |
| _Roll_DEC | 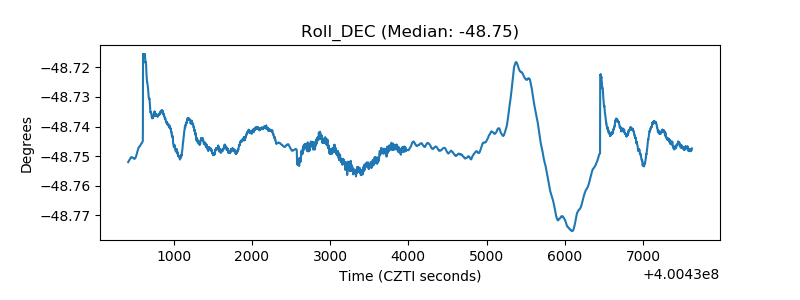 |
| _Roll_RA | 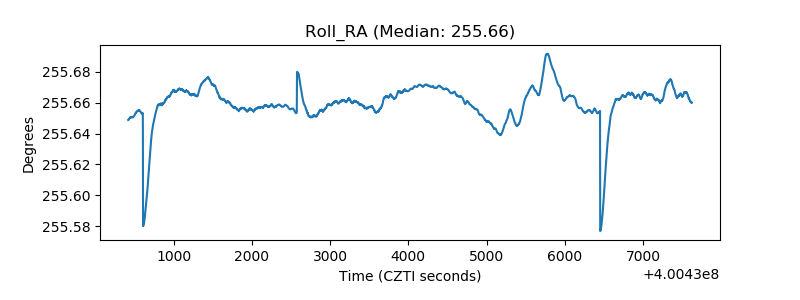 |
| Veto Counter | 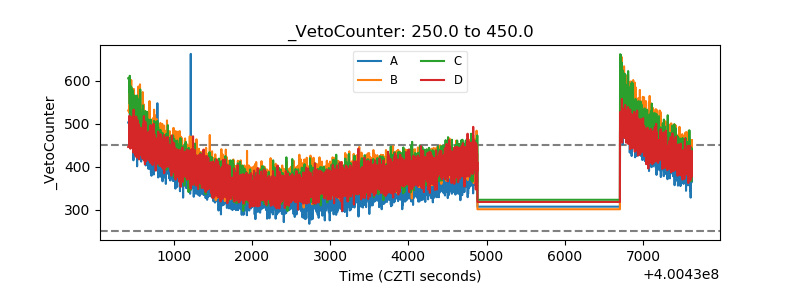 |