| Param | Original file | Final file |
|---|---|---|
| Filename | modeM0/AS1T05_053T01_9000005338_37577cztM0_level2.evt | modeM0/AS1T05_053T01_9000005338_37577cztM0_level2_quad_clean.evt |
| Size (bytes) | 416,404,800 | 67,432,320 |
| Size | 397.1 MB | 64.3 MB |
| Events in quadrant A | 3,010,331 | 426,522 |
| Events in quadrant B | 2,893,255 | 436,475 |
| Events in quadrant C | 2,615,426 | 426,629 |
| Events in quadrant D | 3,742,917 | 392,065 |
| Mode SS | |||
|---|---|---|---|
| Quadrant | BADHDUFLAG | Total packets | Discarded packets |
| A | 0 | 104 | 0 |
| B | 0 | 104 | 0 |
| C | 0 | 104 | 0 |
| D | 0 | 104 | 0 |
| Mode M0 | |||
|---|---|---|---|
| Quadrant | BADHDUFLAG | Total packets | Discarded packets |
| A | 0 | 12260 | 3 |
| B | 0 | 11804 | 2 |
| C | 0 | 10838 | 2 |
| D | 0 | 14702 | 2 |
| Mode M9 | |||
|---|---|---|---|
| Quadrant | BADHDUFLAG | Total packets | Discarded packets |
| A | 0 | 20 | 0 |
| B | 0 | 20 | 0 |
| C | 0 | 20 | 0 |
| D | 0 | 21 | 0 |
| Quadrant | Total seconds | Saturated seconds | Saturation percentage |
|---|---|---|---|
| A | 5138 | 74 | 1.440249% |
| B | 5138 | 73 | 1.420786% |
| C | 5138 | 42 | 0.817439% |
| D | 5138 | 192 | 3.736863% |
Noise dominated data is calculated using 1-second bins in cleaned event files. If a bin has >2000 counts, and if more than 50% of those come from <1% of pixels, then it is considered to be noise-dominated and hence unusable.
| Quadrant | # 1 sec bins | Bins with >0 counts | Bins with >2000 counts | High rate bins dominated by noise | Noise dominated (total time) | Noise dominated (detector-on time) | Marked lightcurve |
|---|---|---|---|---|---|---|---|
| A | 7110 | 5139 | 66 | 66 | 0.93% | 1.28% | 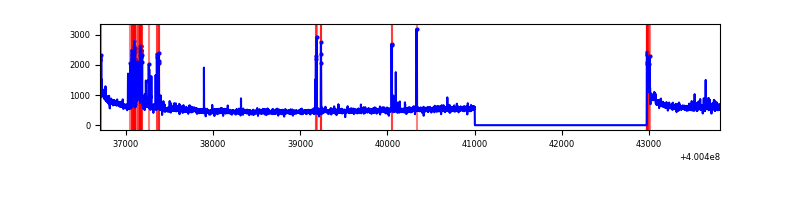 |
| B | 7110 | 5139 | 62 | 62 | 0.87% | 1.21% | 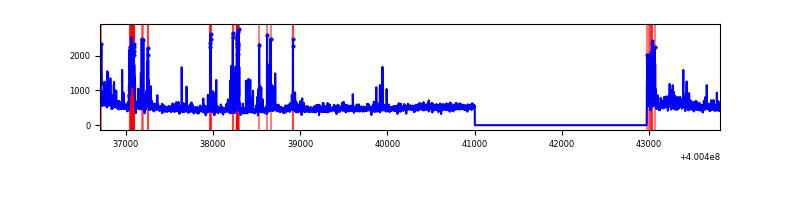 |
| C | 7110 | 5139 | 36 | 36 | 0.51% | 0.70% | 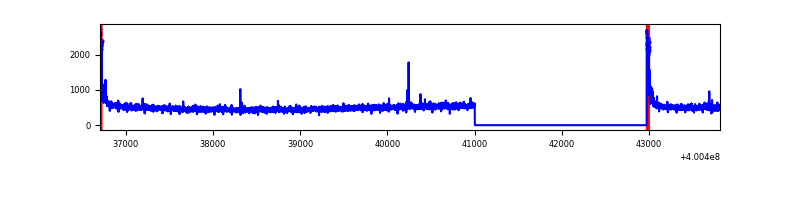 |
| D | 7110 | 5139 | 195 | 195 | 2.74% | 3.79% | 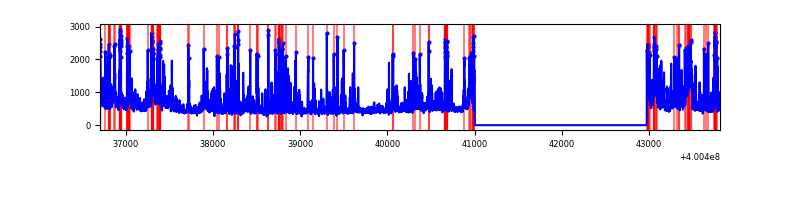 |
Top three noisy pixels from each quadrant. If the there are fewer than three noisy pixels in the level2.evt file, extra rows are filled as -1
| Pixel properties | Quadrant properties | ||||||
|---|---|---|---|---|---|---|---|
| Quadrant | DetID | PixID | Counts | Sigma | Mean | Median | Sigma |
| A | 10 | 83 | 320147 | 2634.54 | 599 | 590 | 121.3 |
| A | 9 | 143 | 247414 | 2034.9 | 599 | 590 | 121.3 |
| A | 15 | 222 | 96901 | 794.02 | 599 | 590 | 121.3 |
| B | 5 | 172 | 129574 | 1129.32 | 603 | 587 | 114.2 |
| B | 5 | 200 | 90746 | 789.37 | 603 | 587 | 114.2 |
| B | 4 | 81 | 68576 | 595.27 | 603 | 587 | 114.2 |
| C | 15 | 214 | 222367 | 1665.38 | 577 | 581 | 133.2 |
| C | 0 | 10 | 122289 | 913.9 | 577 | 581 | 133.2 |
| C | 14 | 254 | 7562 | 52.42 | 577 | 581 | 133.2 |
| D | 2 | 250 | 424086 | 3076.78 | 566 | 550 | 137.7 |
| D | 10 | 253 | 272073 | 1972.48 | 566 | 550 | 137.7 |
| D | 1 | 47 | 255598 | 1852.8 | 566 | 550 | 137.7 |
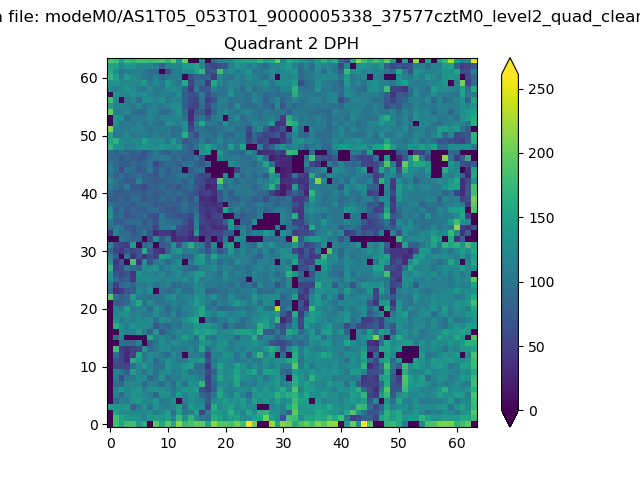
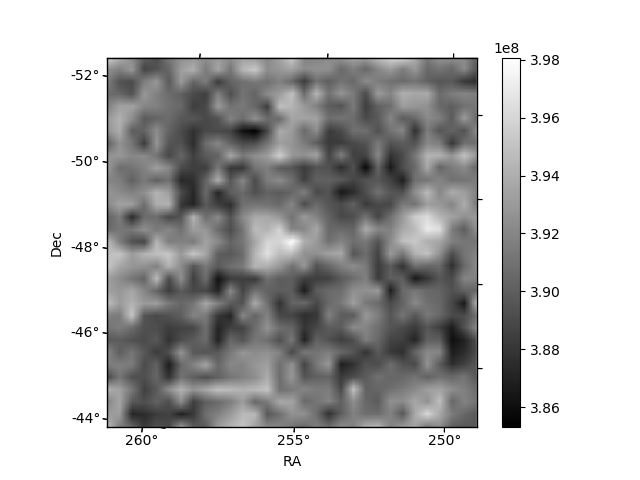
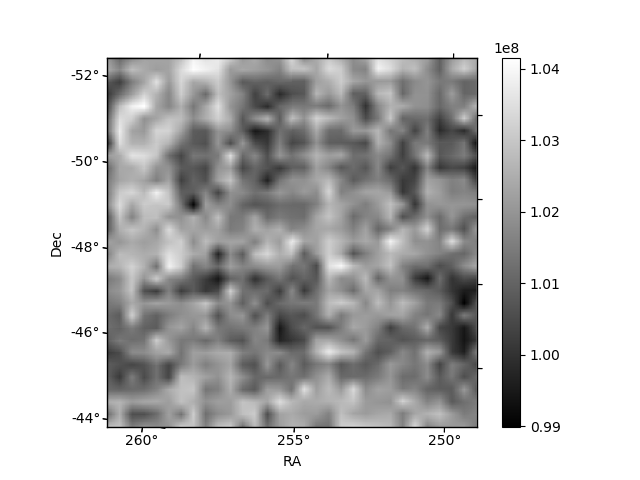
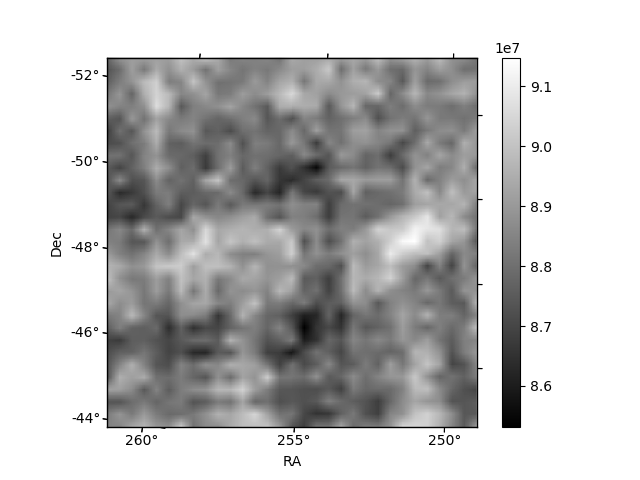
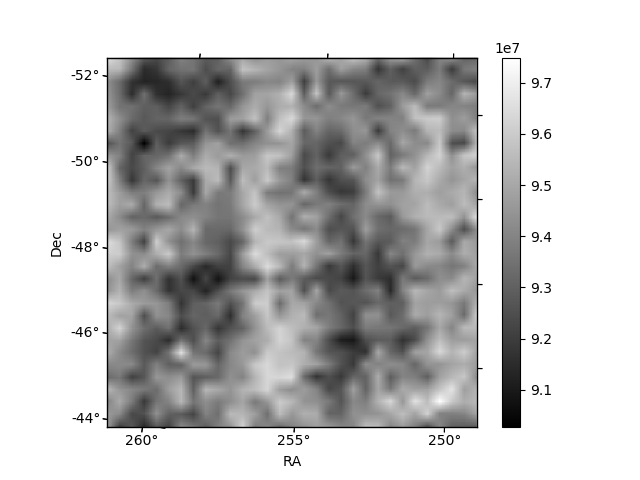
Histogram calculated using DETX and DETY for each event in the final _common_clean file
| Quadrant A | 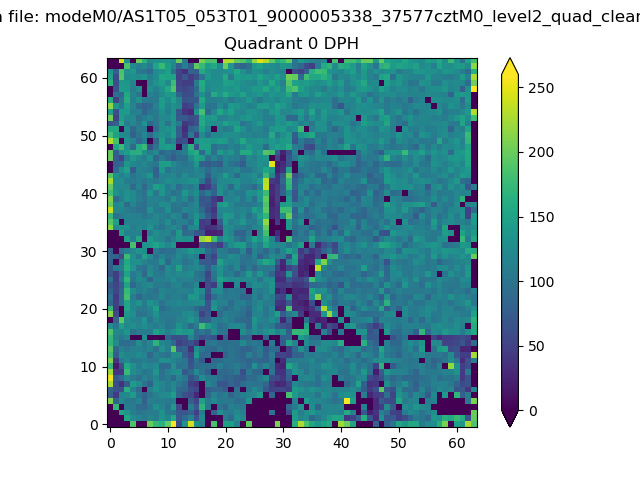 |
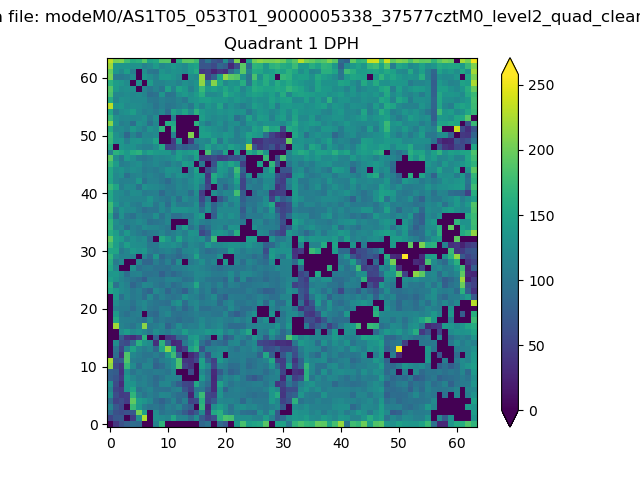 |
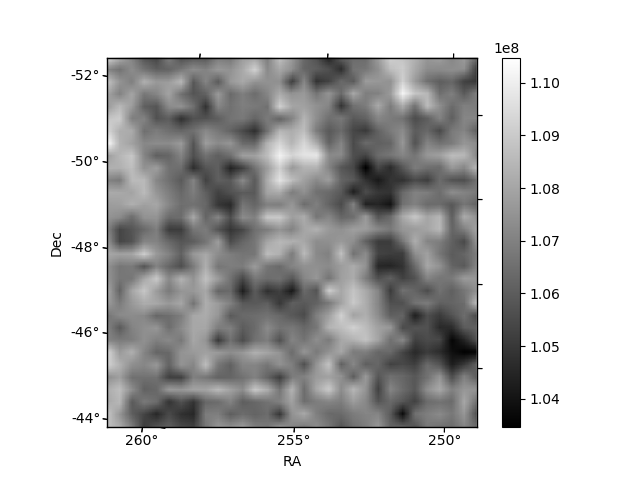
Quadrant B |
|---|---|---|---|
| Quadrant D | 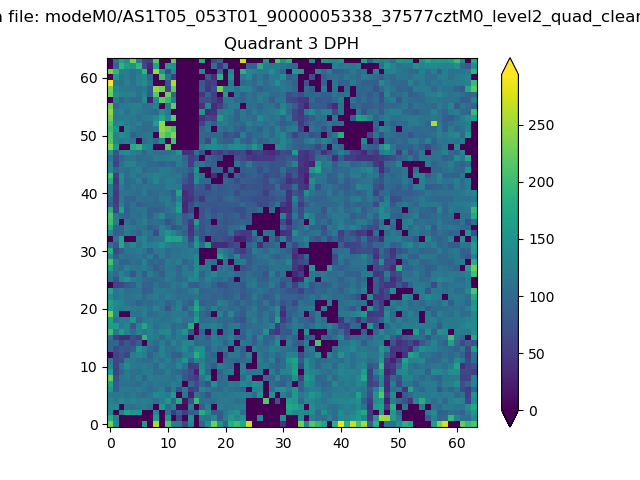 |
 |
Quadrant C |
| Plot type | Count rate plots | Images |
|---|---|---|
| Comparison with Poisson distribution Blue bars denote a histogram of data divided into 1 sec bins. Red curve is a Poisson curve with rate = median count rate of data. |
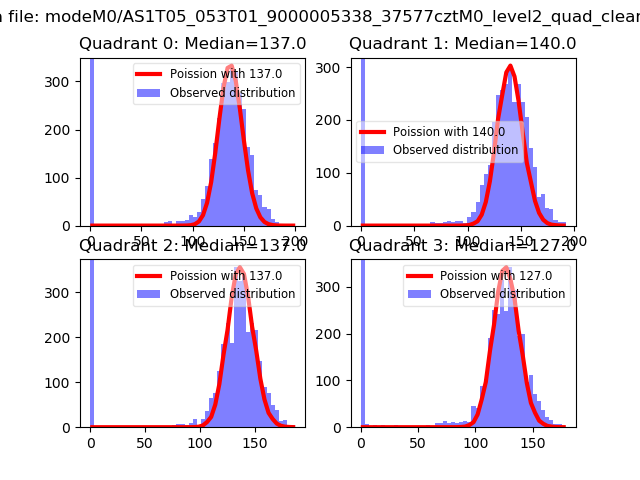 |
 |
| Quadrant-wise count rates Data is divided into 100 sec bins |
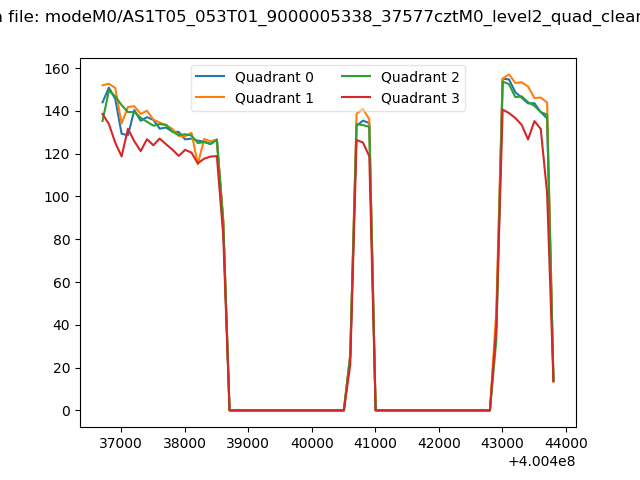 |
|
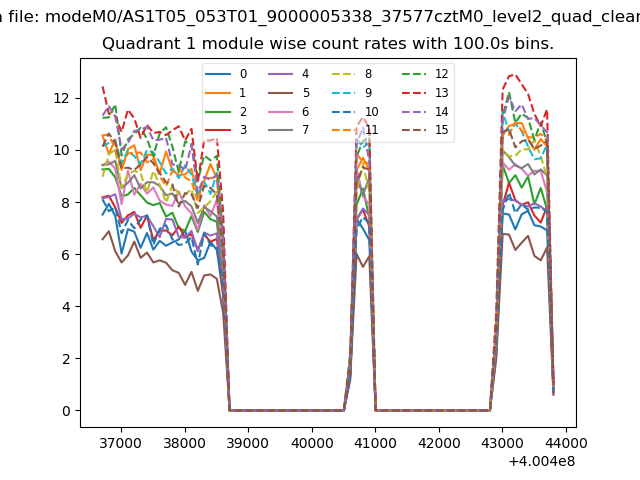
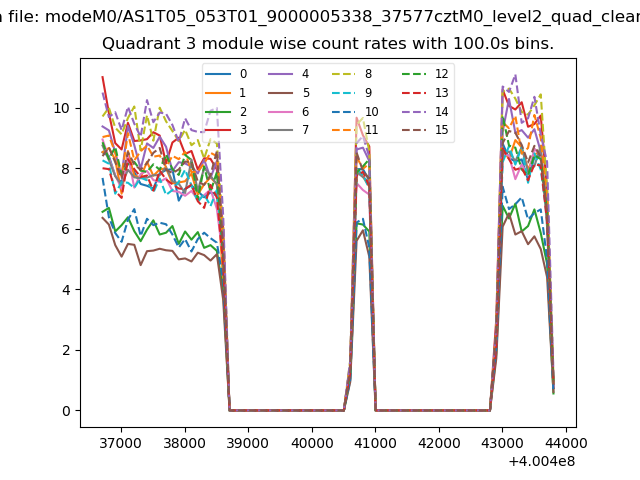
| Module-wise count rates for Quadrant A Data is divided into 100 sec bins |
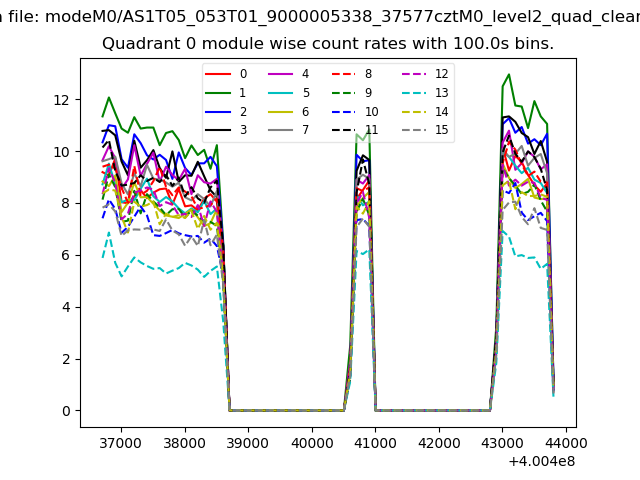 |
 |
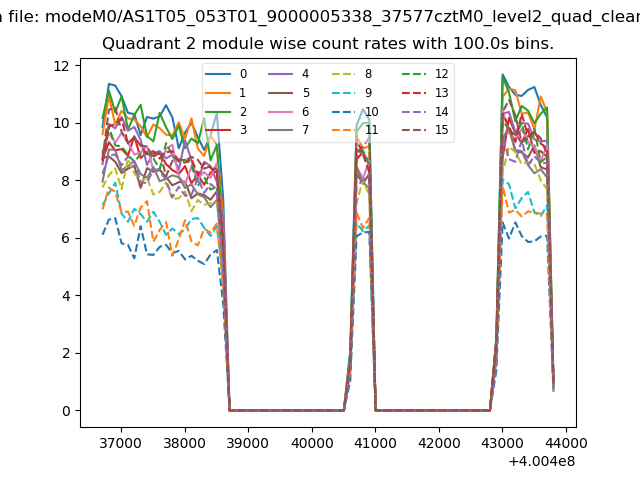
| Module-wise count rates for Quadrant B Data is divided into 100 sec bins |
 |
 |
| Module-wise count rates for Quadrant C Data is divided into 100 sec bins |
 |
 |
| Module-wise count rates for Quadrant D Data is divided into 100 sec bins |
 |
 |
| Parameter | Plot |
|---|---|
| CZT HV Monitor | 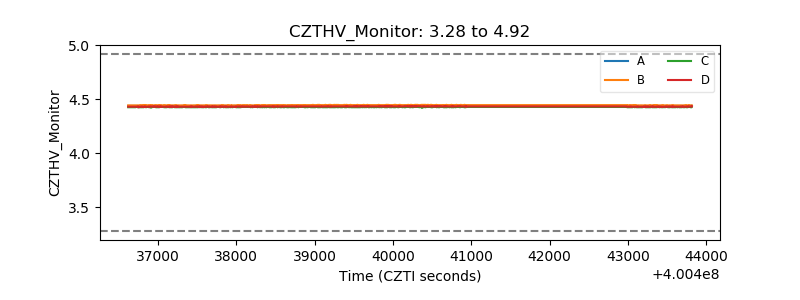 |
| D_VDD | 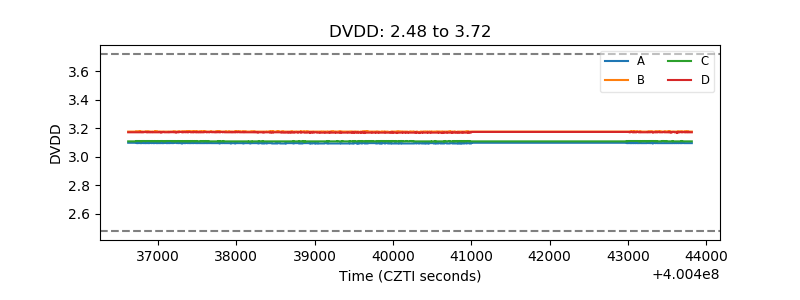 |
| Temperature 1 | 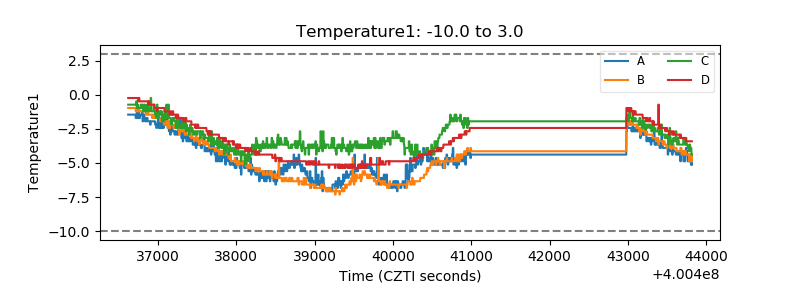 |
| Veto HV Monitor |  |
| Veto LLD | 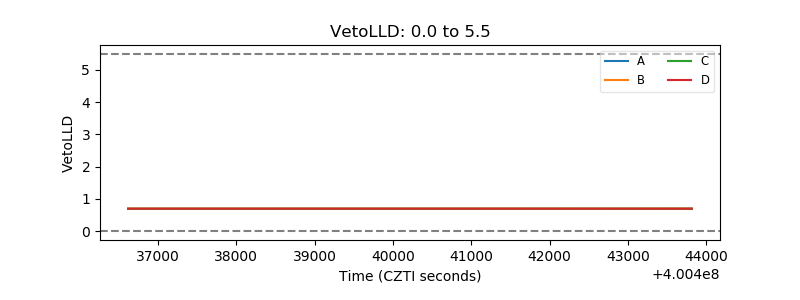 |
| Alpha Counter | 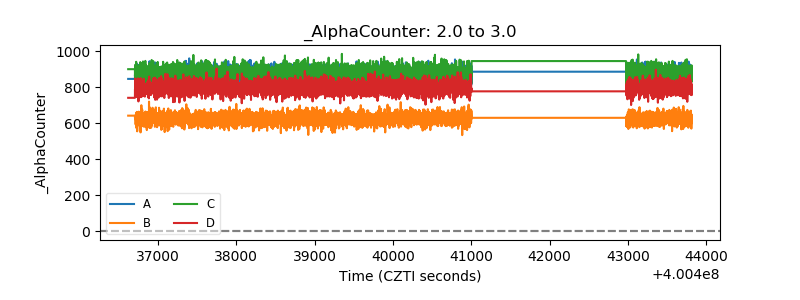 |
| _CPM_Rate | 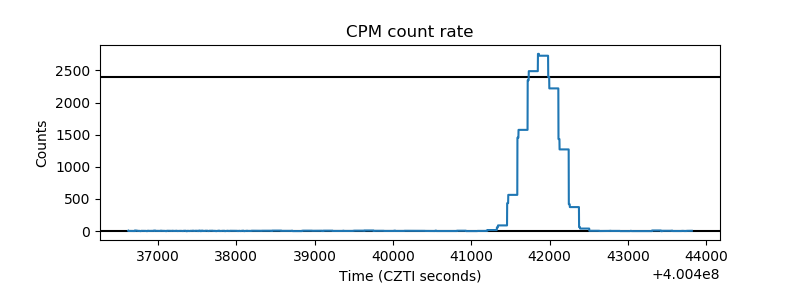 |
| CZT Counter | 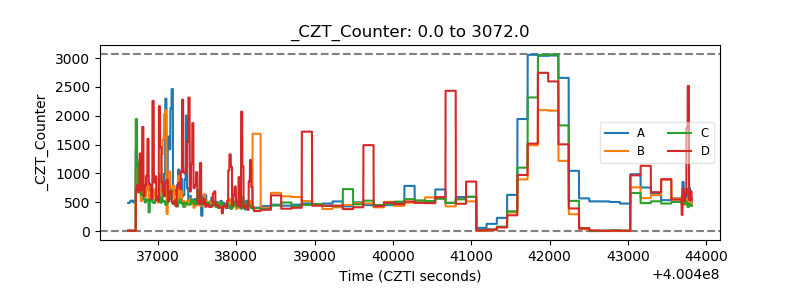 |
| +2.5 Volts monitor | 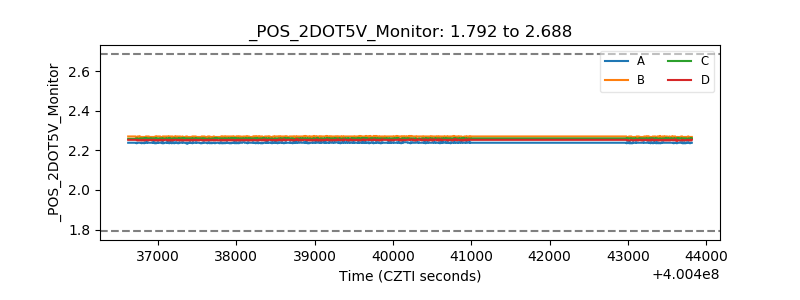 |
| +5 Volts monitor | 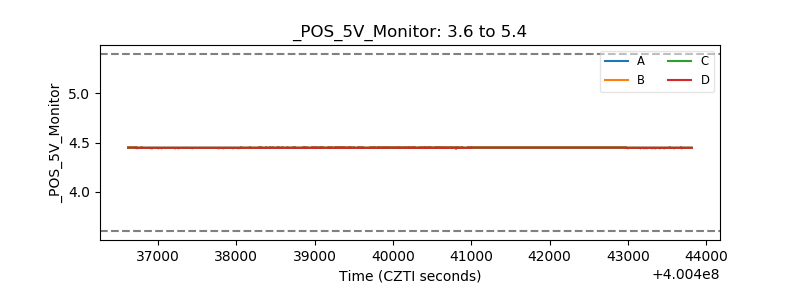 |
| _ROLL_ROT | 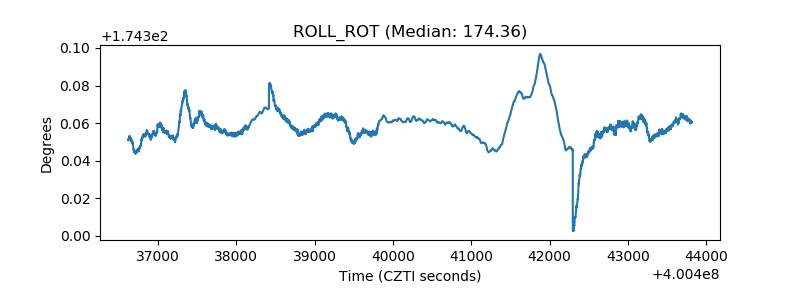 |
| _Roll_DEC | 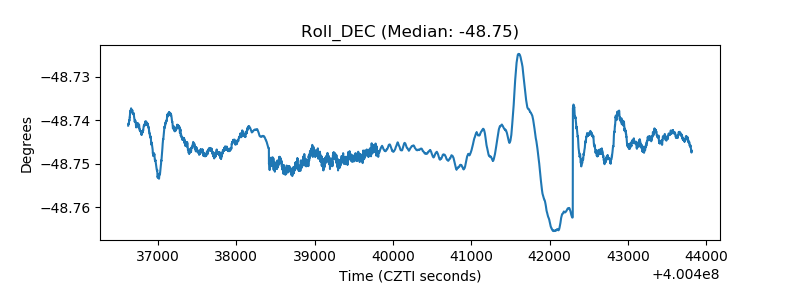 |
| _Roll_RA | 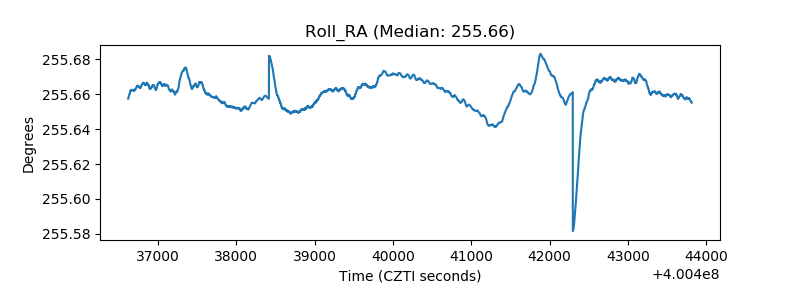 |
| Veto Counter | 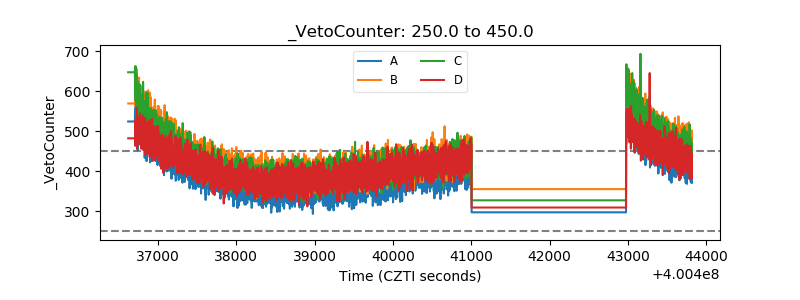 |