| Param | Original file | Final file |
|---|---|---|
| Filename | modeM0/AS1T05_053T01_9000005338_37578cztM0_level2.evt | modeM0/AS1T05_053T01_9000005338_37578cztM0_level2_quad_clean.evt |
| Size (bytes) | 403,424,640 | 64,946,880 |
| Size | 384.7 MB | 61.9 MB |
| Events in quadrant A | 2,744,194 | 413,554 |
| Events in quadrant B | 3,041,752 | 417,012 |
| Events in quadrant C | 2,593,731 | 411,573 |
| Events in quadrant D | 3,501,933 | 377,419 |
| Mode SS | |||
|---|---|---|---|
| Quadrant | BADHDUFLAG | Total packets | Discarded packets |
| A | 0 | 100 | 0 |
| B | 0 | 100 | 0 |
| C | 0 | 100 | 0 |
| D | 0 | 100 | 0 |
| Mode M0 | |||
|---|---|---|---|
| Quadrant | BADHDUFLAG | Total packets | Discarded packets |
| A | 0 | 11210 | 3 |
| B | 0 | 12067 | 2 |
| C | 0 | 10569 | 2 |
| D | 0 | 13767 | 2 |
| Mode M9 | |||
|---|---|---|---|
| Quadrant | BADHDUFLAG | Total packets | Discarded packets |
| A | 0 | 37 | 0 |
| B | 0 | 37 | 0 |
| C | 0 | 37 | 0 |
| D | 0 | 38 | 0 |
| Quadrant | Total seconds | Saturated seconds | Saturation percentage |
|---|---|---|---|
| A | 4950 | 19 | 0.383838% |
| B | 4950 | 125 | 2.525253% |
| C | 4950 | 34 | 0.686869% |
| D | 4950 | 238 | 4.808081% |
Noise dominated data is calculated using 1-second bins in cleaned event files. If a bin has >2000 counts, and if more than 50% of those come from <1% of pixels, then it is considered to be noise-dominated and hence unusable.
| Quadrant | # 1 sec bins | Bins with >0 counts | Bins with >2000 counts | High rate bins dominated by noise | Noise dominated (total time) | Noise dominated (detector-on time) | Marked lightcurve |
|---|---|---|---|---|---|---|---|
| A | 7014 | 4951 | 13 | 13 | 0.19% | 0.26% | 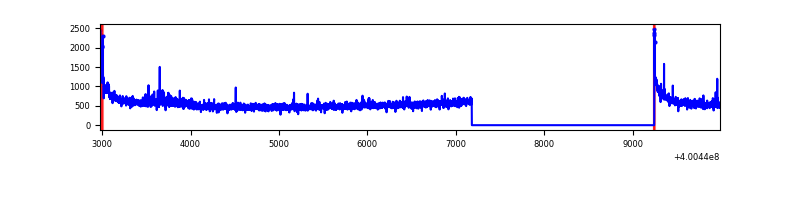 |
| B | 7014 | 4951 | 117 | 117 | 1.67% | 2.36% | 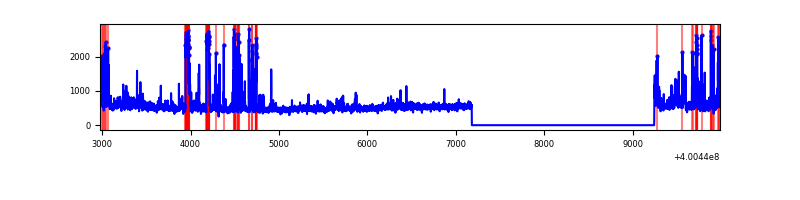 |
| C | 7014 | 4951 | 40 | 40 | 0.57% | 0.81% | 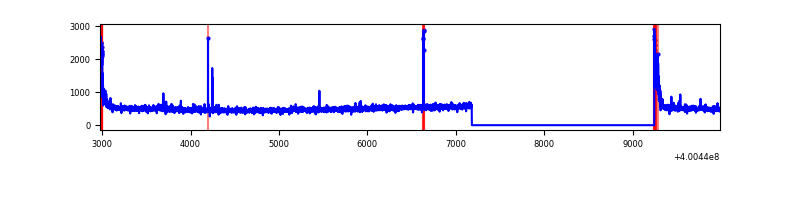 |
| D | 7014 | 4951 | 223 | 223 | 3.18% | 4.50% | 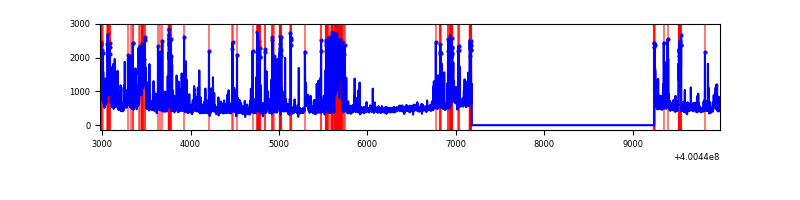 |
Top three noisy pixels from each quadrant. If the there are fewer than three noisy pixels in the level2.evt file, extra rows are filled as -1
| Pixel properties | Quadrant properties | ||||||
|---|---|---|---|---|---|---|---|
| Quadrant | DetID | PixID | Counts | Sigma | Mean | Median | Sigma |
| A | 10 | 83 | 307548 | 2577.84 | 587 | 576 | 119.1 |
| A | 15 | 222 | 100476 | 838.92 | 587 | 576 | 119.1 |
| A | 9 | 143 | 25668 | 210.71 | 587 | 576 | 119.1 |
| B | 5 | 255 | 157742 | 1429.35 | 587 | 573 | 110.0 |
| B | 5 | 200 | 117852 | 1066.57 | 587 | 573 | 110.0 |
| B | 4 | 171 | 103681 | 937.7 | 587 | 573 | 110.0 |
| C | 15 | 214 | 214357 | 1624.15 | 565 | 569 | 131.6 |
| C | 0 | 10 | 133979 | 1013.52 | 565 | 569 | 131.6 |
| C | 14 | 254 | 30693 | 228.85 | 565 | 569 | 131.6 |
| D | 2 | 249 | 451089 | 3338.09 | 547 | 529 | 135.0 |
| D | 10 | 253 | 204192 | 1508.89 | 547 | 529 | 135.0 |
| D | 2 | 250 | 182476 | 1348.0 | 547 | 529 | 135.0 |
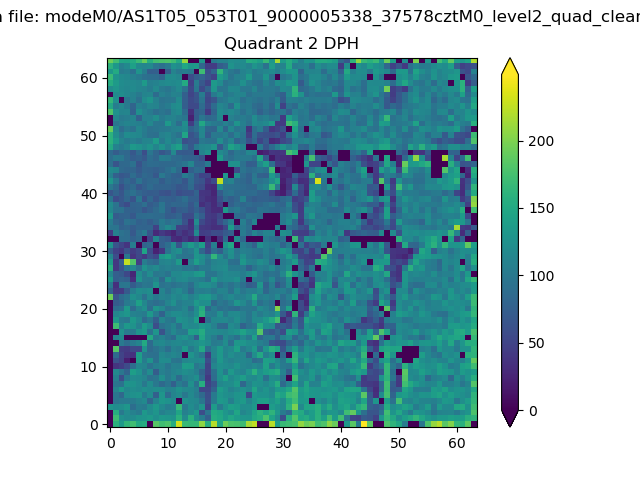
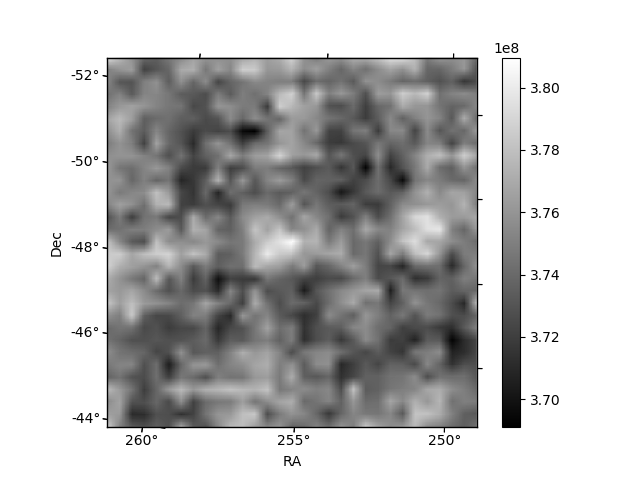
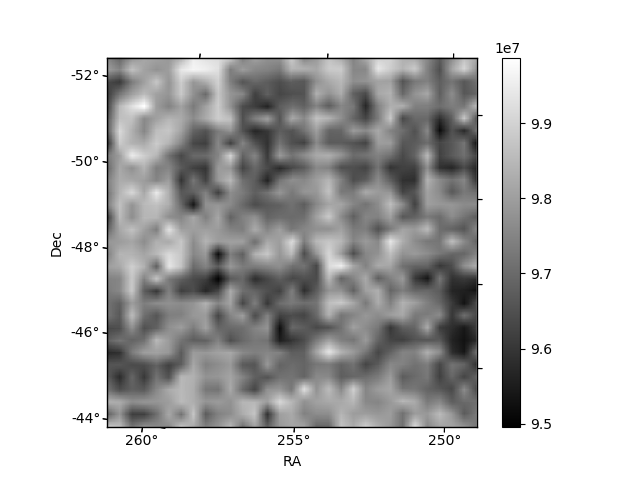
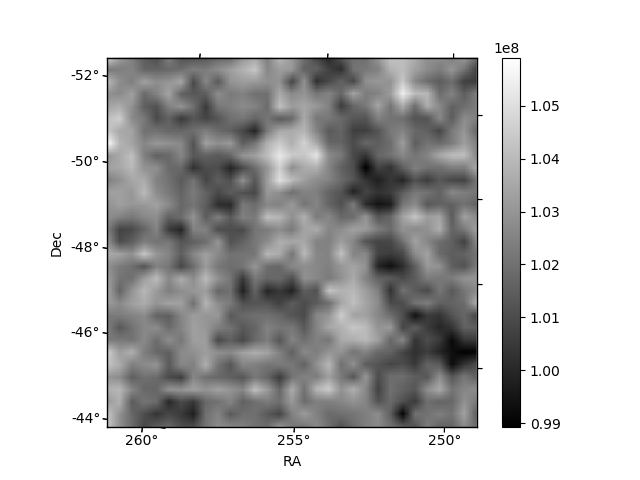
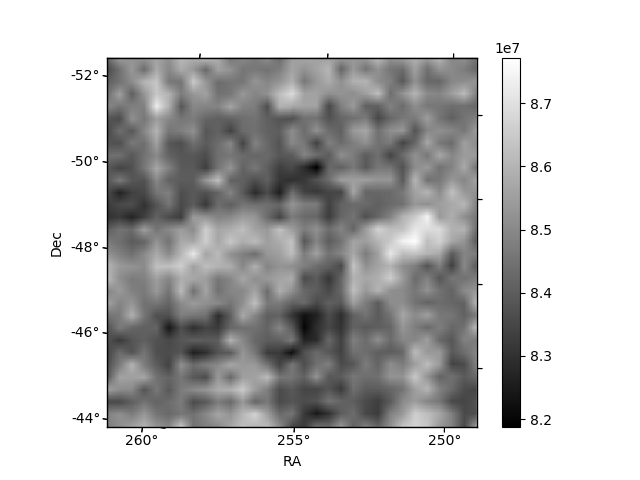
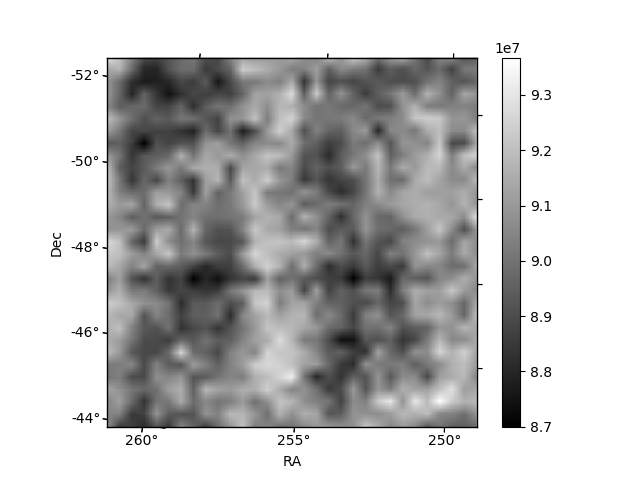
Histogram calculated using DETX and DETY for each event in the final _common_clean file
| Quadrant A | 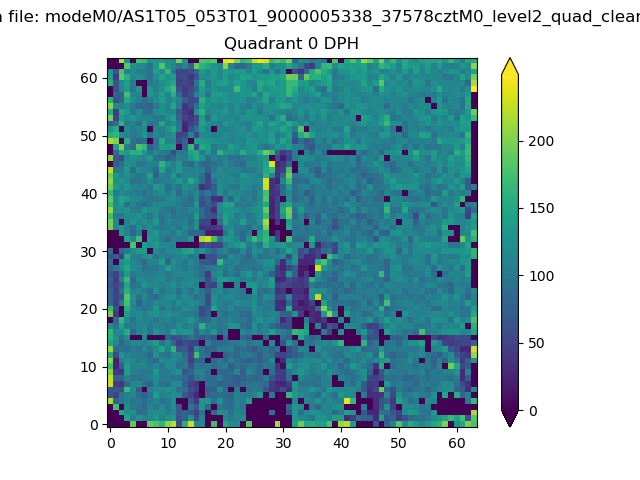 |
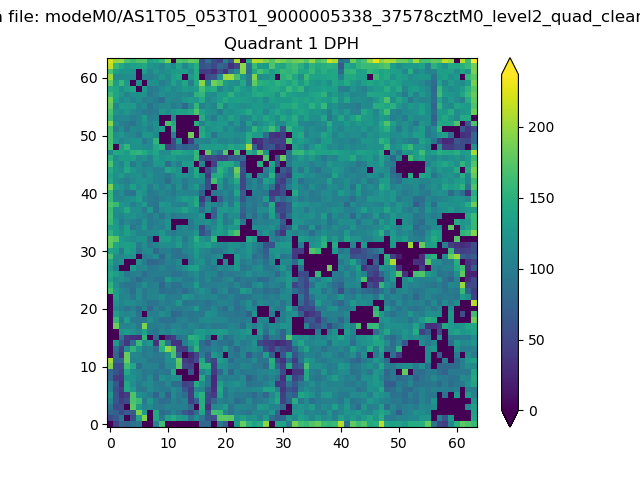 |
Quadrant B |
|---|---|---|---|
| Quadrant D | 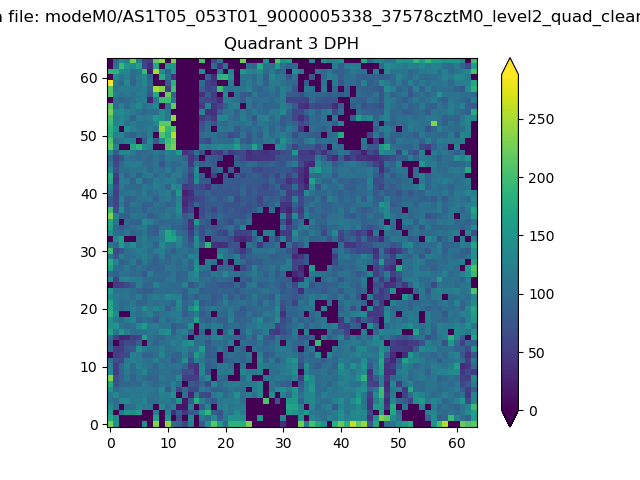 |
 |
Quadrant C |
| Plot type | Count rate plots | Images |
|---|---|---|
| Comparison with Poisson distribution Blue bars denote a histogram of data divided into 1 sec bins. Red curve is a Poisson curve with rate = median count rate of data. |
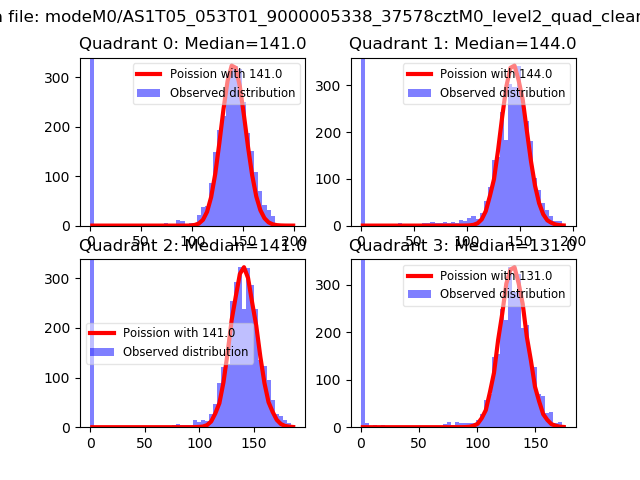 |
 |
| Quadrant-wise count rates Data is divided into 100 sec bins |
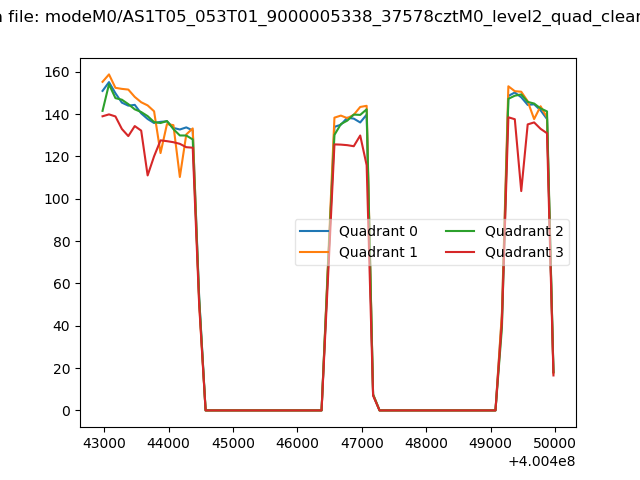 |
|
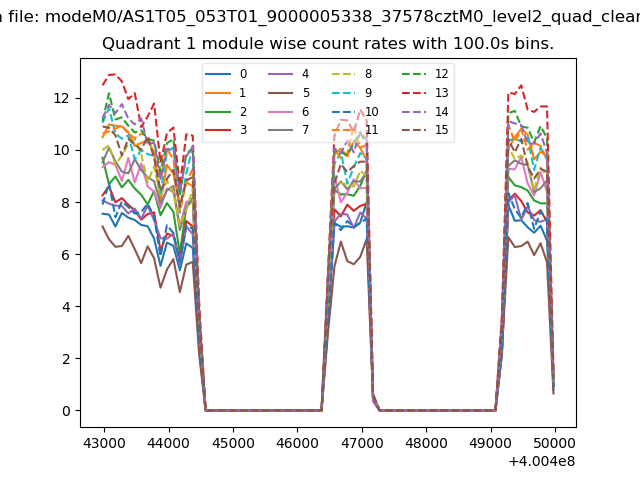
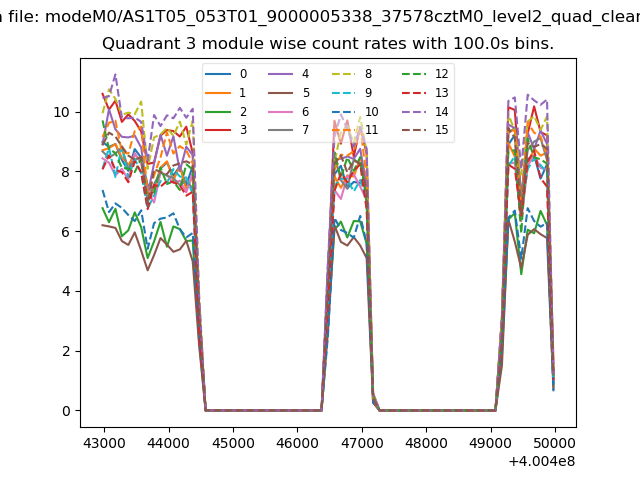
| Module-wise count rates for Quadrant A Data is divided into 100 sec bins |
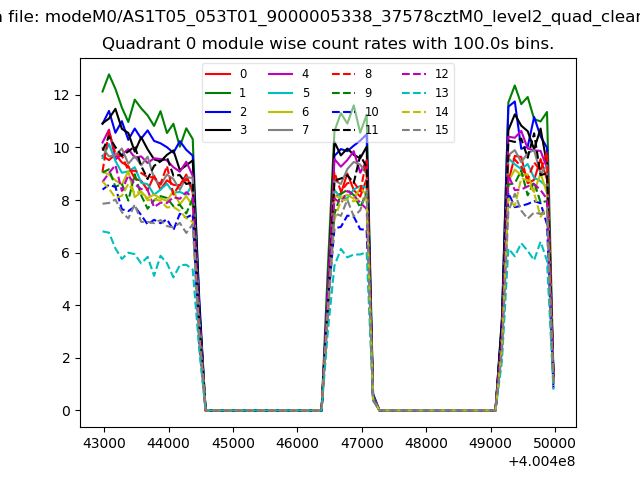 |
 |
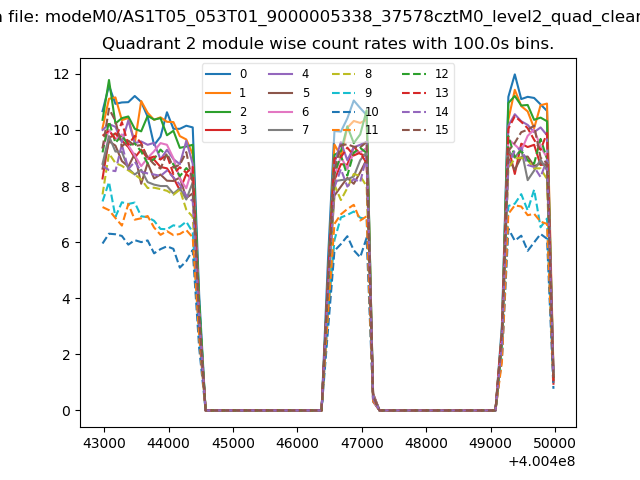
| Module-wise count rates for Quadrant B Data is divided into 100 sec bins |
 |
 |
| Module-wise count rates for Quadrant C Data is divided into 100 sec bins |
 |
 |
| Module-wise count rates for Quadrant D Data is divided into 100 sec bins |
 |
 |
| Parameter | Plot |
|---|---|
| CZT HV Monitor | 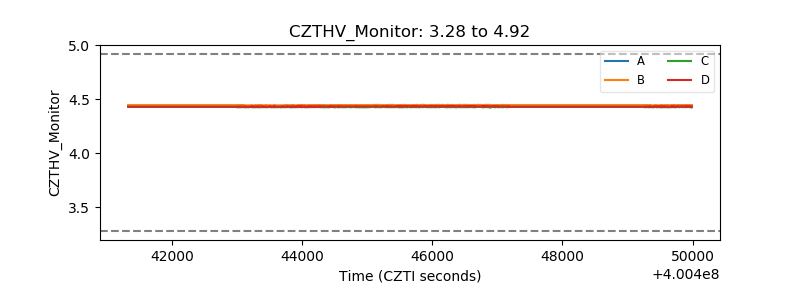 |
| D_VDD | 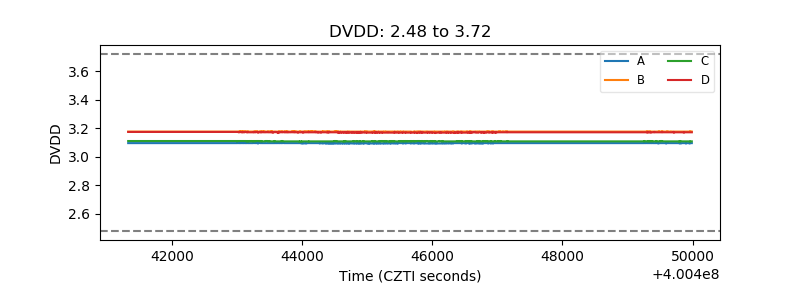 |
| Temperature 1 | 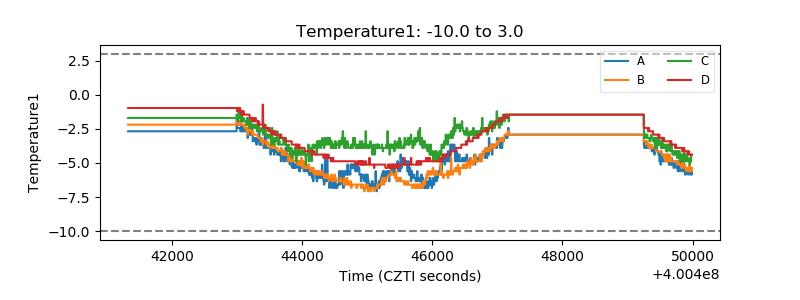 |
| Veto HV Monitor | 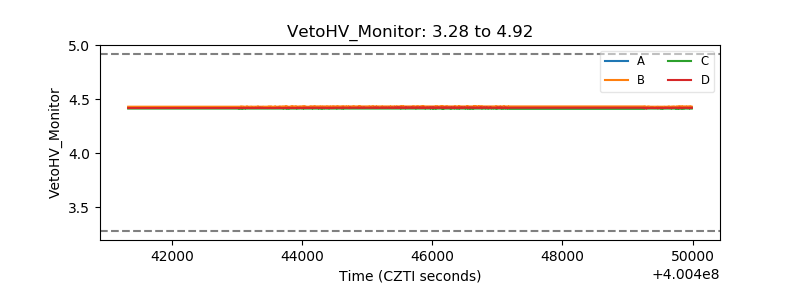 |
| Veto LLD | 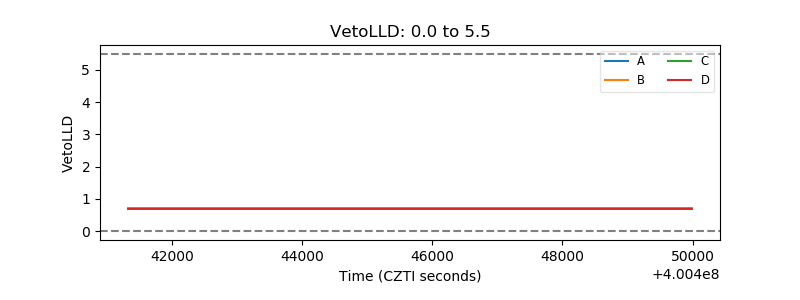 |
| Alpha Counter | 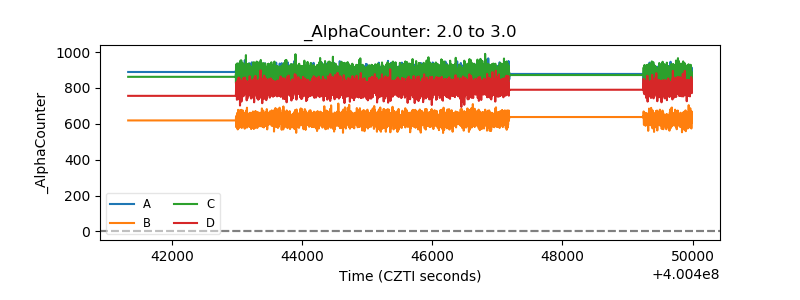 |
| _CPM_Rate | 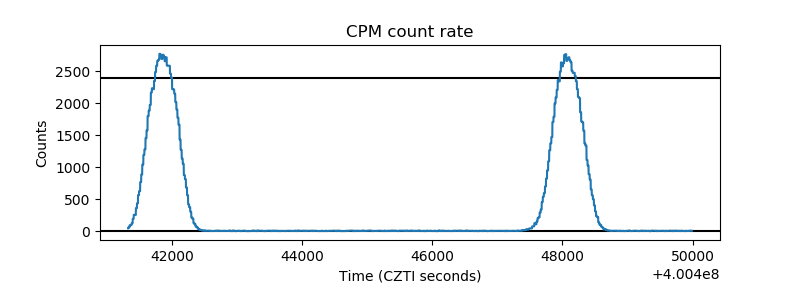 |
| CZT Counter | 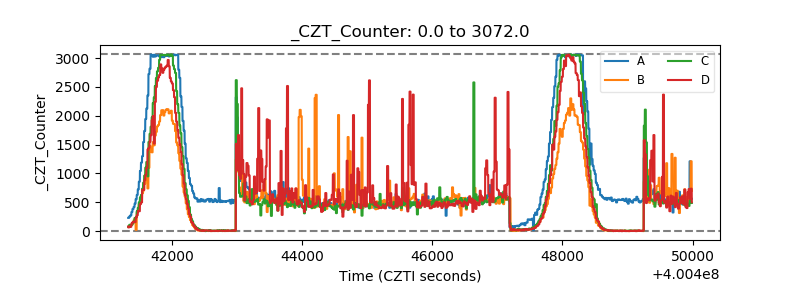 |
| +2.5 Volts monitor | 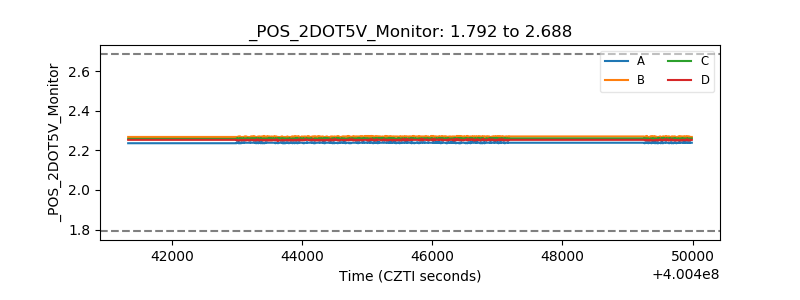 |
| +5 Volts monitor | 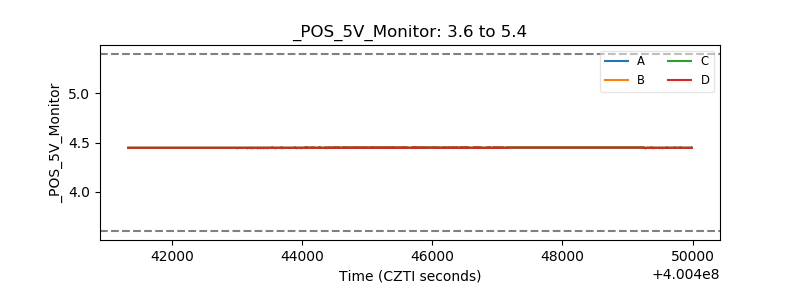 |
| _ROLL_ROT | 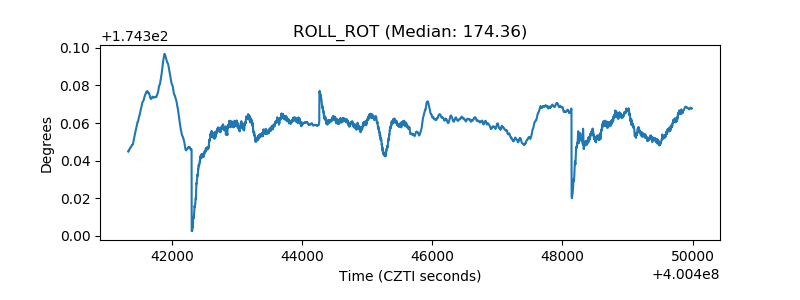 |
| _Roll_DEC | 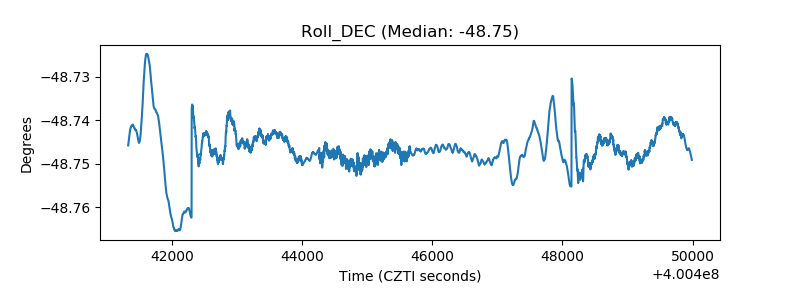 |
| _Roll_RA | 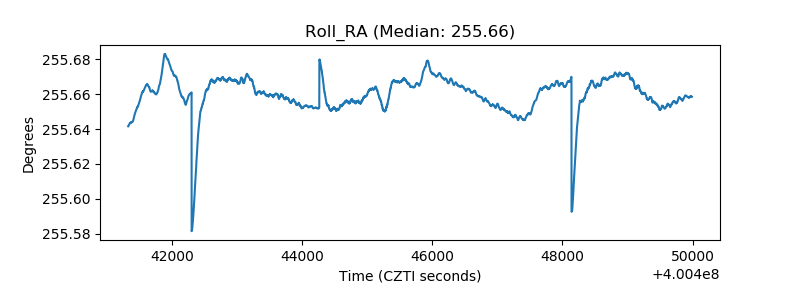 |
| Veto Counter | 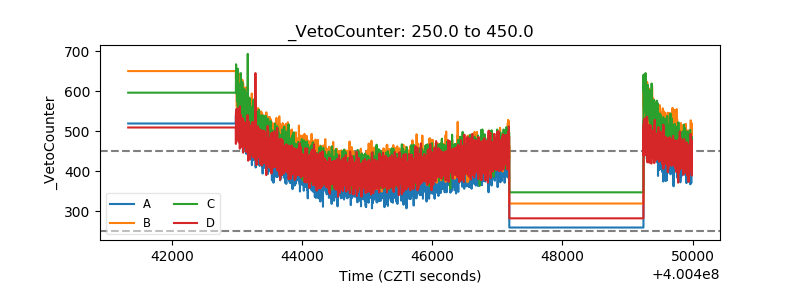 |