| Param | Original file | Final file |
|---|---|---|
| Filename | modeM0/AS1T05_053T01_9000005338_37579cztM0_level2.evt | modeM0/AS1T05_053T01_9000005338_37579cztM0_level2_quad_clean.evt |
| Size (bytes) | 395,743,680 | 62,680,320 |
| Size | 377.4 MB | 59.8 MB |
| Events in quadrant A | 3,121,391 | 390,031 |
| Events in quadrant B | 2,836,208 | 401,488 |
| Events in quadrant C | 2,600,321 | 395,690 |
| Events in quadrant D | 3,090,242 | 362,966 |
| Mode SS | |||
|---|---|---|---|
| Quadrant | BADHDUFLAG | Total packets | Discarded packets |
| A | 0 | 102 | 0 |
| B | 0 | 102 | 0 |
| C | 0 | 102 | 0 |
| D | 0 | 102 | 0 |
| Mode M0 | |||
|---|---|---|---|
| Quadrant | BADHDUFLAG | Total packets | Discarded packets |
| A | 0 | 12356 | 3 |
| B | 0 | 11444 | 2 |
| C | 0 | 10607 | 2 |
| D | 0 | 12472 | 2 |
| Mode M9 | |||
|---|---|---|---|
| Quadrant | BADHDUFLAG | Total packets | Discarded packets |
| A | 0 | 37 | 0 |
| B | 0 | 37 | 0 |
| C | 0 | 37 | 0 |
| D | 0 | 38 | 0 |
| Quadrant | Total seconds | Saturated seconds | Saturation percentage |
|---|---|---|---|
| A | 4953 | 40 | 0.807591% |
| B | 4953 | 60 | 1.211387% |
| C | 4953 | 27 | 0.545124% |
| D | 4953 | 143 | 2.887139% |
Noise dominated data is calculated using 1-second bins in cleaned event files. If a bin has >2000 counts, and if more than 50% of those come from <1% of pixels, then it is considered to be noise-dominated and hence unusable.
| Quadrant | # 1 sec bins | Bins with >0 counts | Bins with >2000 counts | High rate bins dominated by noise | Noise dominated (total time) | Noise dominated (detector-on time) | Marked lightcurve |
|---|---|---|---|---|---|---|---|
| A | 7076 | 4954 | 40 | 40 | 0.57% | 0.81% | 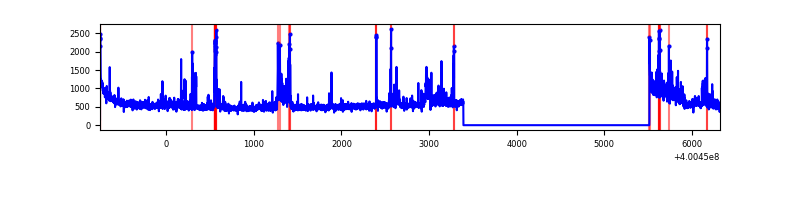 |
| B | 7076 | 4954 | 46 | 46 | 0.65% | 0.93% | 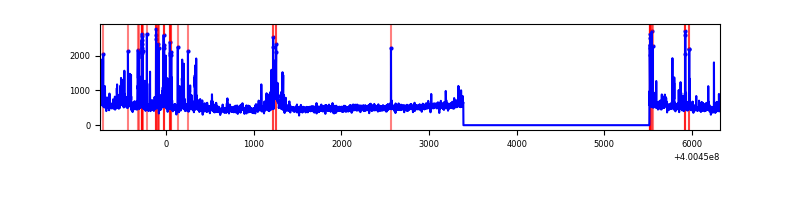 |
| C | 7076 | 4954 | 37 | 37 | 0.52% | 0.75% | 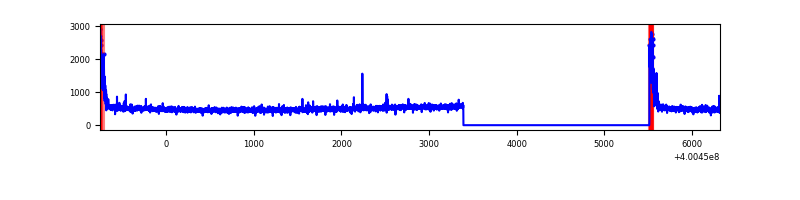 |
| D | 7076 | 4954 | 148 | 148 | 2.09% | 2.99% | 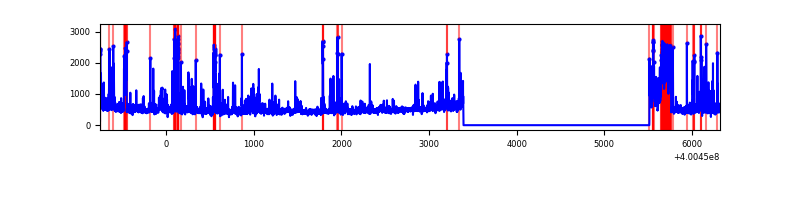 |
Top three noisy pixels from each quadrant. If the there are fewer than three noisy pixels in the level2.evt file, extra rows are filled as -1
| Pixel properties | Quadrant properties | ||||||
|---|---|---|---|---|---|---|---|
| Quadrant | DetID | PixID | Counts | Sigma | Mean | Median | Sigma |
| A | 15 | 222 | 449248 | 3850.75 | 582 | 572 | 116.5 |
| A | 10 | 83 | 294959 | 2526.57 | 582 | 572 | 116.5 |
| A | 9 | 143 | 52902 | 449.12 | 582 | 572 | 116.5 |
| B | 4 | 171 | 131103 | 1183.24 | 585 | 570 | 110.3 |
| B | 5 | 172 | 79178 | 712.56 | 585 | 570 | 110.3 |
| B | 0 | 230 | 70711 | 635.81 | 585 | 570 | 110.3 |
| C | 15 | 214 | 212724 | 1610.32 | 566 | 570 | 131.7 |
| C | 0 | 10 | 164659 | 1245.49 | 566 | 570 | 131.7 |
| C | 14 | 254 | 9667 | 69.05 | 566 | 570 | 131.7 |
| D | 2 | 153 | 329596 | 2444.09 | 552 | 537 | 134.6 |
| D | 1 | 47 | 158529 | 1173.49 | 552 | 537 | 134.6 |
| D | 13 | 249 | 123835 | 915.8 | 552 | 537 | 134.6 |
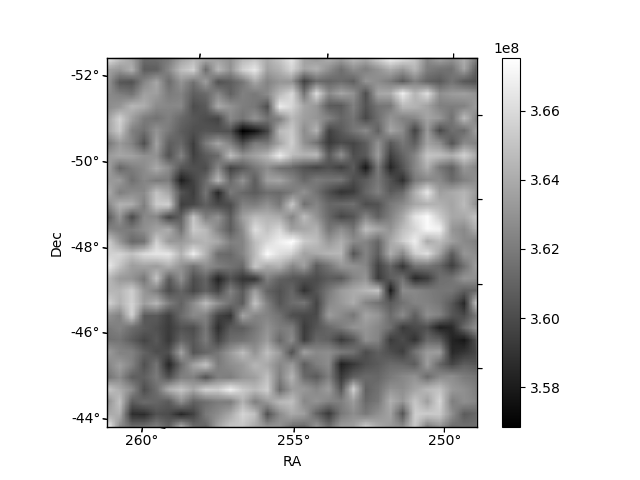
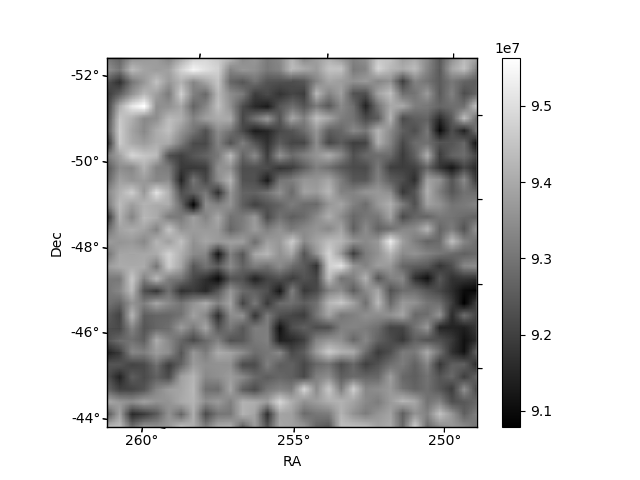
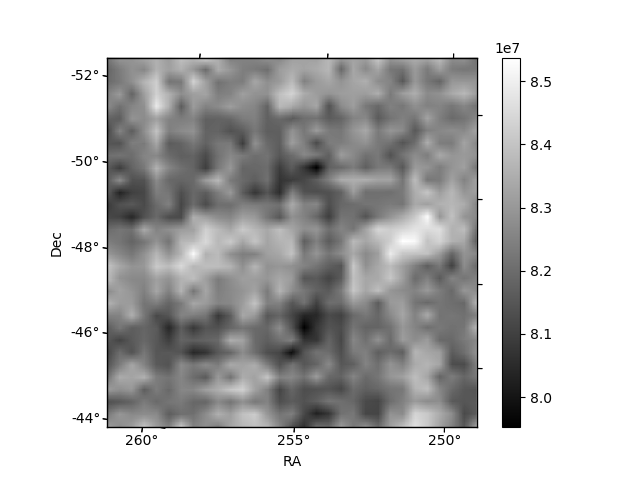
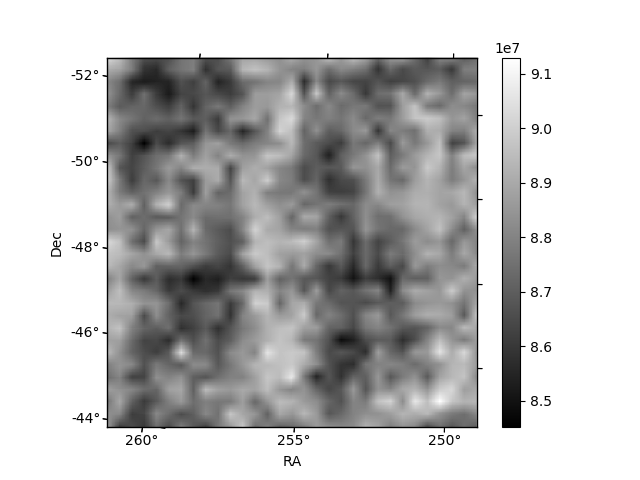
Histogram calculated using DETX and DETY for each event in the final _common_clean file
| Quadrant A | 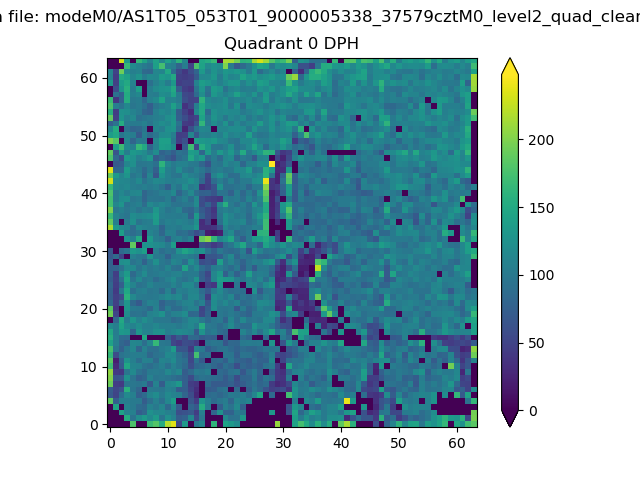 |
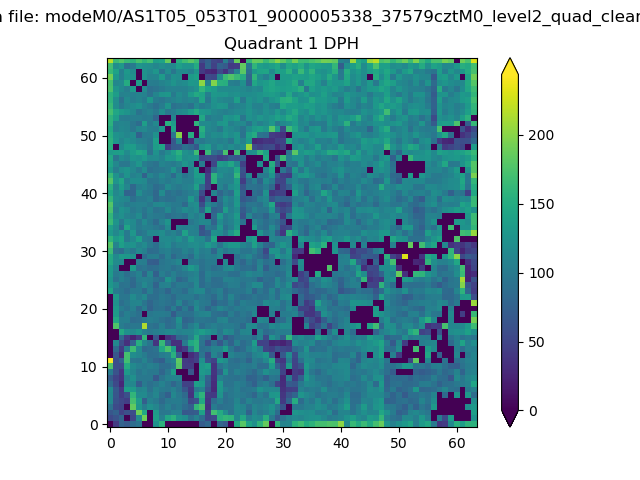 |
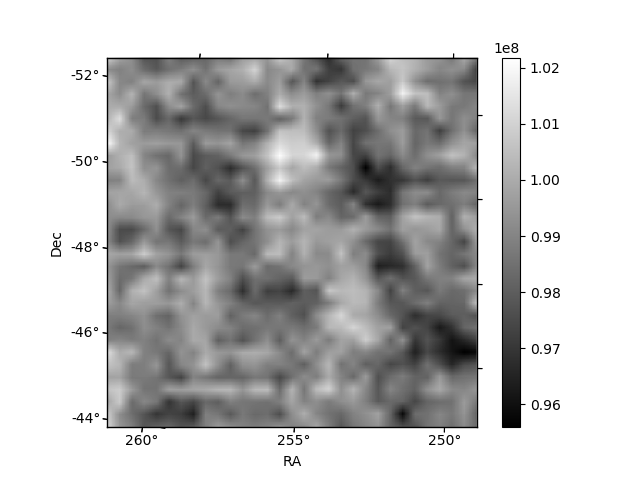
Quadrant B |
|---|---|---|---|
| Quadrant D | 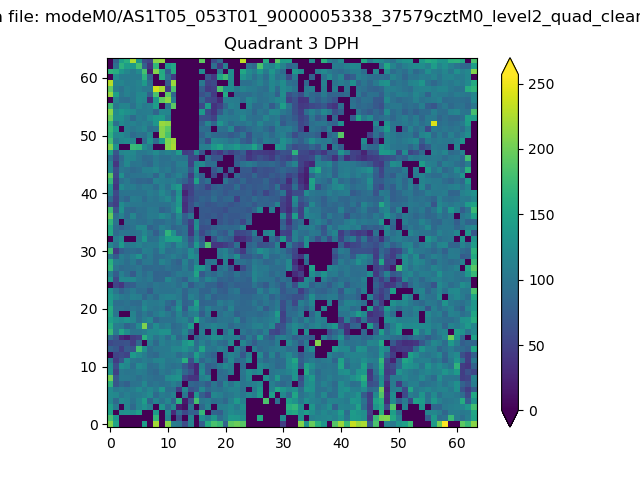 |
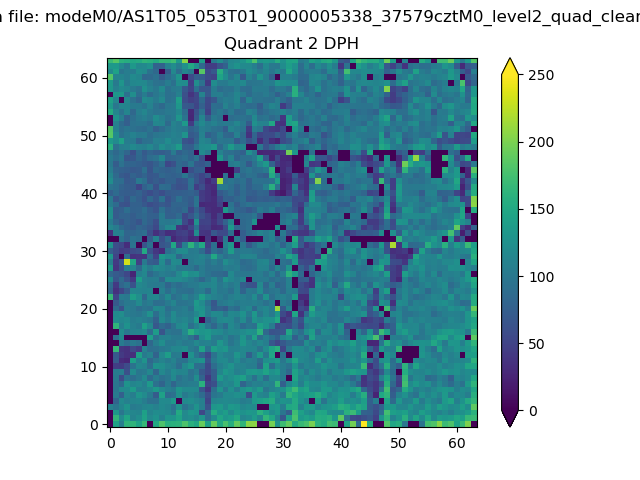 |
Quadrant C |
| Plot type | Count rate plots | Images |
|---|---|---|
| Comparison with Poisson distribution Blue bars denote a histogram of data divided into 1 sec bins. Red curve is a Poisson curve with rate = median count rate of data. |
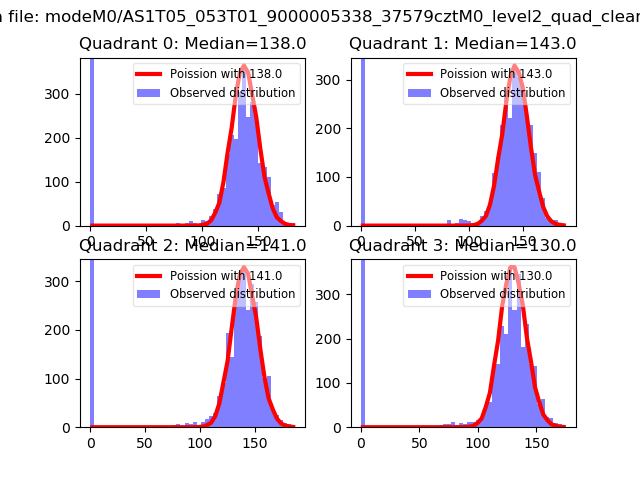 |
 |
| Quadrant-wise count rates Data is divided into 100 sec bins |
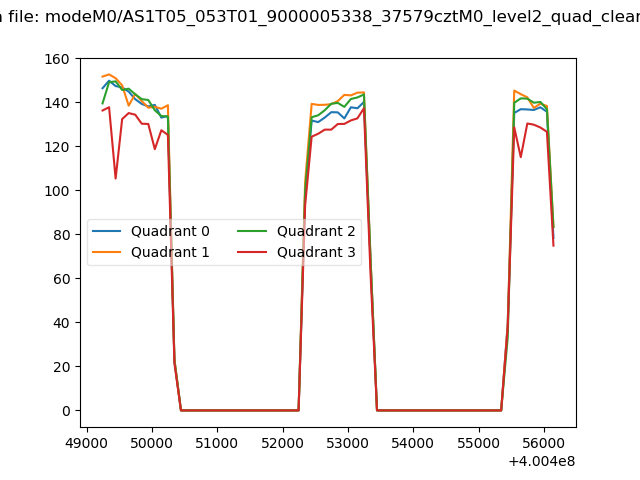 |
|
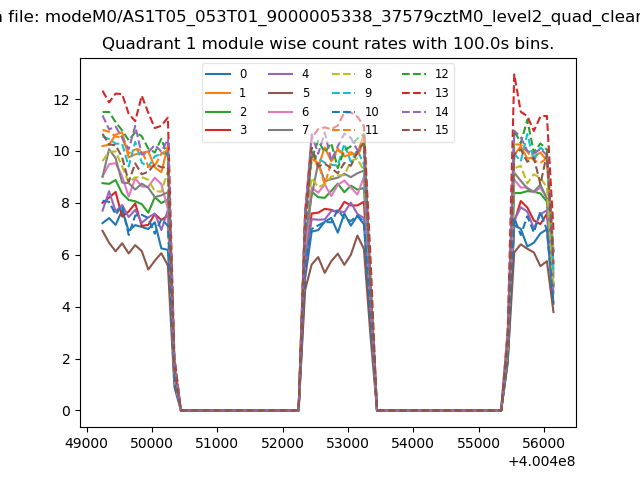
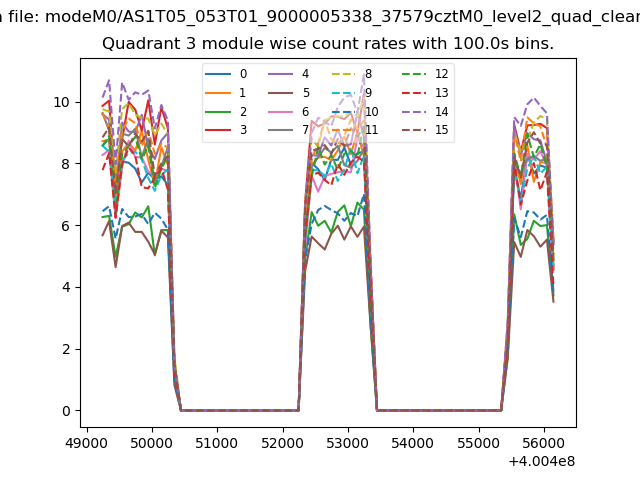
| Module-wise count rates for Quadrant A Data is divided into 100 sec bins |
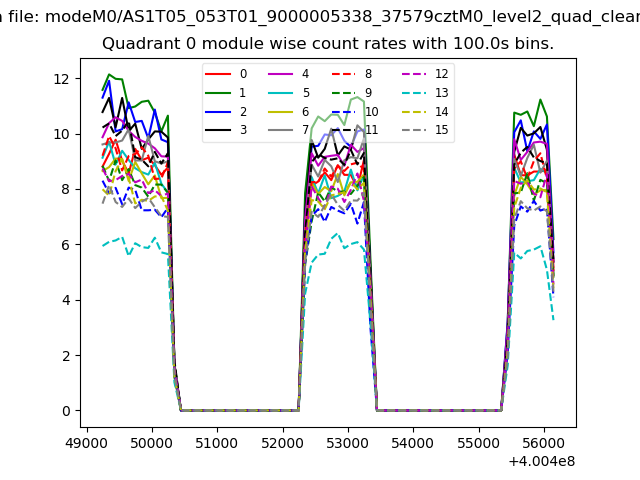 |
 |
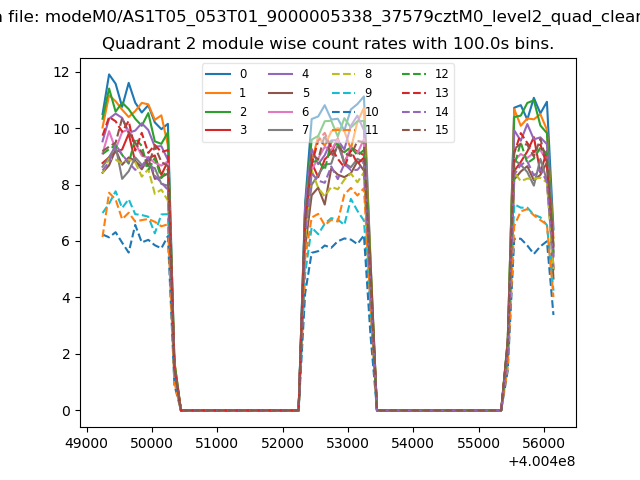
| Module-wise count rates for Quadrant B Data is divided into 100 sec bins |
 |
 |
| Module-wise count rates for Quadrant C Data is divided into 100 sec bins |
 |
 |
| Module-wise count rates for Quadrant D Data is divided into 100 sec bins |
 |
 |
| Parameter | Plot |
|---|---|
| CZT HV Monitor | 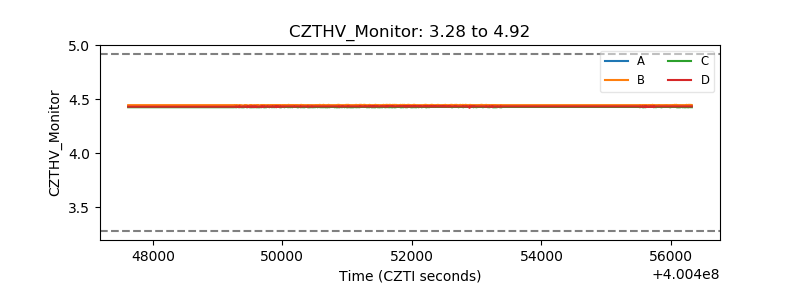 |
| D_VDD | 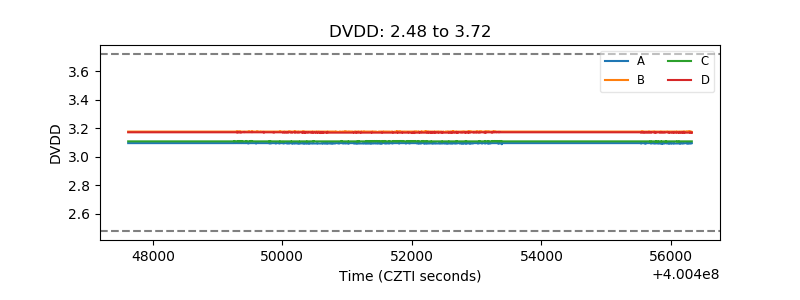 |
| Temperature 1 | 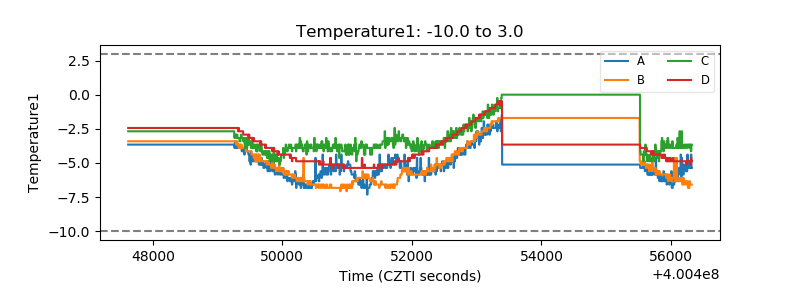 |
| Veto HV Monitor |  |
| Veto LLD | 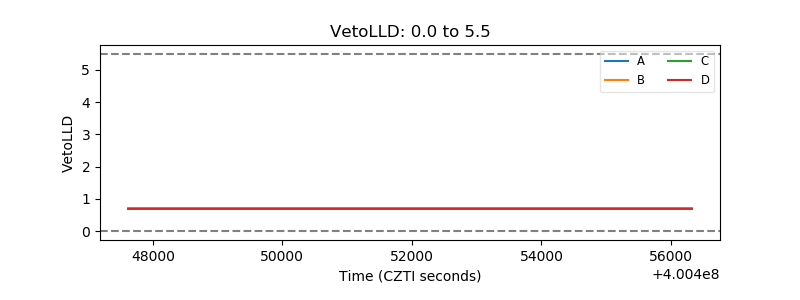 |
| Alpha Counter | 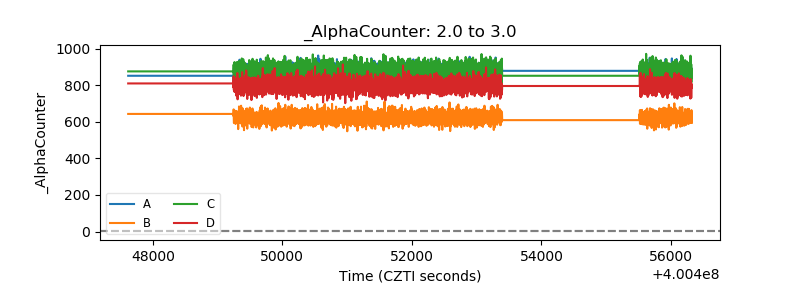 |
| _CPM_Rate | 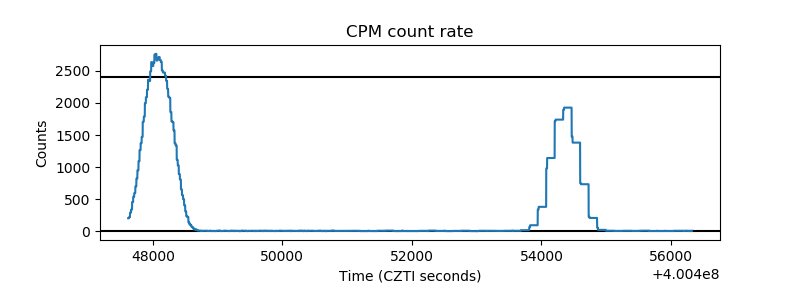 |
| CZT Counter | 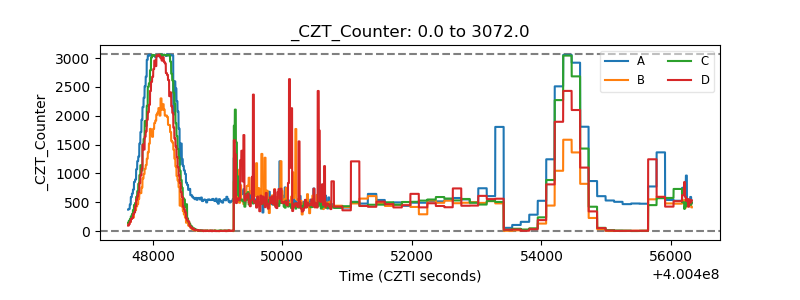 |
| +2.5 Volts monitor | 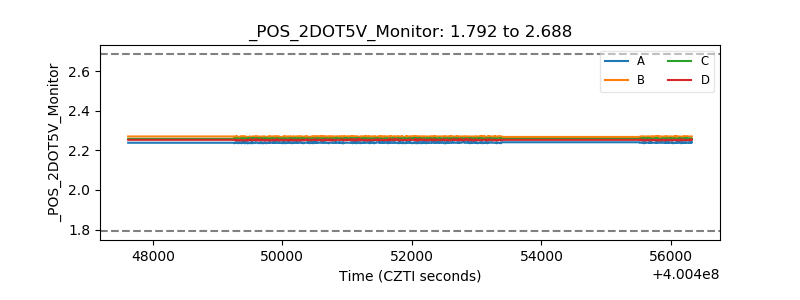 |
| +5 Volts monitor | 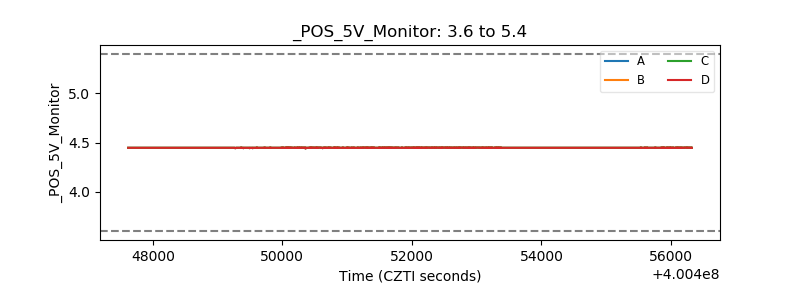 |
| _ROLL_ROT | 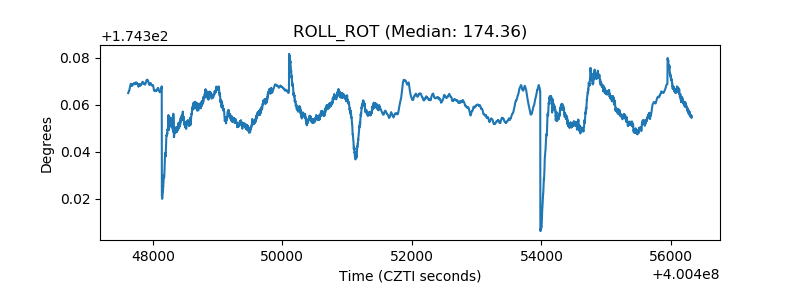 |
| _Roll_DEC | 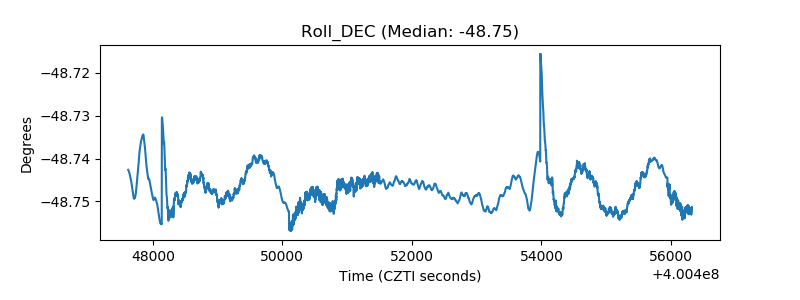 |
| _Roll_RA | 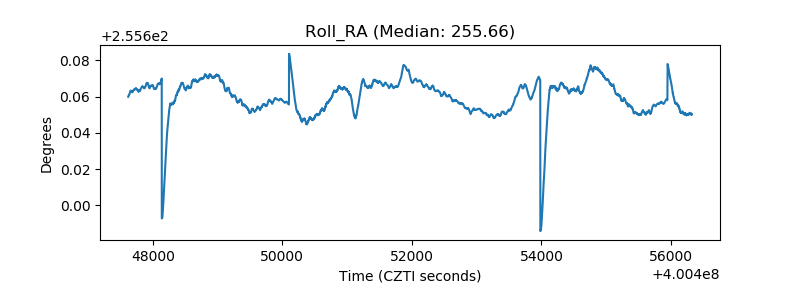 |
| Veto Counter | 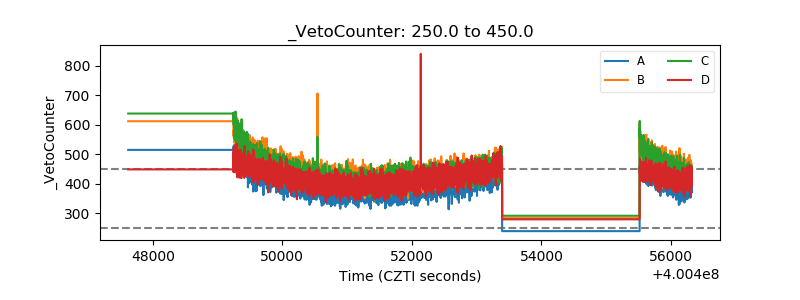 |