| Param | Original file | Final file |
|---|---|---|
| Filename | modeM0/AS1T05_053T01_9000005338_37580cztM0_level2.evt | modeM0/AS1T05_053T01_9000005338_37580cztM0_level2_quad_clean.evt |
| Size (bytes) | 380,750,400 | 53,720,640 |
| Size | 363.1 MB | 51.2 MB |
| Events in quadrant A | 3,019,387 | 319,088 |
| Events in quadrant B | 2,609,383 | 330,130 |
| Events in quadrant C | 2,545,090 | 327,862 |
| Events in quadrant D | 3,022,396 | 304,013 |
| Mode SS | |||
|---|---|---|---|
| Quadrant | BADHDUFLAG | Total packets | Discarded packets |
| A | 0 | 102 | 0 |
| B | 0 | 102 | 0 |
| C | 0 | 102 | 0 |
| D | 0 | 102 | 0 |
| Mode M0 | |||
|---|---|---|---|
| Quadrant | BADHDUFLAG | Total packets | Discarded packets |
| A | 0 | 12150 | 3 |
| B | 0 | 10777 | 2 |
| C | 0 | 10432 | 2 |
| D | 0 | 12363 | 2 |
| Mode M9 | |||
|---|---|---|---|
| Quadrant | BADHDUFLAG | Total packets | Discarded packets |
| A | 0 | 36 | 0 |
| B | 0 | 36 | 0 |
| C | 0 | 36 | 0 |
| D | 0 | 37 | 0 |
| Quadrant | Total seconds | Saturated seconds | Saturation percentage |
|---|---|---|---|
| A | 4916 | 34 | 0.691619% |
| B | 4916 | 32 | 0.650936% |
| C | 4916 | 29 | 0.589910% |
| D | 4916 | 140 | 2.847844% |
Noise dominated data is calculated using 1-second bins in cleaned event files. If a bin has >2000 counts, and if more than 50% of those come from <1% of pixels, then it is considered to be noise-dominated and hence unusable.
| Quadrant | # 1 sec bins | Bins with >0 counts | Bins with >2000 counts | High rate bins dominated by noise | Noise dominated (total time) | Noise dominated (detector-on time) | Marked lightcurve |
|---|---|---|---|---|---|---|---|
| A | 7039 | 4917 | 26 | 26 | 0.37% | 0.53% | 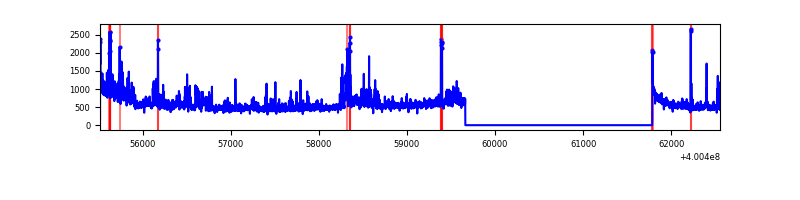 |
| B | 7039 | 4917 | 22 | 22 | 0.31% | 0.45% | 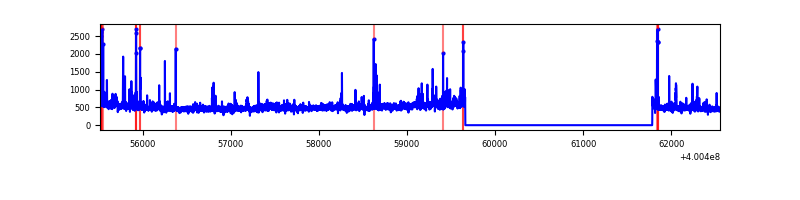 |
| C | 7039 | 4917 | 33 | 33 | 0.47% | 0.67% | 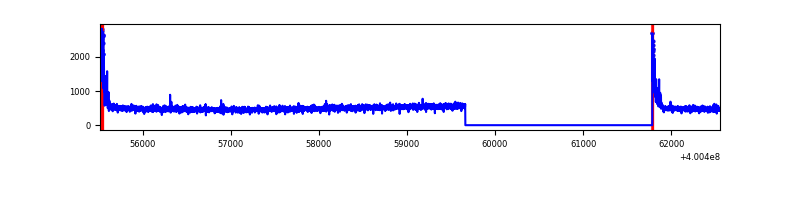 |
| D | 7039 | 4917 | 155 | 155 | 2.20% | 3.15% | 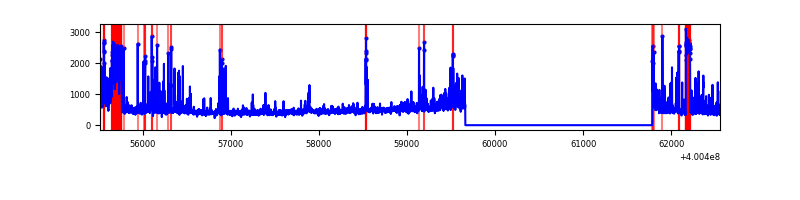 |
Top three noisy pixels from each quadrant. If the there are fewer than three noisy pixels in the level2.evt file, extra rows are filled as -1
| Pixel properties | Quadrant properties | ||||||
|---|---|---|---|---|---|---|---|
| Quadrant | DetID | PixID | Counts | Sigma | Mean | Median | Sigma |
| A | 15 | 222 | 384723 | 3316.95 | 568 | 557 | 115.8 |
| A | 10 | 83 | 282981 | 2438.5 | 568 | 557 | 115.8 |
| A | 13 | 248 | 56506 | 483.07 | 568 | 557 | 115.8 |
| B | 5 | 172 | 78333 | 714.16 | 571 | 558 | 108.9 |
| B | 0 | 245 | 58537 | 532.39 | 571 | 558 | 108.9 |
| B | 4 | 81 | 55395 | 503.54 | 571 | 558 | 108.9 |
| C | 15 | 214 | 211385 | 1618.42 | 556 | 560 | 130.3 |
| C | 0 | 10 | 158454 | 1212.09 | 556 | 560 | 130.3 |
| C | 13 | 61 | 3827 | 25.08 | 556 | 560 | 130.3 |
| D | 2 | 153 | 226137 | 1696.85 | 543 | 526 | 133.0 |
| D | 2 | 249 | 171340 | 1284.72 | 543 | 526 | 133.0 |
| D | 13 | 249 | 138946 | 1041.08 | 543 | 526 | 133.0 |
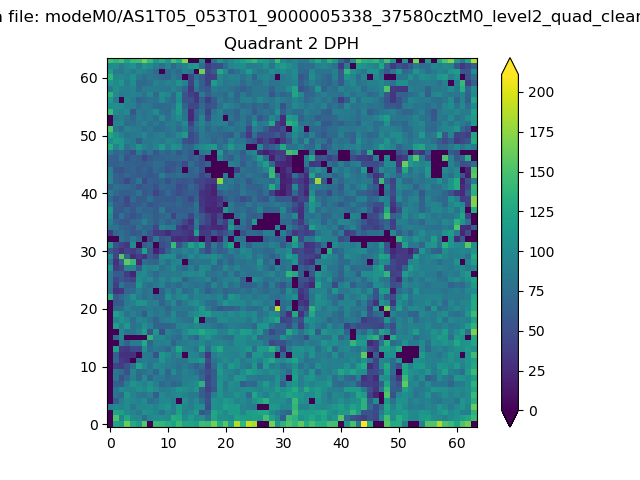
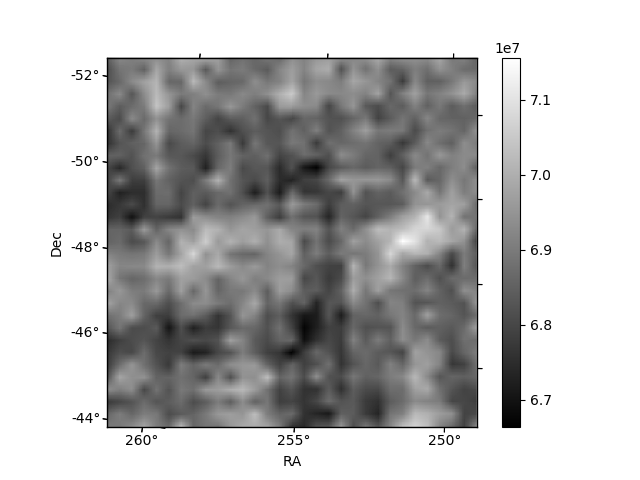
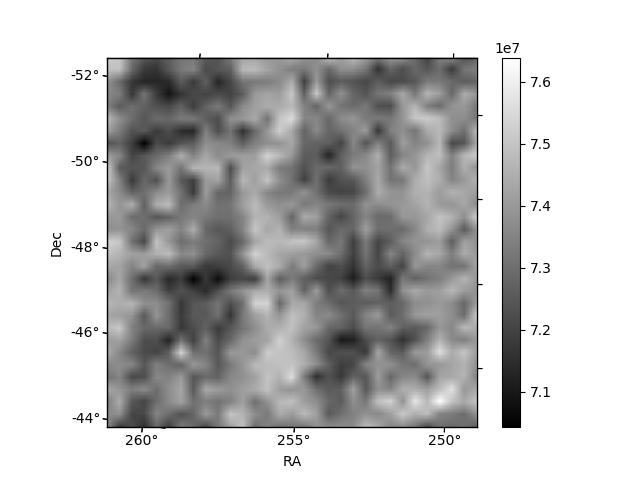
Histogram calculated using DETX and DETY for each event in the final _common_clean file
| Quadrant A | 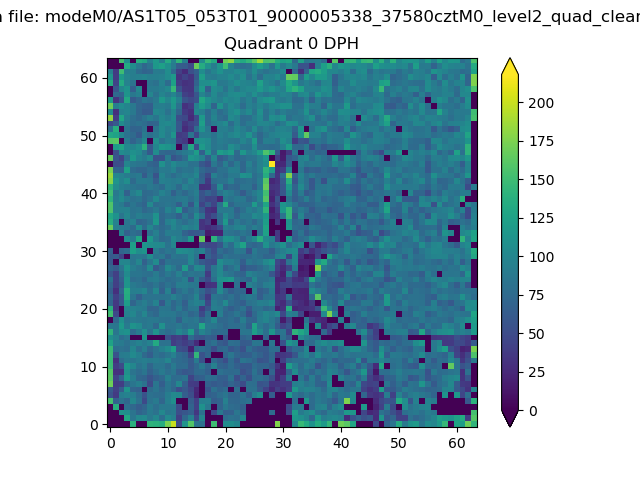 |
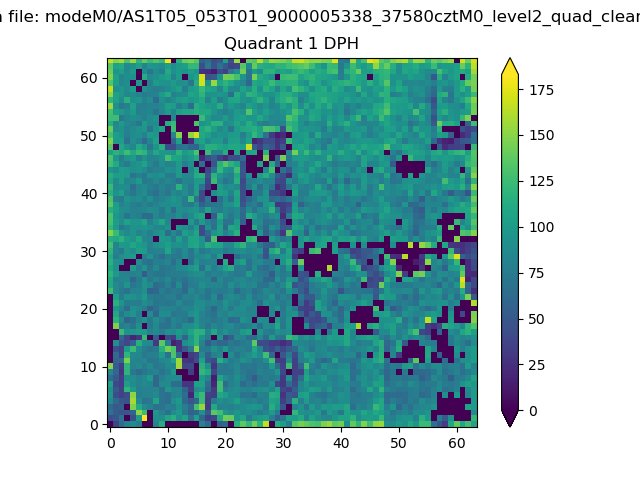 |
Quadrant B |
|---|---|---|---|
| Quadrant D | 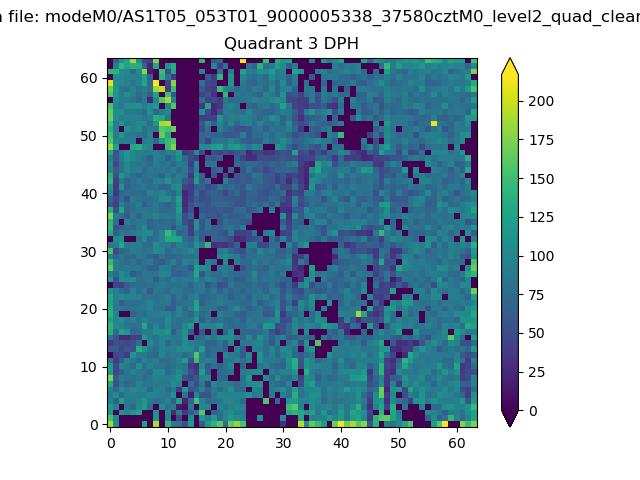 |
 |
Quadrant C |
| Plot type | Count rate plots | Images |
|---|---|---|
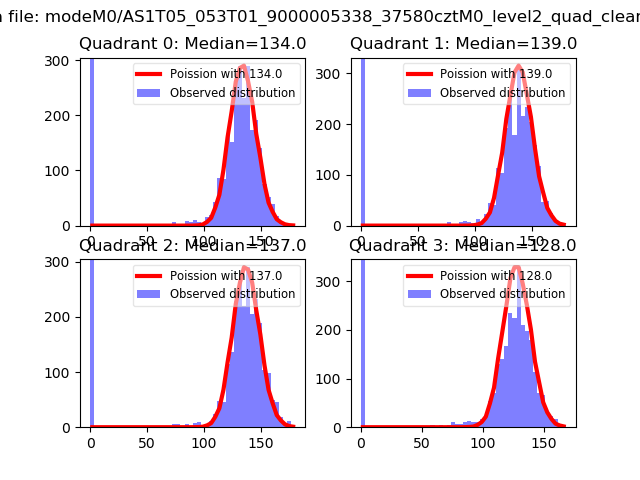
| Comparison with Poisson distribution Blue bars denote a histogram of data divided into 1 sec bins. Red curve is a Poisson curve with rate = median count rate of data. |
 |
 |
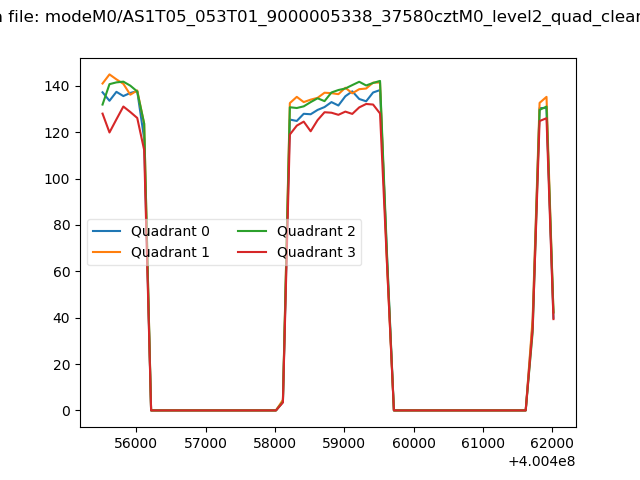
| Quadrant-wise count rates Data is divided into 100 sec bins |
 |
|
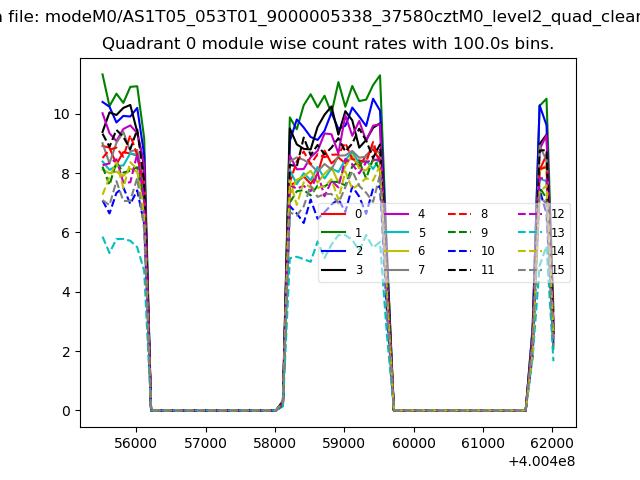
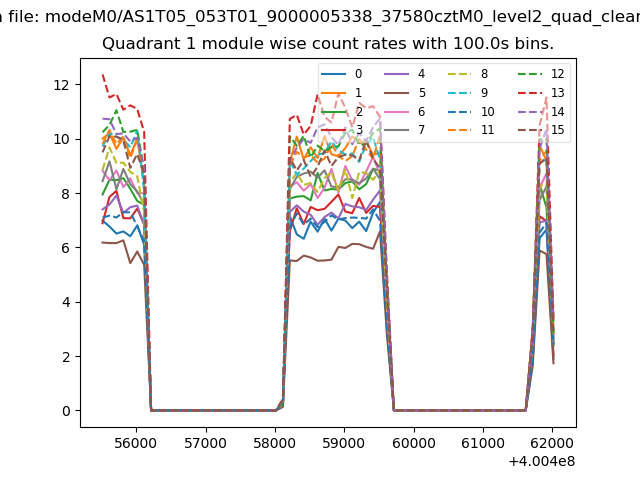
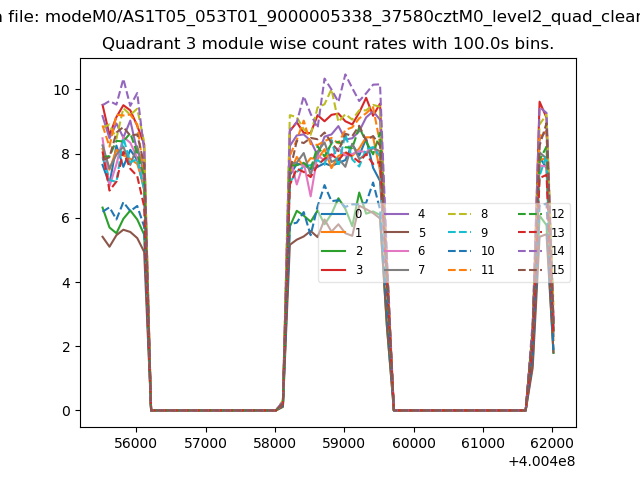
| Module-wise count rates for Quadrant A Data is divided into 100 sec bins |
 |
 |
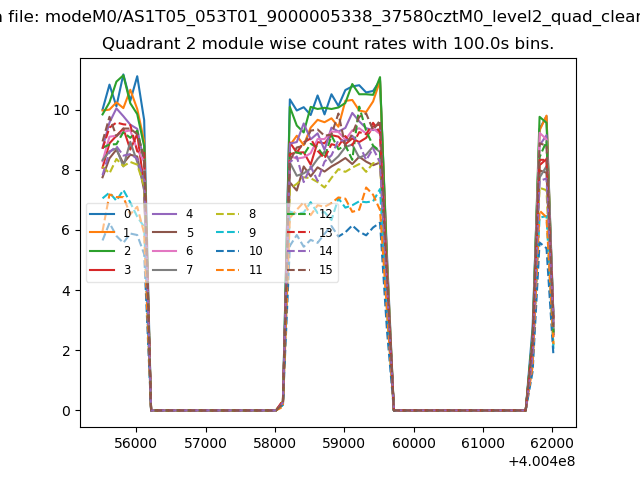
| Module-wise count rates for Quadrant B Data is divided into 100 sec bins |
 |
 |
| Module-wise count rates for Quadrant C Data is divided into 100 sec bins |
 |
 |
| Module-wise count rates for Quadrant D Data is divided into 100 sec bins |
 |
 |
| Parameter | Plot |
|---|---|
| CZT HV Monitor |  |
| D_VDD | 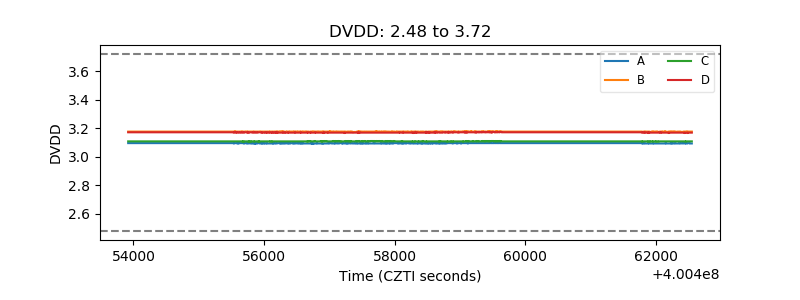 |
| Temperature 1 | 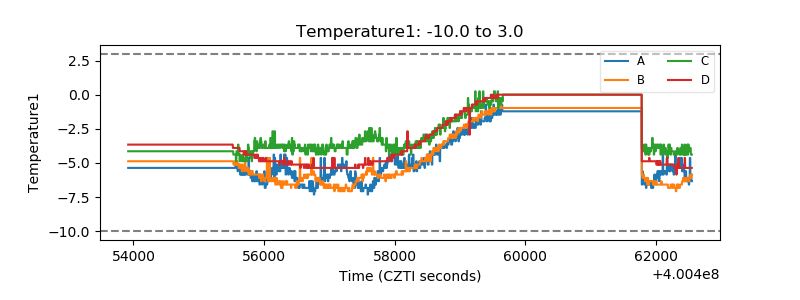 |
| Veto HV Monitor | 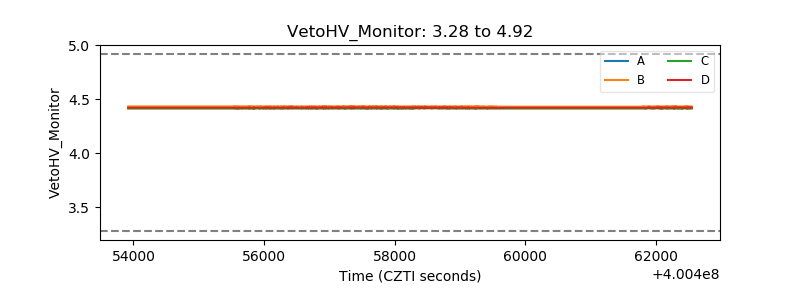 |
| Veto LLD | 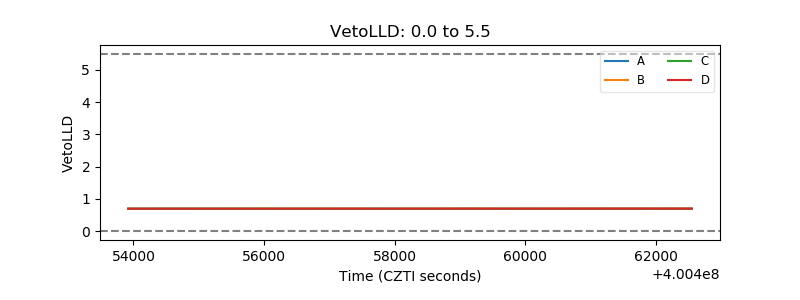 |
| Alpha Counter | 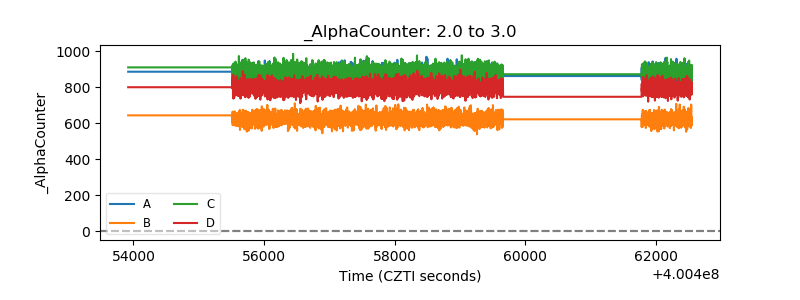 |
| _CPM_Rate | 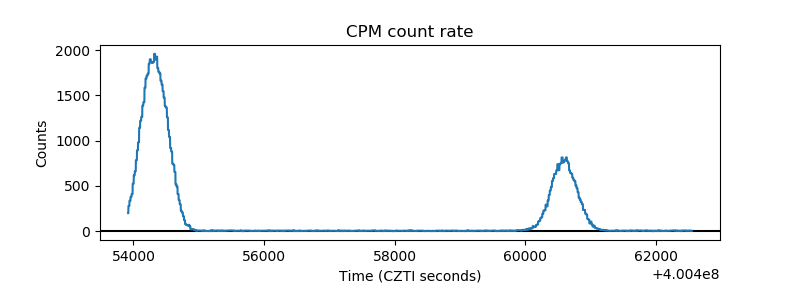 |
| CZT Counter | 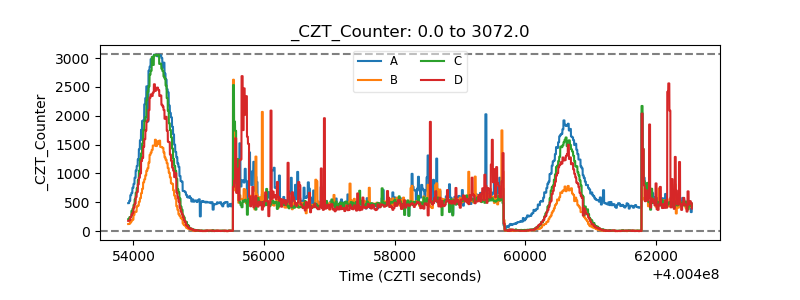 |
| +2.5 Volts monitor | 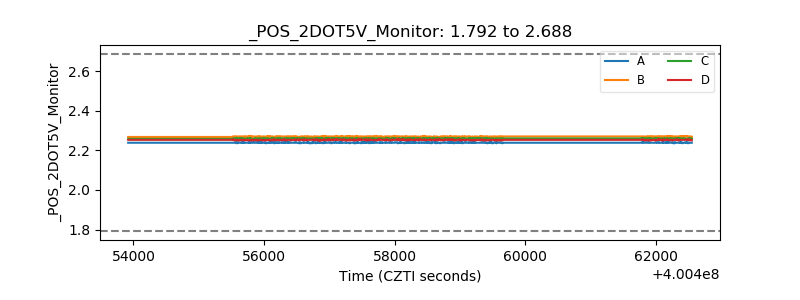 |
| +5 Volts monitor | 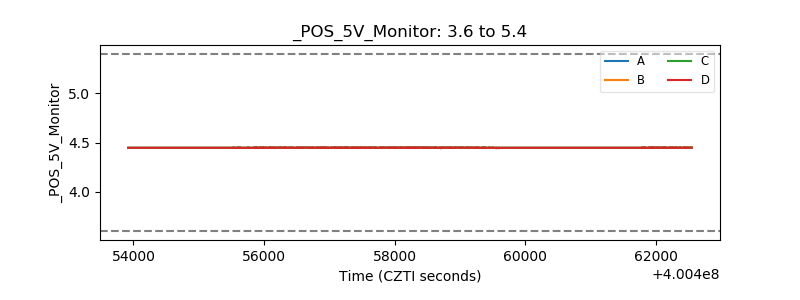 |
| _ROLL_ROT | 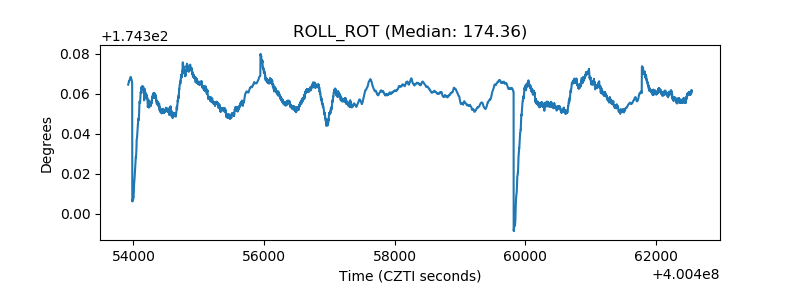 |
| _Roll_DEC | 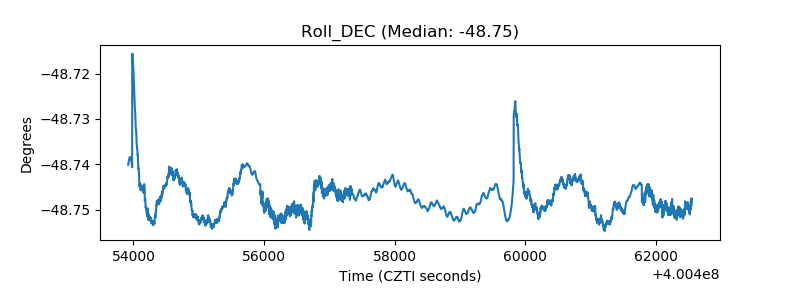 |
| _Roll_RA | 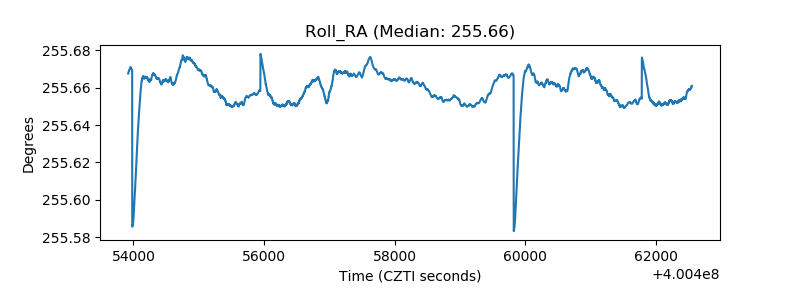 |
| Veto Counter | 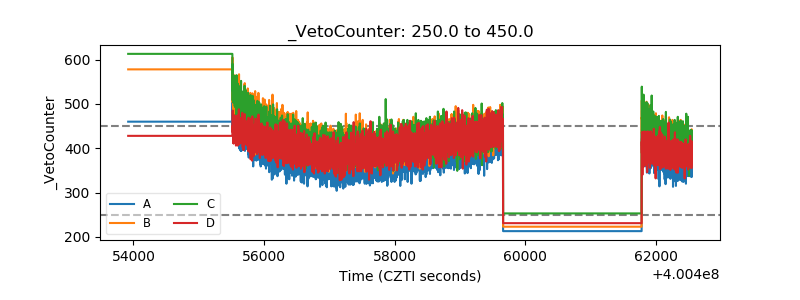 |