| Param | Original file | Final file |
|---|---|---|
| Filename | modeM0/AS1T05_053T01_9000005338_37581cztM0_level2.evt | modeM0/AS1T05_053T01_9000005338_37581cztM0_level2_quad_clean.evt |
| Size (bytes) | 371,465,280 | 50,008,320 |
| Size | 354.3 MB | 47.7 MB |
| Events in quadrant A | 2,688,637 | 292,184 |
| Events in quadrant B | 2,518,809 | 298,443 |
| Events in quadrant C | 2,494,679 | 297,569 |
| Events in quadrant D | 3,209,238 | 276,905 |
| Mode SS | |||
|---|---|---|---|
| Quadrant | BADHDUFLAG | Total packets | Discarded packets |
| A | 0 | 102 | 0 |
| B | 0 | 102 | 0 |
| C | 0 | 102 | 0 |
| D | 0 | 102 | 0 |
| Mode M0 | |||
|---|---|---|---|
| Quadrant | BADHDUFLAG | Total packets | Discarded packets |
| A | 0 | 11054 | 3 |
| B | 0 | 10622 | 2 |
| C | 0 | 10355 | 2 |
| D | 0 | 13070 | 2 |
| Mode M9 | |||
|---|---|---|---|
| Quadrant | BADHDUFLAG | Total packets | Discarded packets |
| A | 0 | 34 | 0 |
| B | 0 | 34 | 0 |
| C | 0 | 34 | 0 |
| D | 0 | 35 | 0 |
| Quadrant | Total seconds | Saturated seconds | Saturation percentage |
|---|---|---|---|
| A | 4971 | 18 | 0.362100% |
| B | 4971 | 20 | 0.402334% |
| C | 4971 | 21 | 0.422450% |
| D | 4971 | 210 | 4.224502% |
Noise dominated data is calculated using 1-second bins in cleaned event files. If a bin has >2000 counts, and if more than 50% of those come from <1% of pixels, then it is considered to be noise-dominated and hence unusable.
| Quadrant | # 1 sec bins | Bins with >0 counts | Bins with >2000 counts | High rate bins dominated by noise | Noise dominated (total time) | Noise dominated (detector-on time) | Marked lightcurve |
|---|---|---|---|---|---|---|---|
| A | 6974 | 4972 | 18 | 18 | 0.26% | 0.36% | 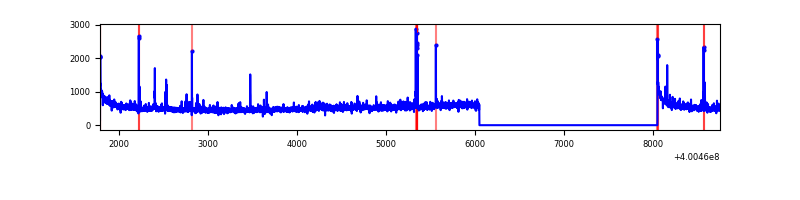 |
| B | 6974 | 4972 | 10 | 10 | 0.14% | 0.20% | 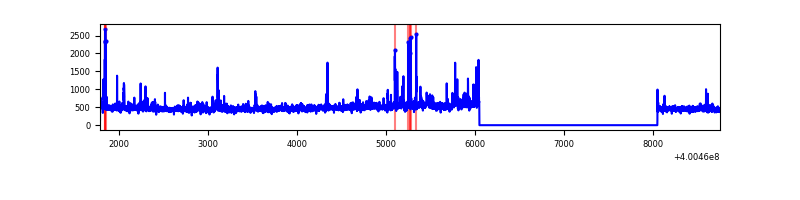 |
| C | 6974 | 4972 | 19 | 19 | 0.27% | 0.38% | 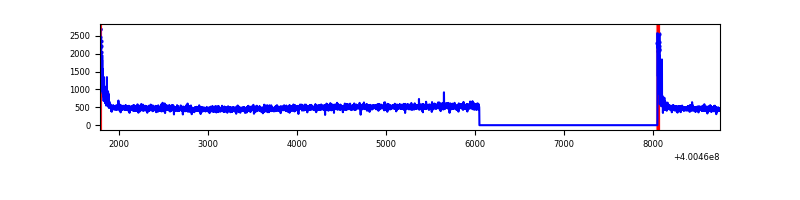 |
| D | 6974 | 4972 | 208 | 208 | 2.98% | 4.18% | 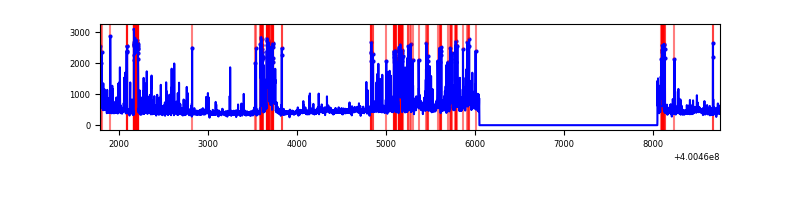 |
Top three noisy pixels from each quadrant. If the there are fewer than three noisy pixels in the level2.evt file, extra rows are filled as -1
| Pixel properties | Quadrant properties | ||||||
|---|---|---|---|---|---|---|---|
| Quadrant | DetID | PixID | Counts | Sigma | Mean | Median | Sigma |
| A | 10 | 83 | 290090 | 2537.02 | 565 | 552 | 114.1 |
| A | 15 | 222 | 116337 | 1014.55 | 565 | 552 | 114.1 |
| A | 9 | 143 | 33680 | 290.28 | 565 | 552 | 114.1 |
| B | 5 | 172 | 47260 | 434.47 | 567 | 553 | 107.5 |
| B | 0 | 189 | 39756 | 364.67 | 567 | 553 | 107.5 |
| B | 0 | 213 | 35191 | 322.2 | 567 | 553 | 107.5 |
| C | 15 | 214 | 216998 | 1671.26 | 553 | 556 | 129.5 |
| C | 0 | 10 | 113884 | 875.07 | 553 | 556 | 129.5 |
| C | 14 | 254 | 4765 | 32.5 | 553 | 556 | 129.5 |
| D | 2 | 249 | 454679 | 3438.9 | 539 | 523 | 132.1 |
| D | 1 | 47 | 306073 | 2313.64 | 539 | 523 | 132.1 |
| D | 2 | 250 | 82154 | 618.11 | 539 | 523 | 132.1 |
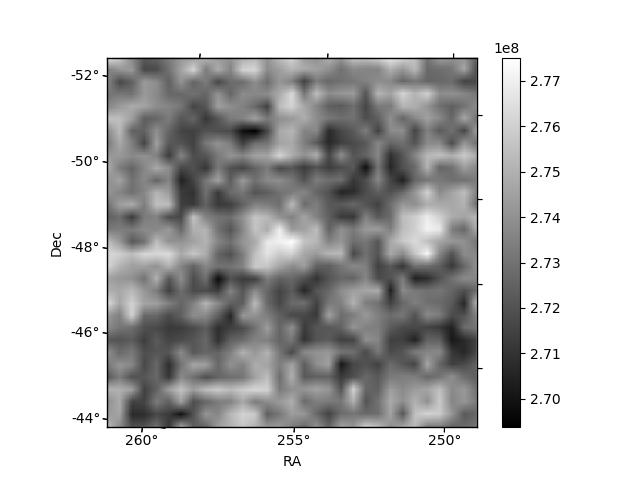
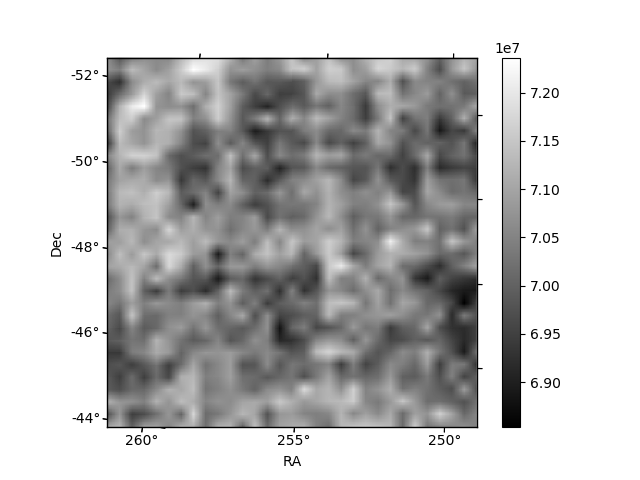
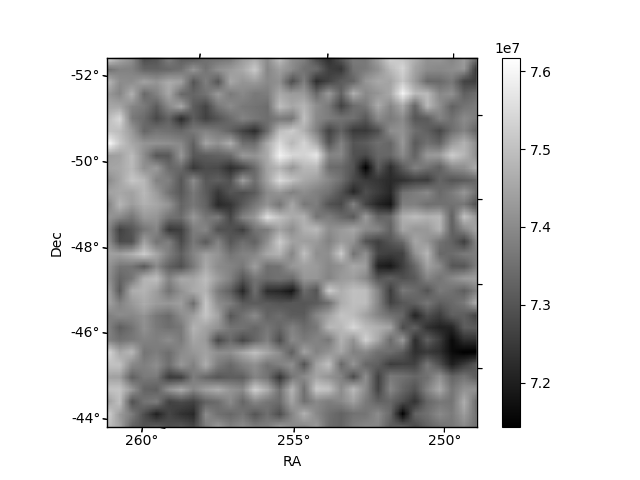
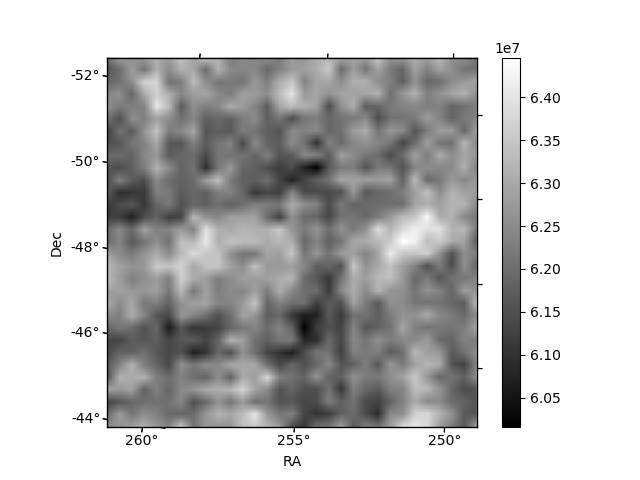
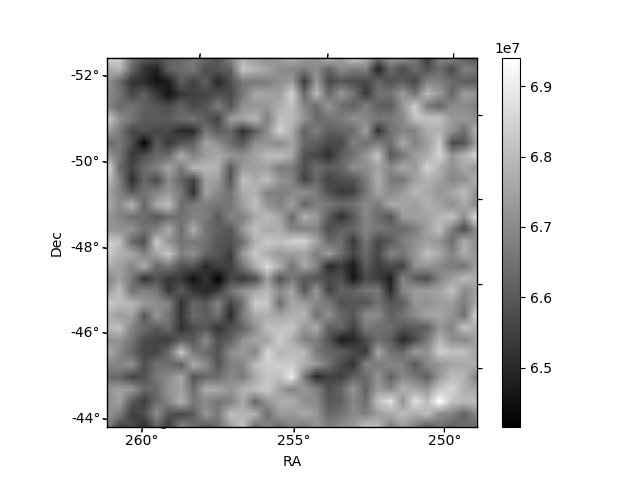
Histogram calculated using DETX and DETY for each event in the final _common_clean file
| Quadrant A | 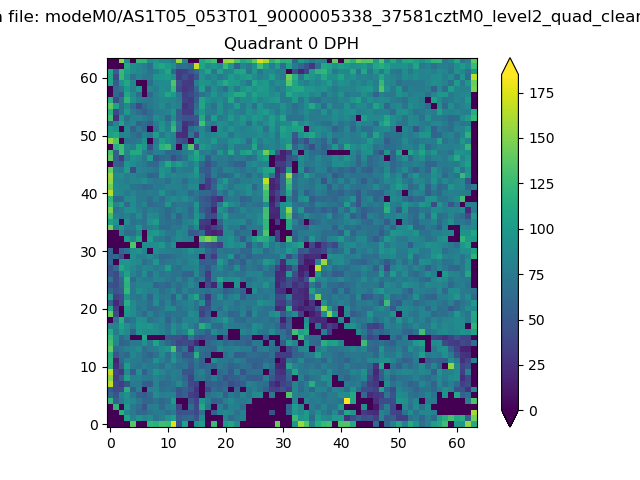 |
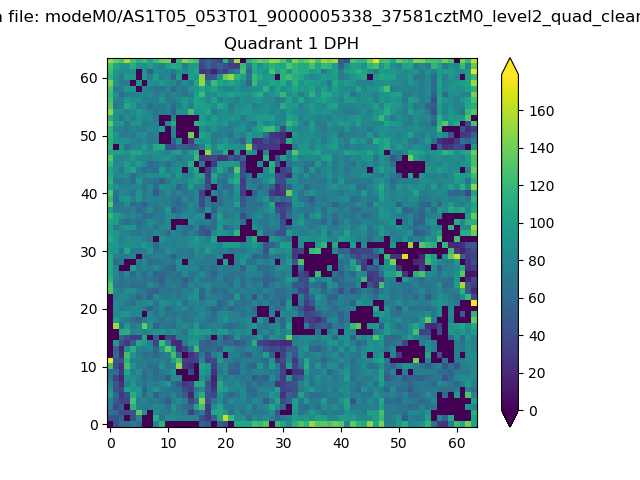 |
Quadrant B |
|---|---|---|---|
| Quadrant D | 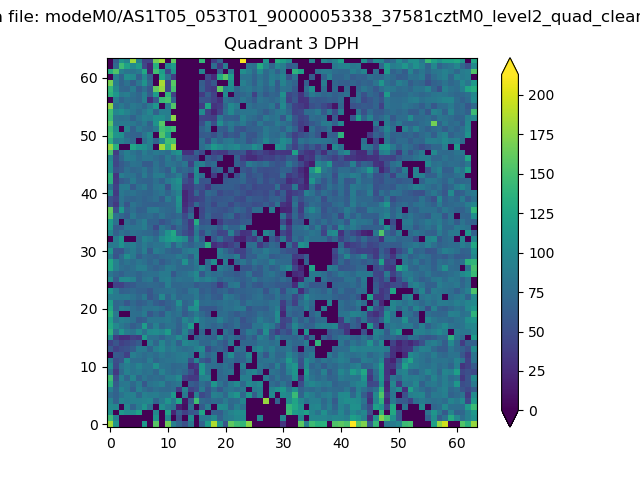 |
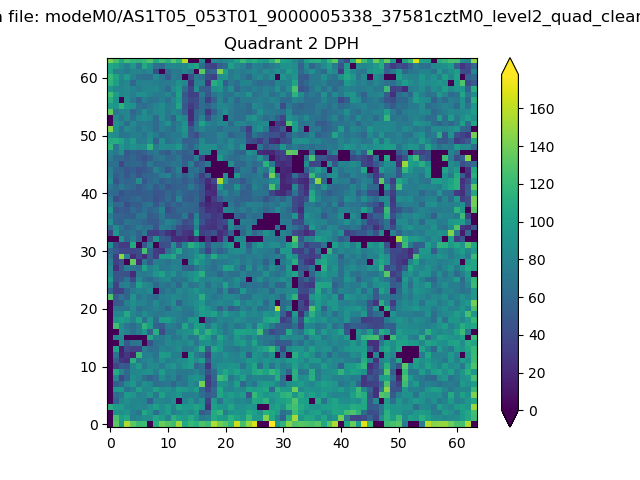 |
Quadrant C |
| Plot type | Count rate plots | Images |
|---|---|---|
| Comparison with Poisson distribution Blue bars denote a histogram of data divided into 1 sec bins. Red curve is a Poisson curve with rate = median count rate of data. |
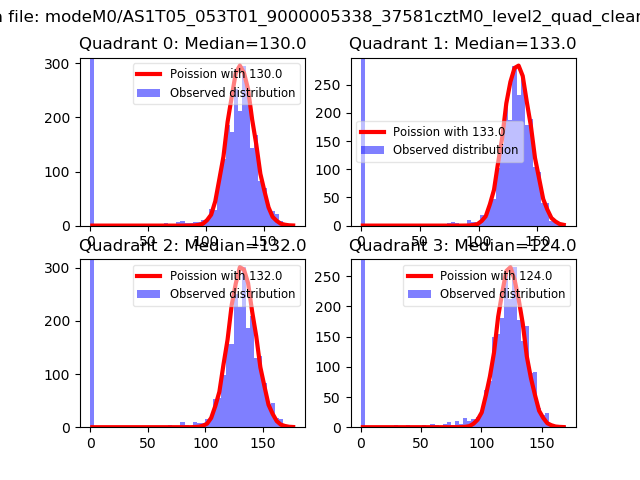 |
 |
| Quadrant-wise count rates Data is divided into 100 sec bins |
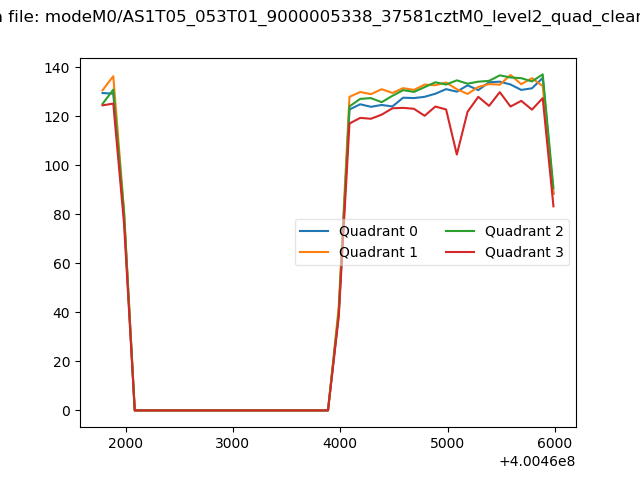 |
|
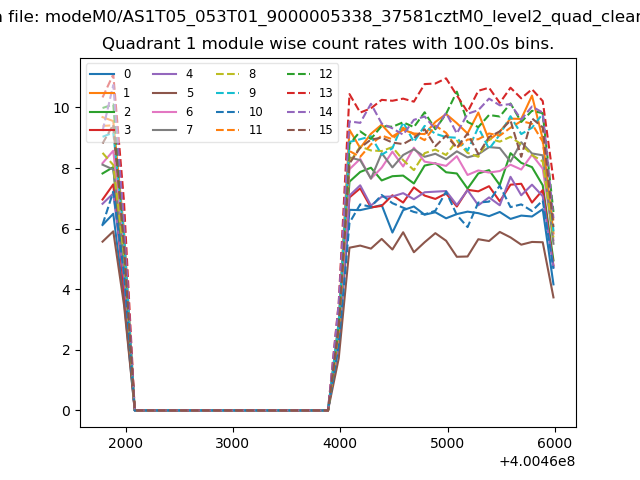
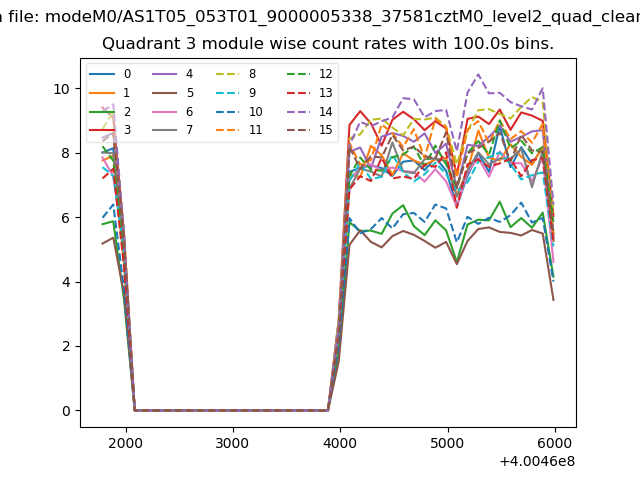
| Module-wise count rates for Quadrant A Data is divided into 100 sec bins |
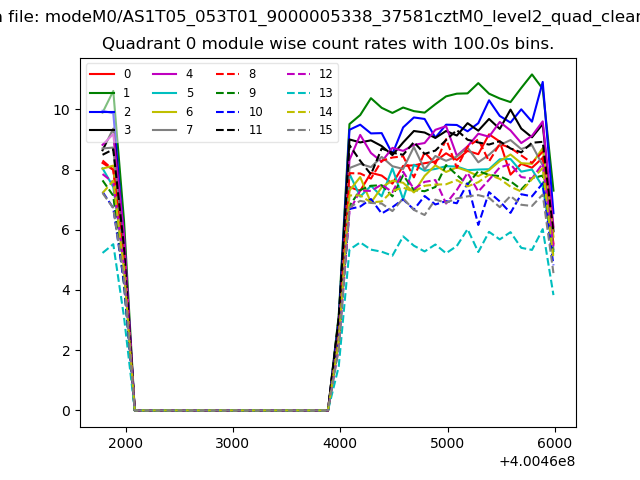 |
 |
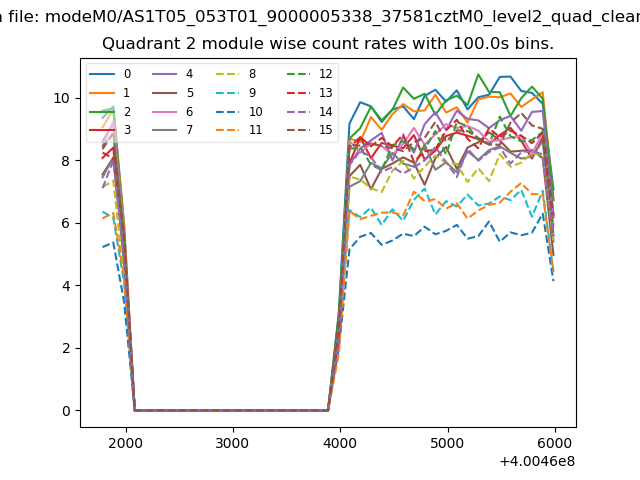
| Module-wise count rates for Quadrant B Data is divided into 100 sec bins |
 |
 |
| Module-wise count rates for Quadrant C Data is divided into 100 sec bins |
 |
 |
| Module-wise count rates for Quadrant D Data is divided into 100 sec bins |
 |
 |
| Parameter | Plot |
|---|---|
| CZT HV Monitor | 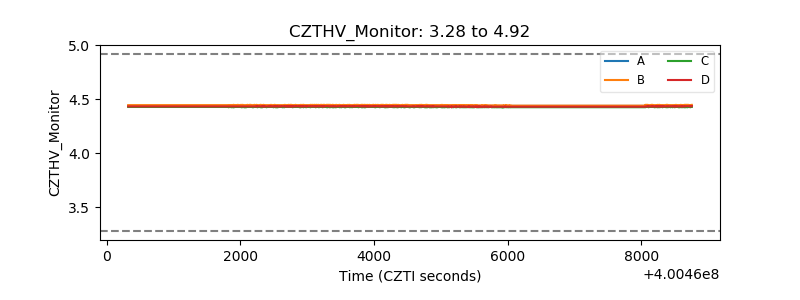 |
| D_VDD | 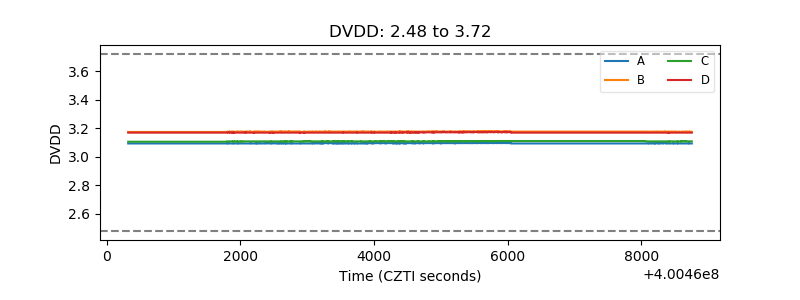 |
| Temperature 1 | 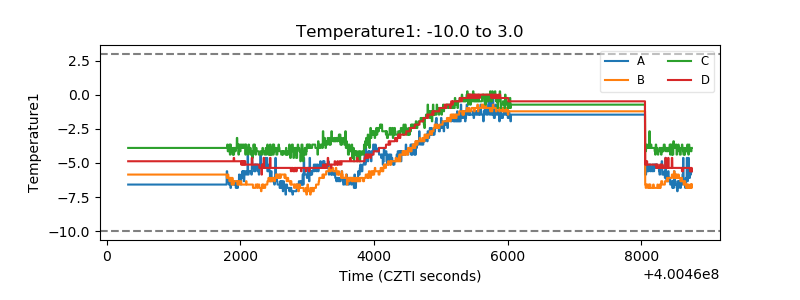 |
| Veto HV Monitor | 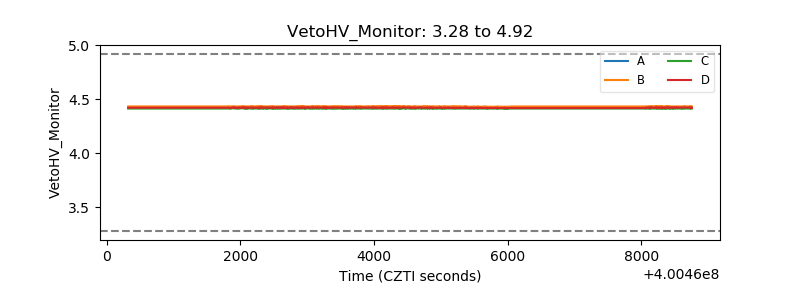 |
| Veto LLD | 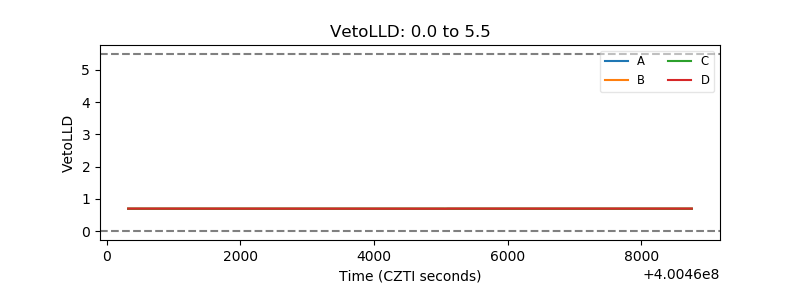 |
| Alpha Counter | 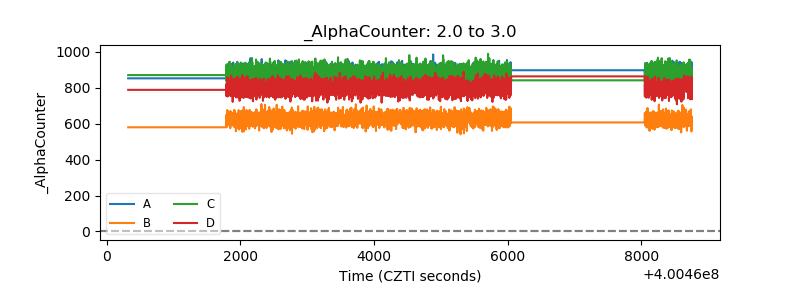 |
| _CPM_Rate | 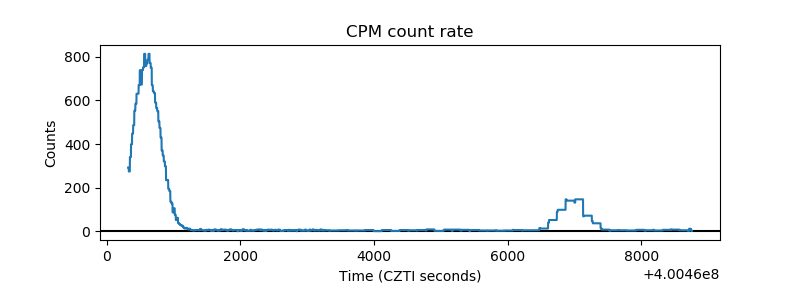 |
| CZT Counter | 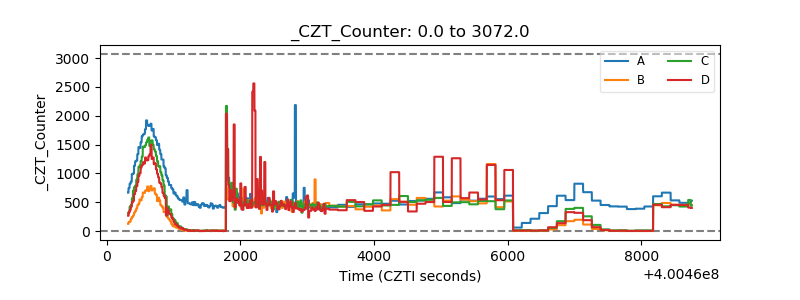 |
| +2.5 Volts monitor | 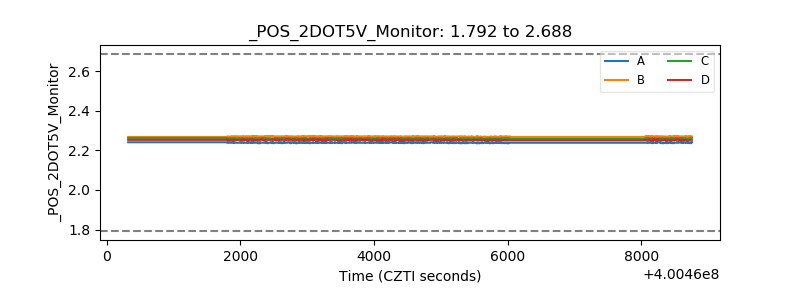 |
| +5 Volts monitor | 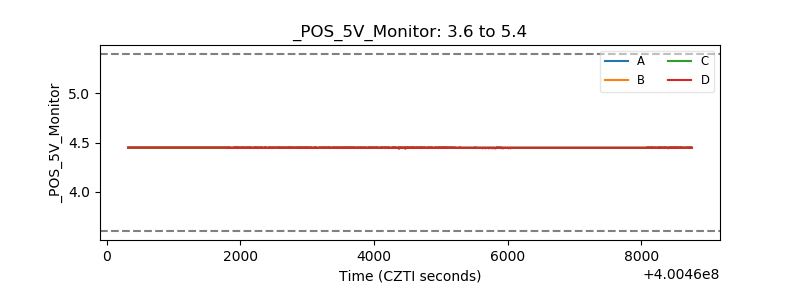 |
| _ROLL_ROT | 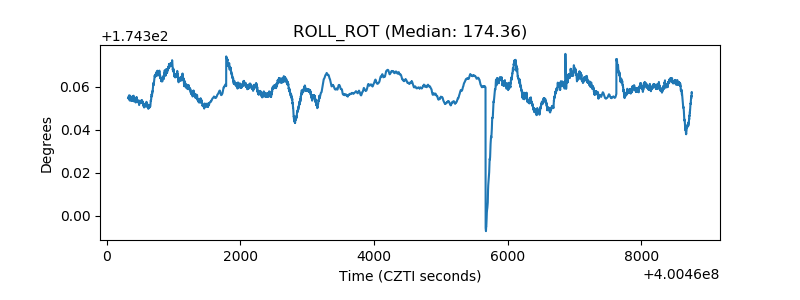 |
| _Roll_DEC | 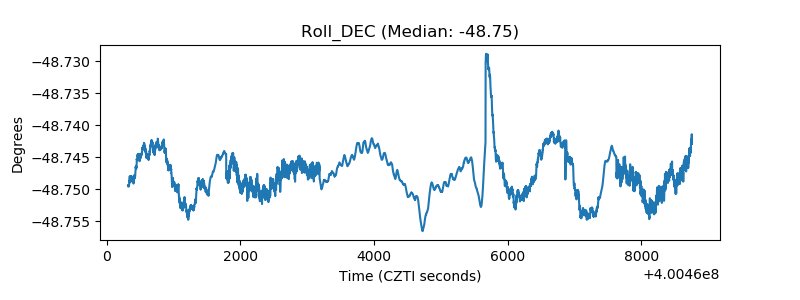 |
| _Roll_RA | 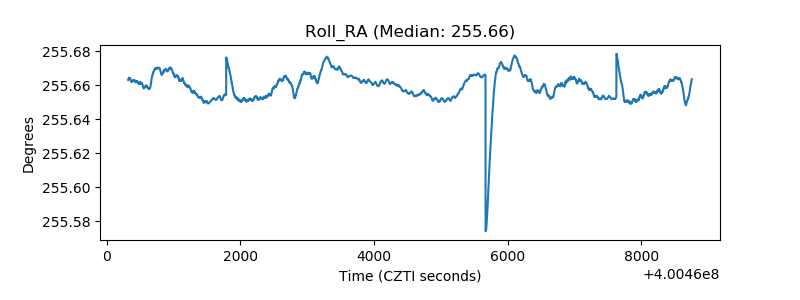 |
| Veto Counter | 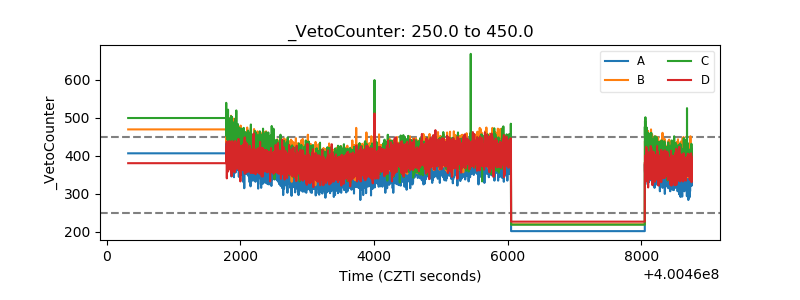 |