| Param | Original file | Final file |
|---|---|---|
| Filename | modeM0/AS1T05_053T01_9000005338_37582cztM0_level2.evt | modeM0/AS1T05_053T01_9000005338_37582cztM0_level2_quad_clean.evt |
| Size (bytes) | 410,941,440 | 57,893,760 |
| Size | 391.9 MB | 55.2 MB |
| Events in quadrant A | 2,846,481 | 343,783 |
| Events in quadrant B | 2,698,735 | 348,507 |
| Events in quadrant C | 2,713,963 | 349,372 |
| Events in quadrant D | 3,816,095 | 330,076 |
| Mode SS | |||
|---|---|---|---|
| Quadrant | BADHDUFLAG | Total packets | Discarded packets |
| A | 0 | 110 | 0 |
| B | 0 | 110 | 0 |
| C | 0 | 110 | 0 |
| D | 0 | 110 | 0 |
| Mode M0 | |||
|---|---|---|---|
| Quadrant | BADHDUFLAG | Total packets | Discarded packets |
| A | 0 | 11641 | 3 |
| B | 0 | 11505 | 2 |
| C | 0 | 11342 | 2 |
| D | 0 | 15157 | 2 |
| Mode M9 | |||
|---|---|---|---|
| Quadrant | BADHDUFLAG | Total packets | Discarded packets |
| A | 0 | 31 | 0 |
| B | 0 | 31 | 0 |
| C | 0 | 31 | 0 |
| D | 0 | 32 | 0 |
| Quadrant | Total seconds | Saturated seconds | Saturation percentage |
|---|---|---|---|
| A | 5443 | 14 | 0.257211% |
| B | 5443 | 39 | 0.716517% |
| C | 5443 | 27 | 0.496050% |
| D | 5443 | 386 | 7.091677% |
Noise dominated data is calculated using 1-second bins in cleaned event files. If a bin has >2000 counts, and if more than 50% of those come from <1% of pixels, then it is considered to be noise-dominated and hence unusable.
| Quadrant | # 1 sec bins | Bins with >0 counts | Bins with >2000 counts | High rate bins dominated by noise | Noise dominated (total time) | Noise dominated (detector-on time) | Marked lightcurve |
|---|---|---|---|---|---|---|---|
| A | 7145 | 5444 | 7 | 7 | 0.10% | 0.13% | 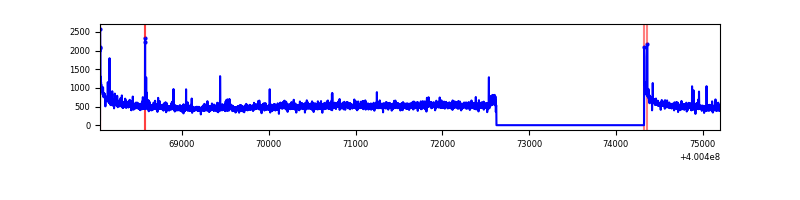 |
| B | 7145 | 5444 | 16 | 16 | 0.22% | 0.29% | 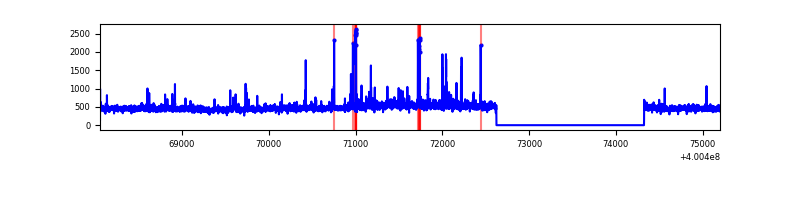 |
| C | 7145 | 5444 | 25 | 25 | 0.35% | 0.46% | 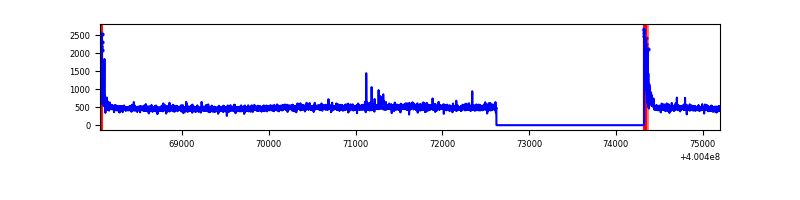 |
| D | 7145 | 5444 | 410 | 410 | 5.74% | 7.53% | 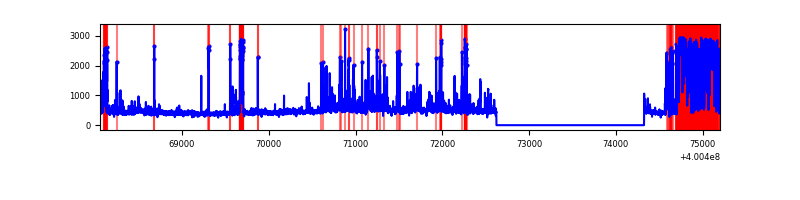 |
Top three noisy pixels from each quadrant. If the there are fewer than three noisy pixels in the level2.evt file, extra rows are filled as -1
| Pixel properties | Quadrant properties | ||||||
|---|---|---|---|---|---|---|---|
| Quadrant | DetID | PixID | Counts | Sigma | Mean | Median | Sigma |
| A | 10 | 83 | 317295 | 2538.46 | 613 | 599 | 124.8 |
| A | 15 | 222 | 91844 | 731.37 | 613 | 599 | 124.8 |
| A | 12 | 189 | 22759 | 177.62 | 613 | 599 | 124.8 |
| B | 0 | 230 | 44898 | 381.1 | 611 | 595 | 116.2 |
| B | 4 | 81 | 43981 | 373.22 | 611 | 595 | 116.2 |
| B | 0 | 213 | 37565 | 318.02 | 611 | 595 | 116.2 |
| C | 15 | 214 | 238543 | 1714.92 | 598 | 603 | 138.7 |
| C | 0 | 10 | 119373 | 856.02 | 598 | 603 | 138.7 |
| C | 14 | 254 | 11889 | 81.34 | 598 | 603 | 138.7 |
| D | 10 | 253 | 1093462 | 7593.85 | 580 | 561 | 143.9 |
| D | 2 | 249 | 219269 | 1519.66 | 580 | 561 | 143.9 |
| D | 1 | 47 | 84454 | 582.91 | 580 | 561 | 143.9 |
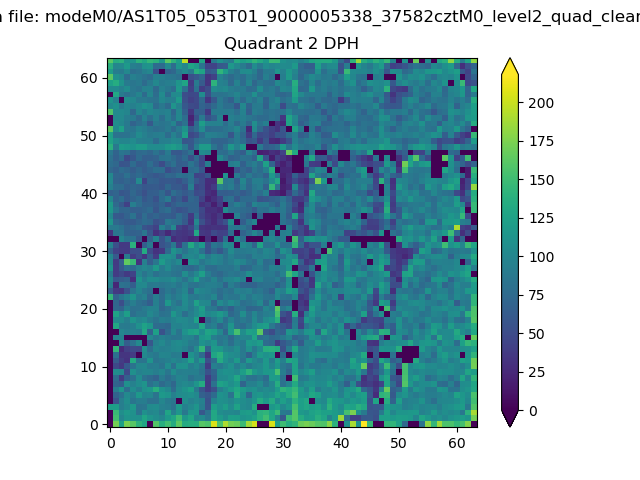
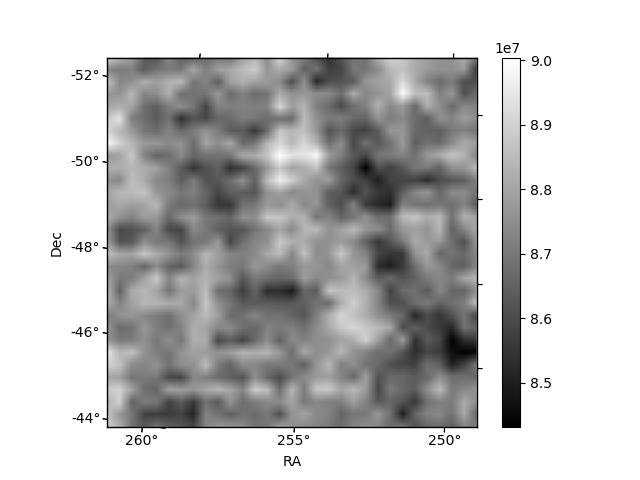
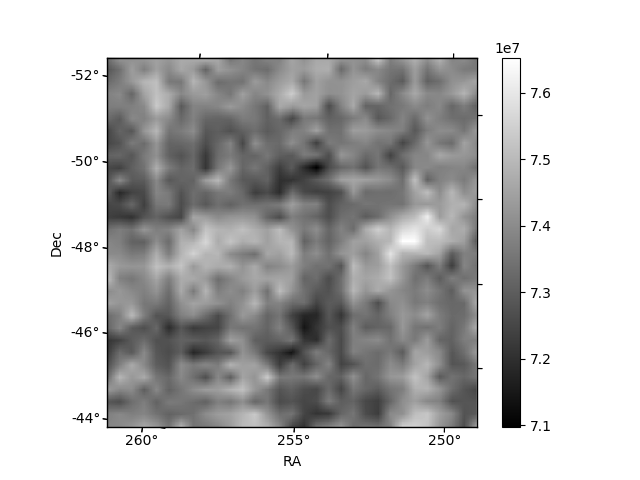
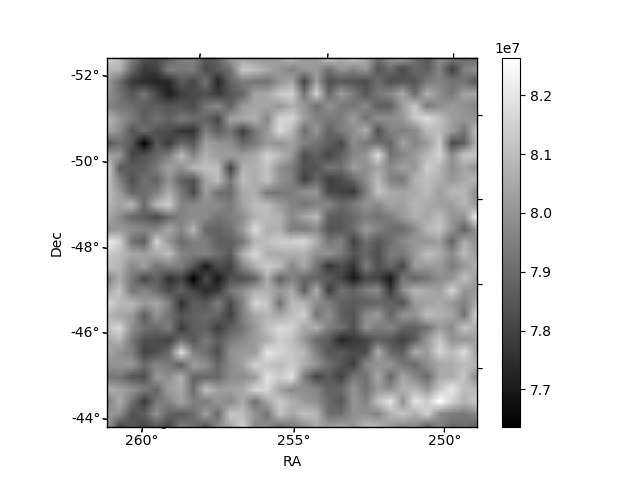
Histogram calculated using DETX and DETY for each event in the final _common_clean file
| Quadrant A | 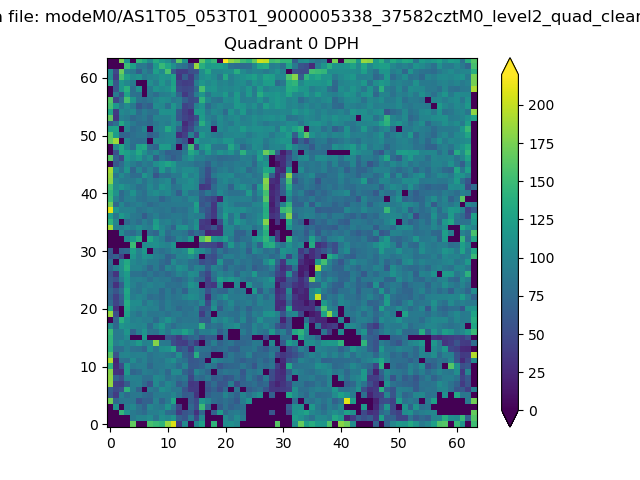 |
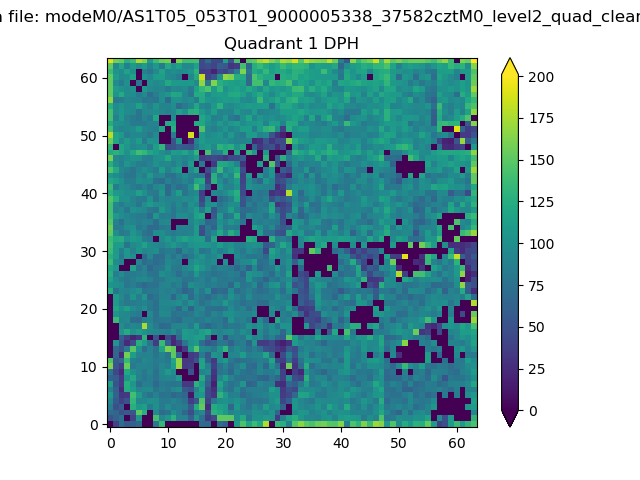 |
Quadrant B |
|---|---|---|---|
| Quadrant D | 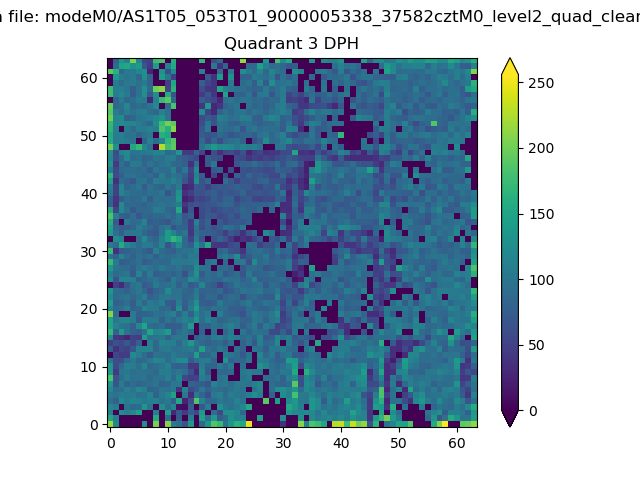 |
 |
Quadrant C |
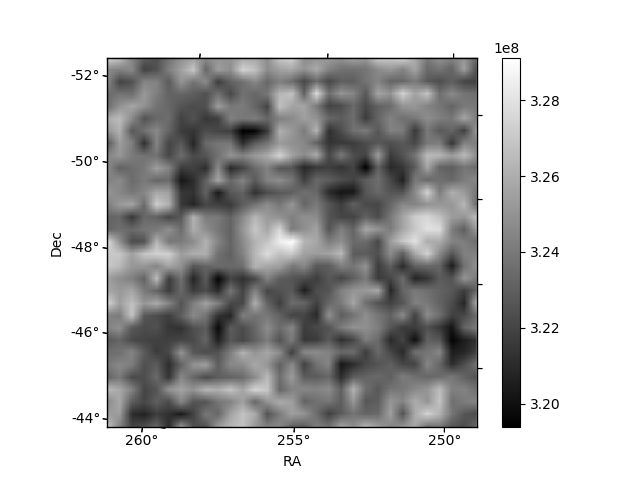
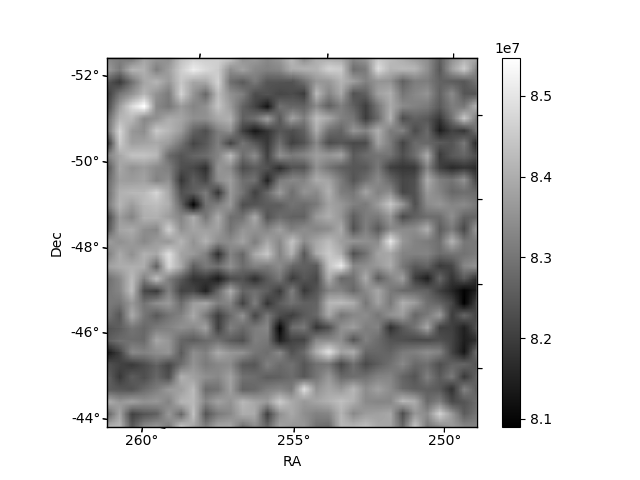
| Plot type | Count rate plots | Images |
|---|---|---|
| Comparison with Poisson distribution Blue bars denote a histogram of data divided into 1 sec bins. Red curve is a Poisson curve with rate = median count rate of data. |
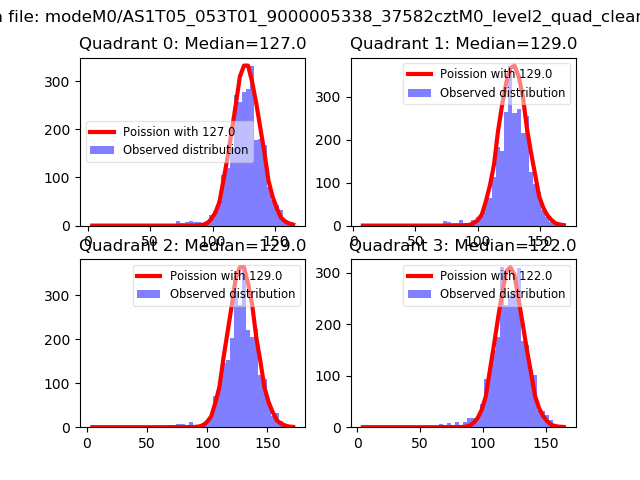 |
 |
| Quadrant-wise count rates Data is divided into 100 sec bins |
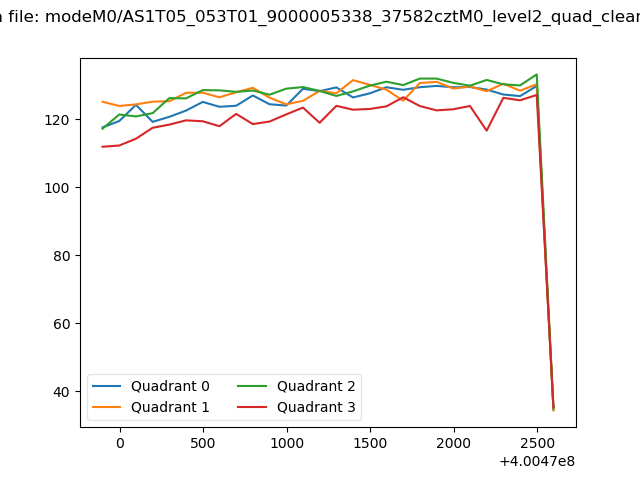 |
|
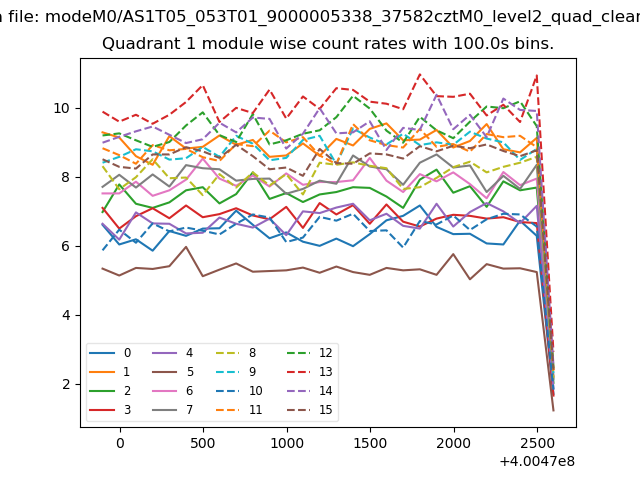
| Module-wise count rates for Quadrant A Data is divided into 100 sec bins |
 |
 |
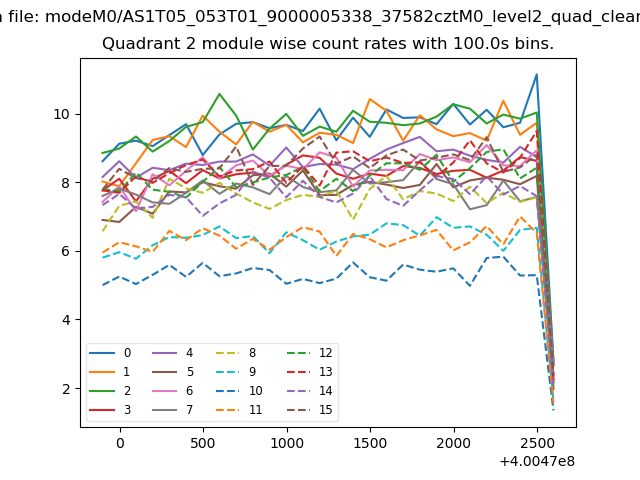
| Module-wise count rates for Quadrant B Data is divided into 100 sec bins |
 |
 |
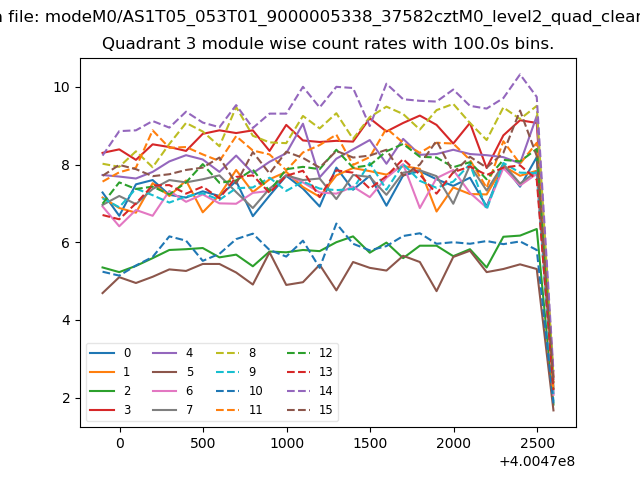
| Module-wise count rates for Quadrant C Data is divided into 100 sec bins |
 |
 |
| Module-wise count rates for Quadrant D Data is divided into 100 sec bins |
 |
 |
| Parameter | Plot |
|---|---|
| CZT HV Monitor | 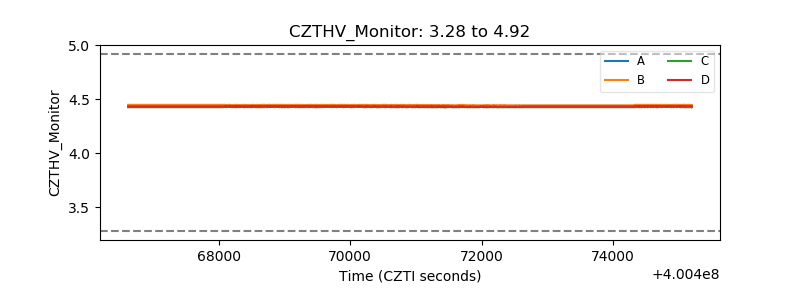 |
| D_VDD | 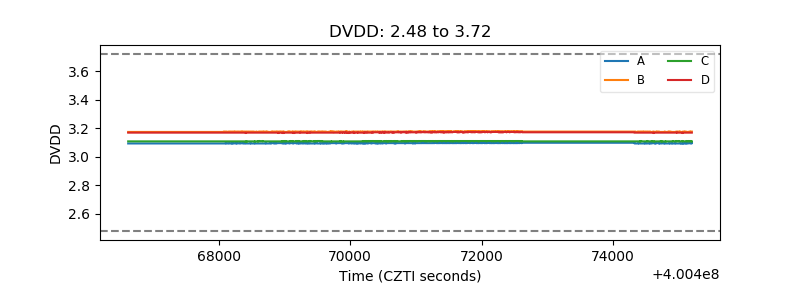 |
| Temperature 1 | 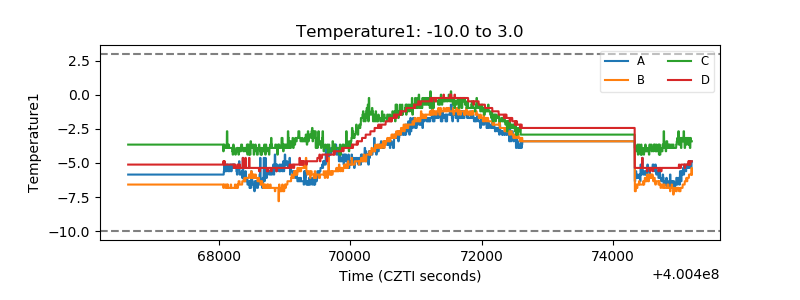 |
| Veto HV Monitor | 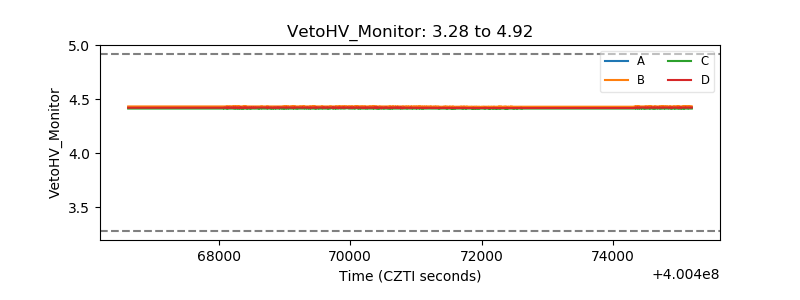 |
| Veto LLD | 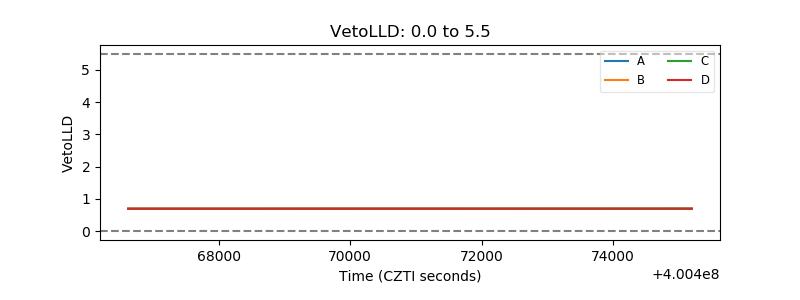 |
| Alpha Counter | 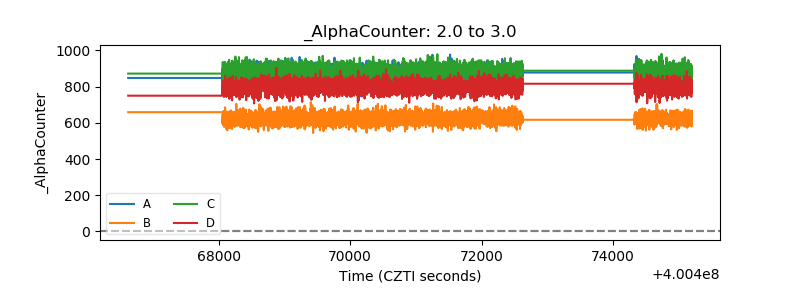 |
| _CPM_Rate | 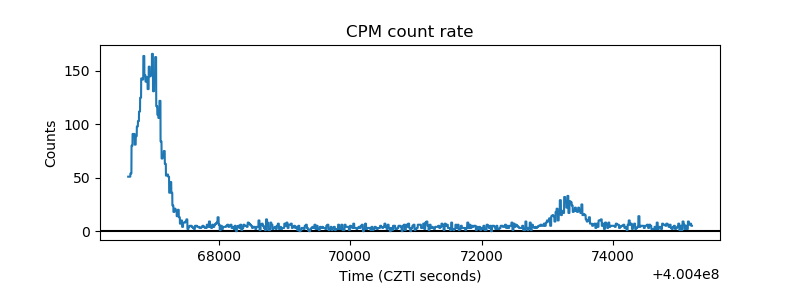 |
| CZT Counter | 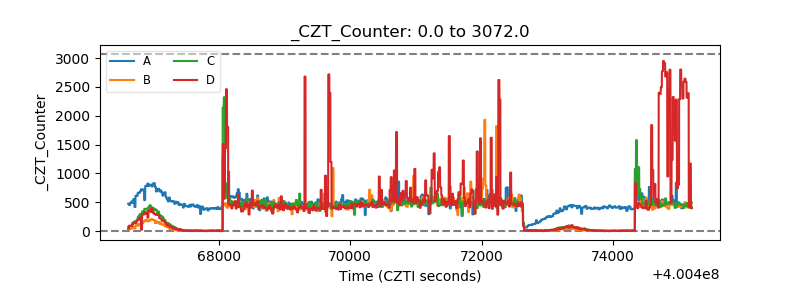 |
| +2.5 Volts monitor | 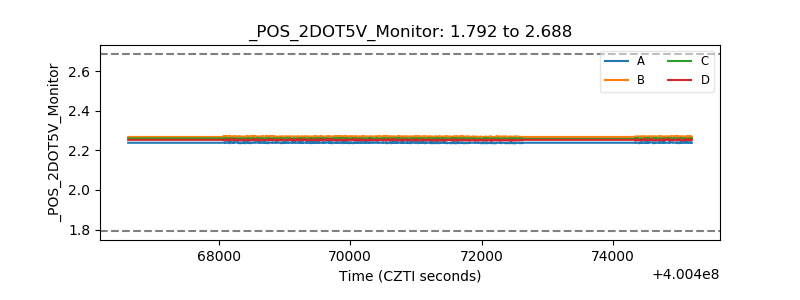 |
| +5 Volts monitor | 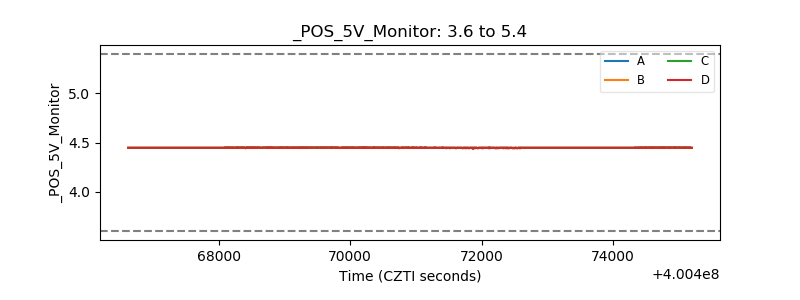 |
| _ROLL_ROT | 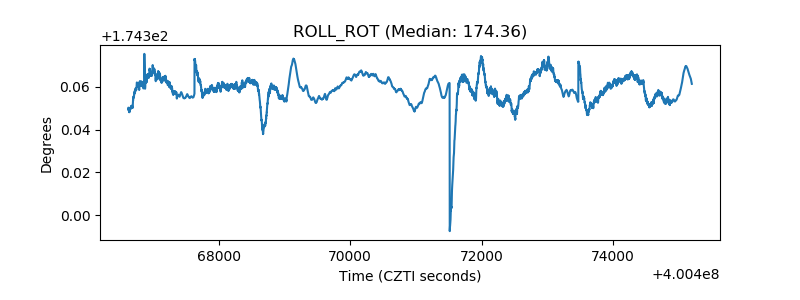 |
| _Roll_DEC | 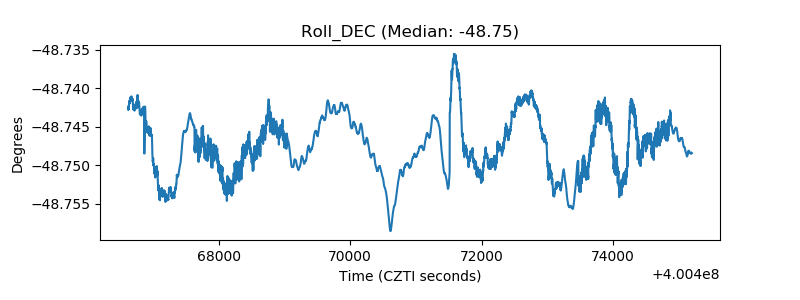 |
| _Roll_RA | 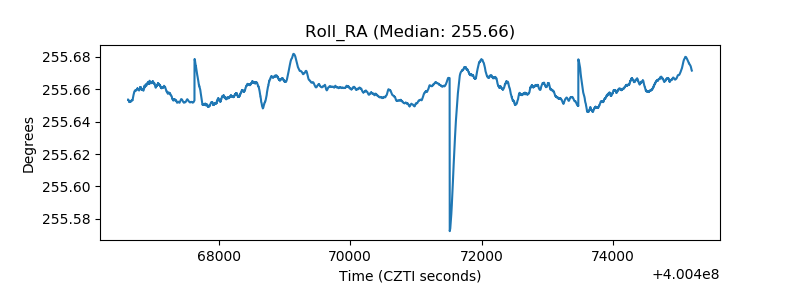 |
| Veto Counter | 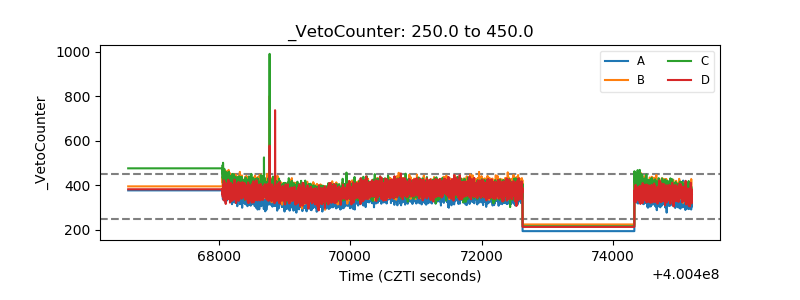 |