| Param | Original file | Final file |
|---|---|---|
| Filename | modeM0/AS1T05_053T01_9000005338_37584cztM0_level2.evt | modeM0/AS1T05_053T01_9000005338_37584cztM0_level2_quad_clean.evt |
| Size (bytes) | 490,524,480 | 90,455,040 |
| Size | 467.8 MB | 86.3 MB |
| Events in quadrant A | 3,313,699 | 578,535 |
| Events in quadrant B | 3,594,048 | 578,978 |
| Events in quadrant C | 3,226,669 | 588,127 |
| Events in quadrant D | 4,284,842 | 545,102 |
| Mode SS | |||
|---|---|---|---|
| Quadrant | BADHDUFLAG | Total packets | Discarded packets |
| A | 0 | 132 | 0 |
| B | 0 | 132 | 0 |
| C | 0 | 132 | 0 |
| D | 0 | 132 | 0 |
| Mode M0 | |||
|---|---|---|---|
| Quadrant | BADHDUFLAG | Total packets | Discarded packets |
| A | 0 | 13617 | 3 |
| B | 0 | 14708 | 2 |
| C | 0 | 13397 | 2 |
| D | 0 | 17146 | 2 |
| Mode M9 | |||
|---|---|---|---|
| Quadrant | BADHDUFLAG | Total packets | Discarded packets |
| A | 0 | 27 | 0 |
| B | 0 | 27 | 0 |
| C | 0 | 27 | 0 |
| D | 0 | 27 | 0 |
| Quadrant | Total seconds | Saturated seconds | Saturation percentage |
|---|---|---|---|
| A | 6429 | 23 | 0.357754% |
| B | 6429 | 155 | 2.410950% |
| C | 6429 | 13 | 0.202209% |
| D | 6429 | 267 | 4.153056% |
Noise dominated data is calculated using 1-second bins in cleaned event files. If a bin has >2000 counts, and if more than 50% of those come from <1% of pixels, then it is considered to be noise-dominated and hence unusable.
| Quadrant | # 1 sec bins | Bins with >0 counts | Bins with >2000 counts | High rate bins dominated by noise | Noise dominated (total time) | Noise dominated (detector-on time) | Marked lightcurve |
|---|---|---|---|---|---|---|---|
| A | 9084 | 6431 | 9 | 9 | 0.10% | 0.14% | 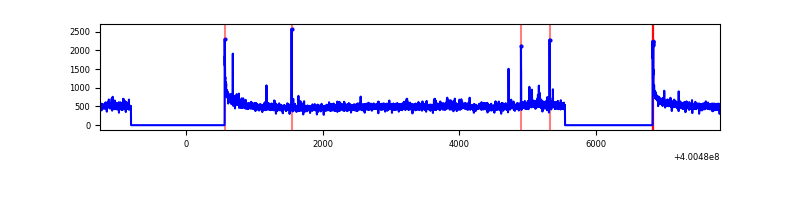 |
| B | 9084 | 6431 | 119 | 119 | 1.31% | 1.85% | 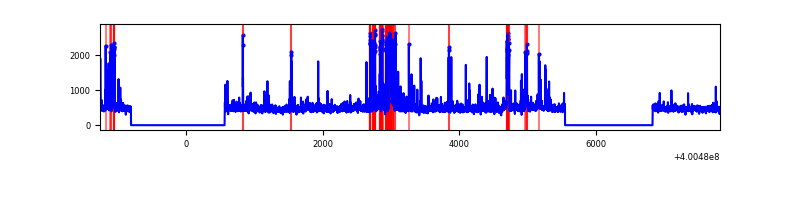 |
| C | 9084 | 6431 | 8 | 8 | 0.09% | 0.12% | 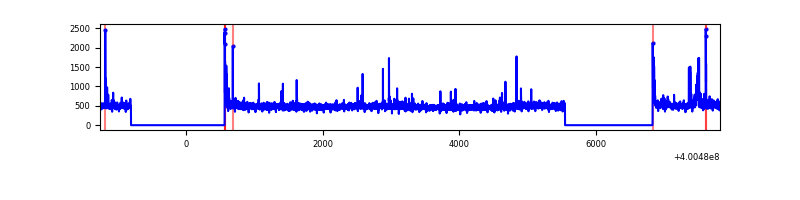 |
| D | 9084 | 6431 | 289 | 289 | 3.18% | 4.49% | 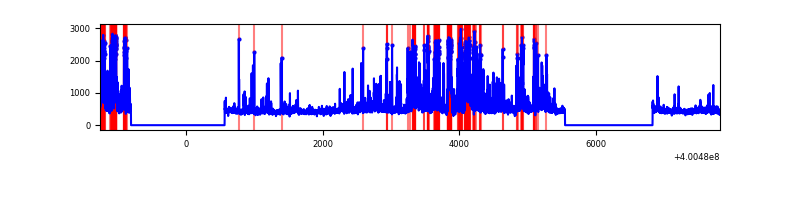 |
Top three noisy pixels from each quadrant. If the there are fewer than three noisy pixels in the level2.evt file, extra rows are filled as -1
| Pixel properties | Quadrant properties | ||||||
|---|---|---|---|---|---|---|---|
| Quadrant | DetID | PixID | Counts | Sigma | Mean | Median | Sigma |
| A | 10 | 83 | 349752 | 2350.07 | 730 | 715 | 148.5 |
| A | 15 | 222 | 43306 | 286.77 | 730 | 715 | 148.5 |
| A | 12 | 189 | 37437 | 247.25 | 730 | 715 | 148.5 |
| B | 5 | 172 | 394849 | 2841.6 | 720 | 701 | 138.7 |
| B | 5 | 255 | 111310 | 797.43 | 720 | 701 | 138.7 |
| B | 0 | 230 | 58084 | 413.7 | 720 | 701 | 138.7 |
| C | 15 | 214 | 279652 | 1683.85 | 712 | 717 | 165.7 |
| C | 14 | 254 | 86425 | 517.39 | 712 | 717 | 165.7 |
| C | 0 | 10 | 50278 | 299.18 | 712 | 717 | 165.7 |
| D | 2 | 249 | 590934 | 3415.97 | 700 | 680 | 172.8 |
| D | 10 | 253 | 451168 | 2607.1 | 700 | 680 | 172.8 |
| D | 1 | 47 | 161437 | 930.35 | 700 | 680 | 172.8 |
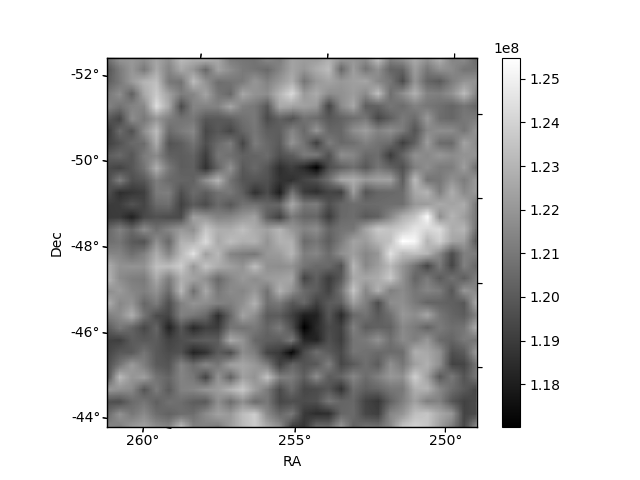
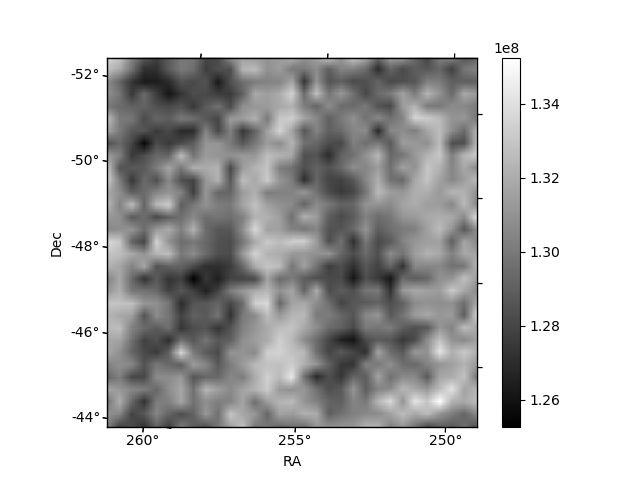
Histogram calculated using DETX and DETY for each event in the final _common_clean file
| Quadrant A | 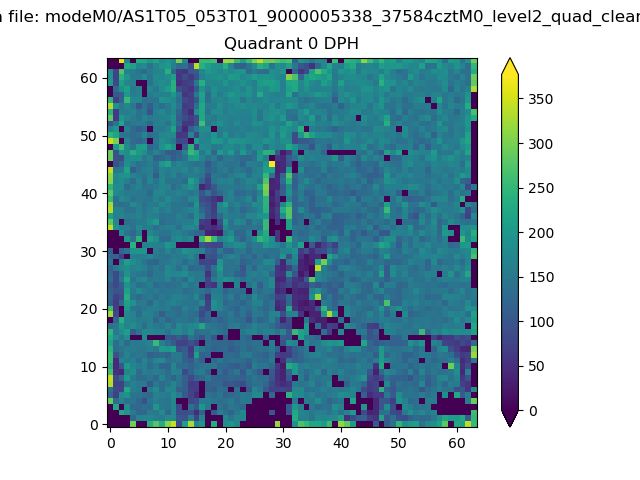 |
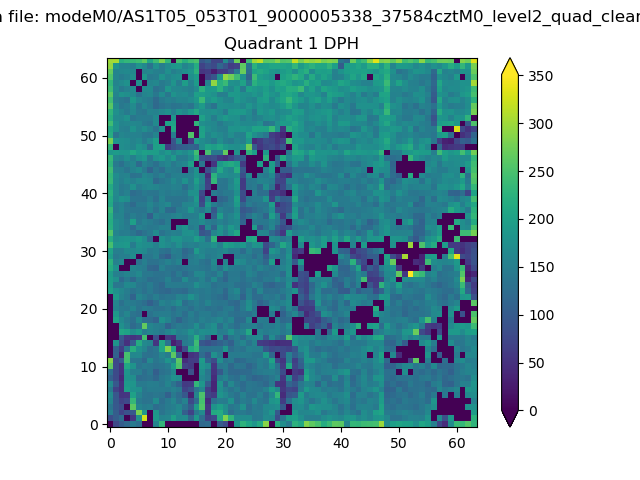 |
Quadrant B |
|---|---|---|---|
| Quadrant D | 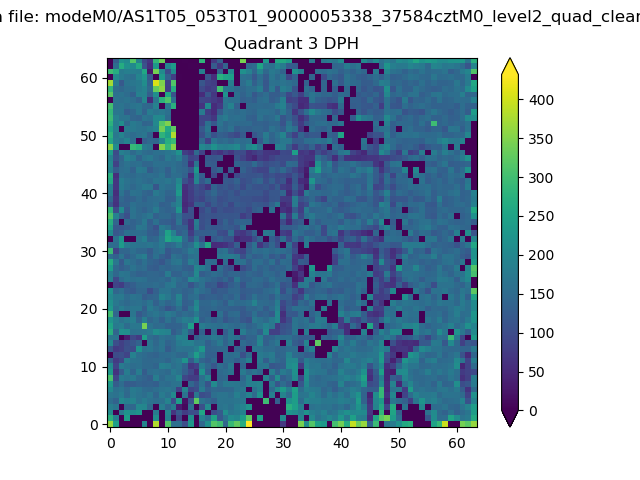 |
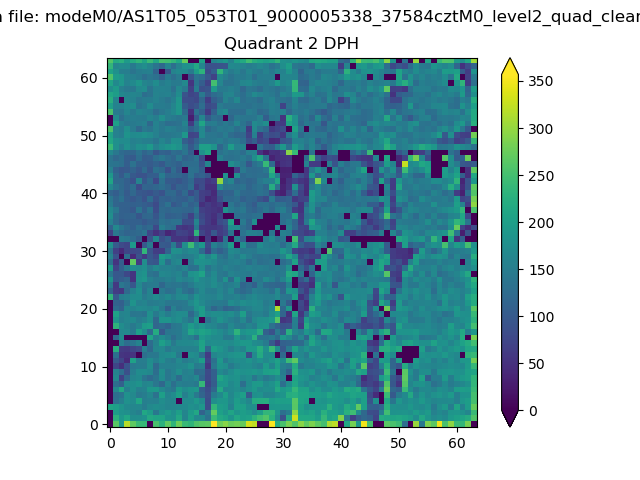 |
Quadrant C |
| Plot type | Count rate plots | Images |
|---|---|---|
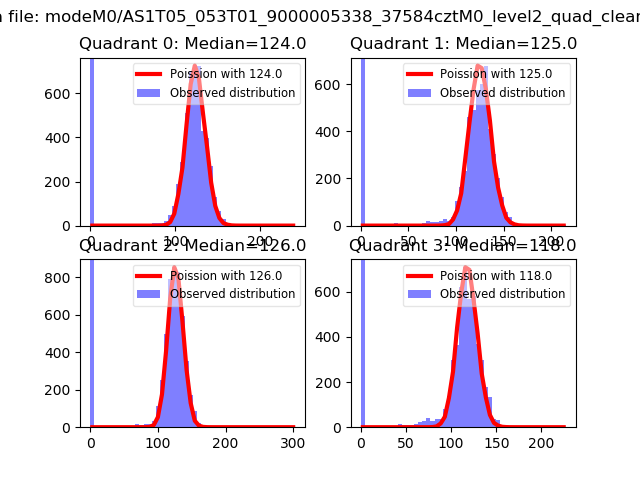
| Comparison with Poisson distribution Blue bars denote a histogram of data divided into 1 sec bins. Red curve is a Poisson curve with rate = median count rate of data. |
 |
 |
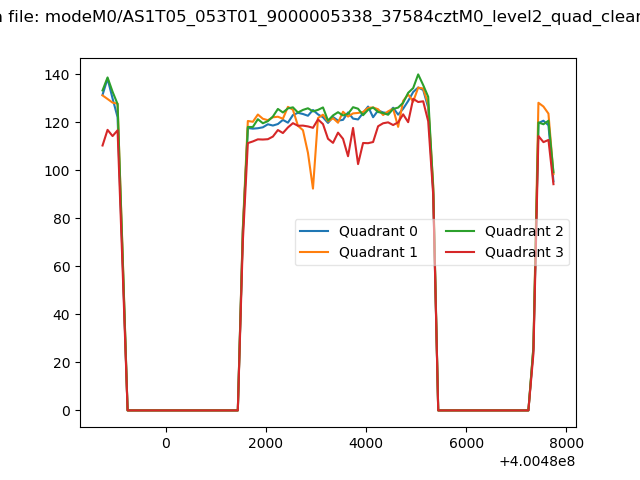
| Quadrant-wise count rates Data is divided into 100 sec bins |
 |
|
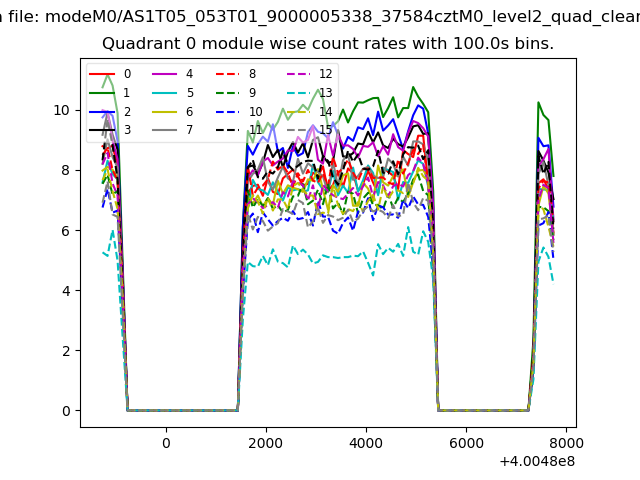
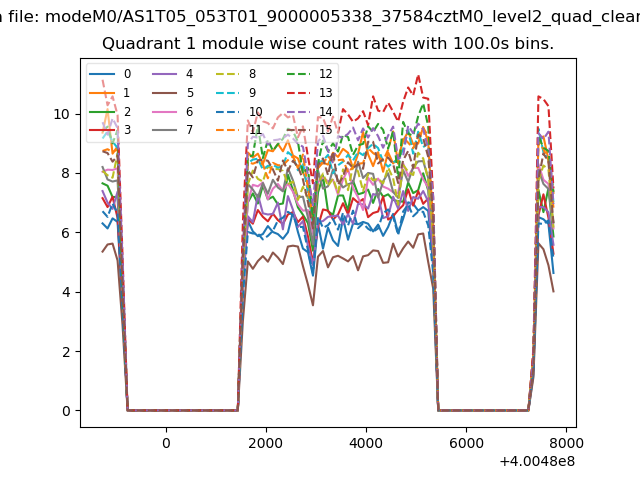
| Module-wise count rates for Quadrant A Data is divided into 100 sec bins |
 |
 |
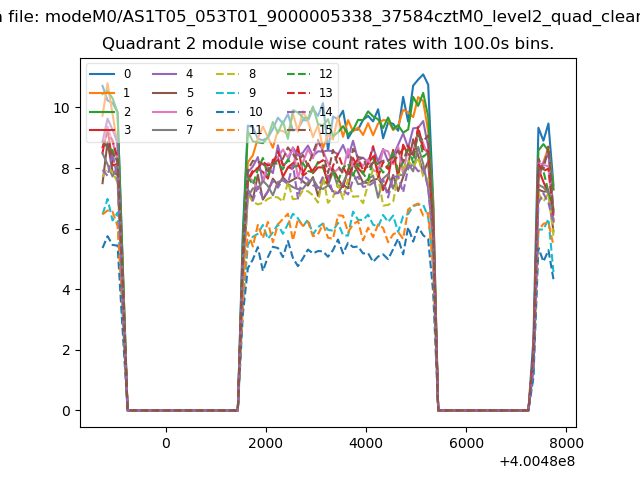
| Module-wise count rates for Quadrant B Data is divided into 100 sec bins |
 |
 |
| Module-wise count rates for Quadrant C Data is divided into 100 sec bins |
 |
 |
| Module-wise count rates for Quadrant D Data is divided into 100 sec bins |
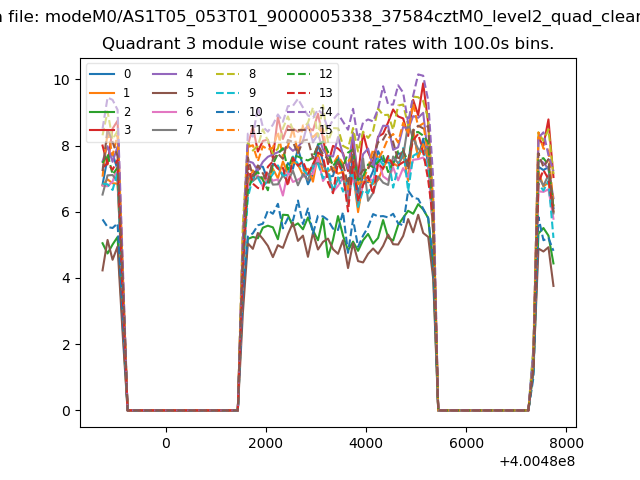 |
 |
| Parameter | Plot |
|---|---|
| CZT HV Monitor | 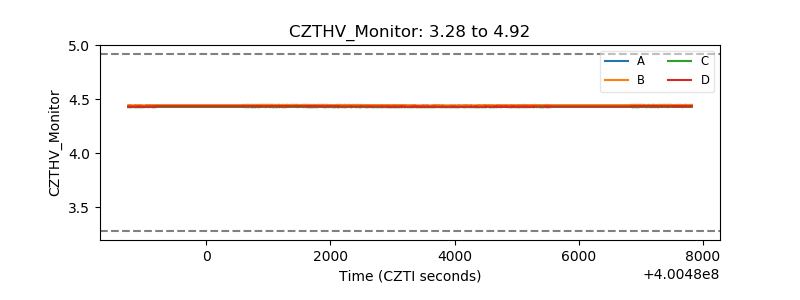 |
| D_VDD | 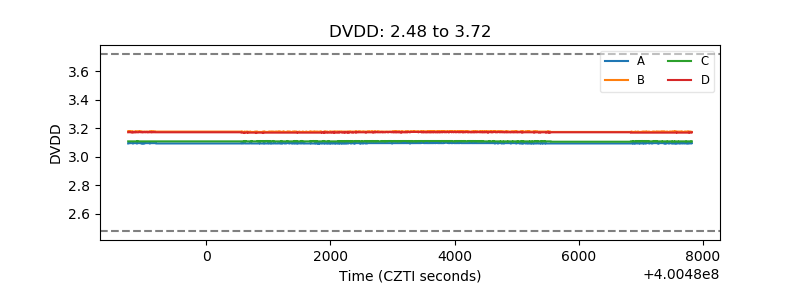 |
| Temperature 1 | 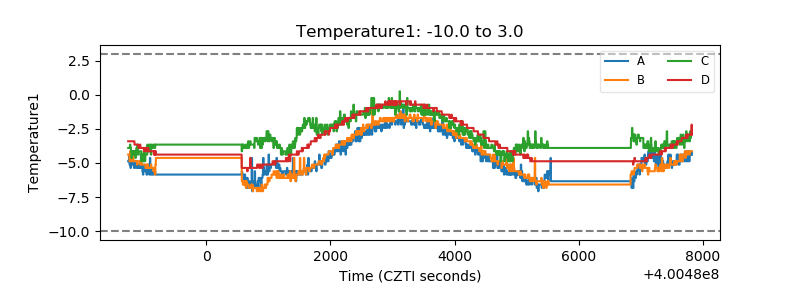 |
| Veto HV Monitor | 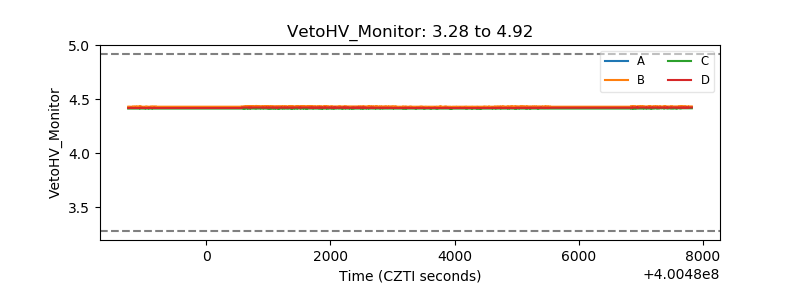 |
| Veto LLD | 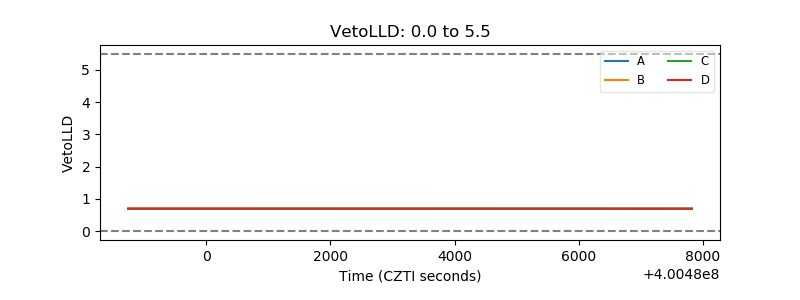 |
| Alpha Counter | 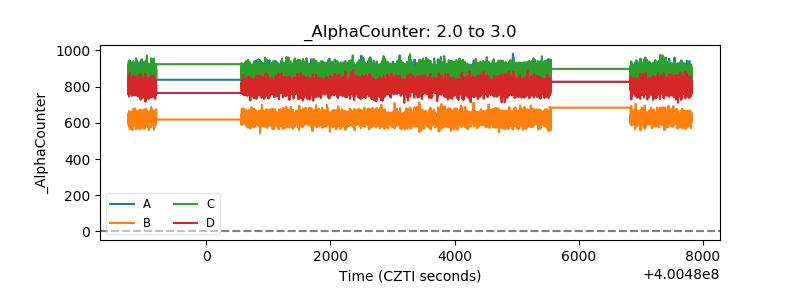 |
| _CPM_Rate | 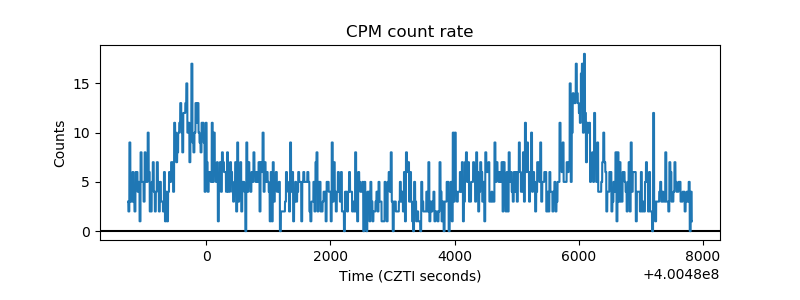 |
| CZT Counter | 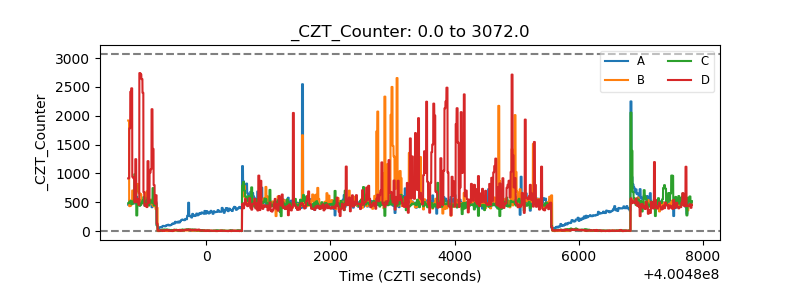 |
| +2.5 Volts monitor | 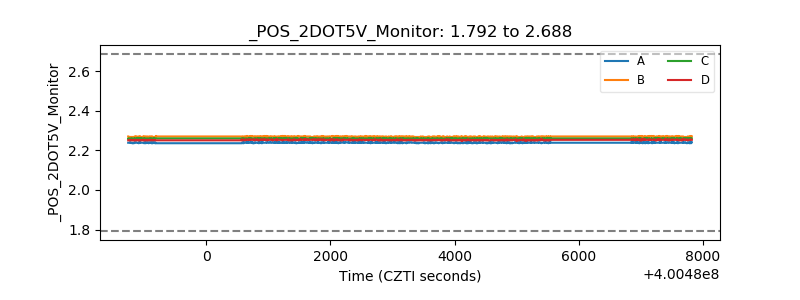 |
| +5 Volts monitor | 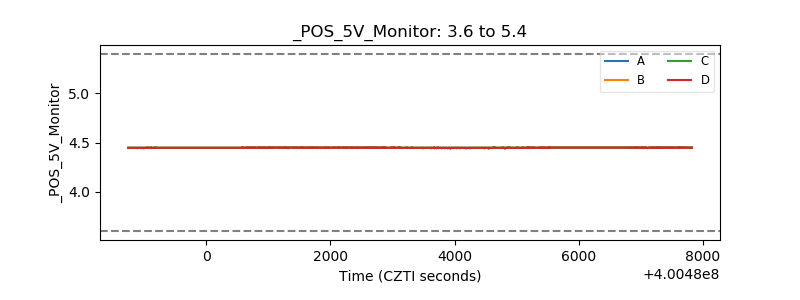 |
| _ROLL_ROT | 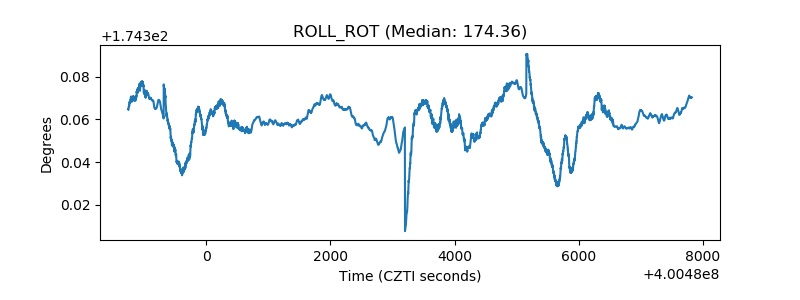 |
| _Roll_DEC | 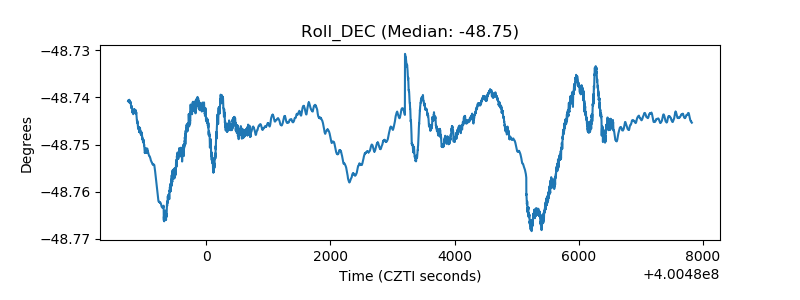 |
| _Roll_RA | 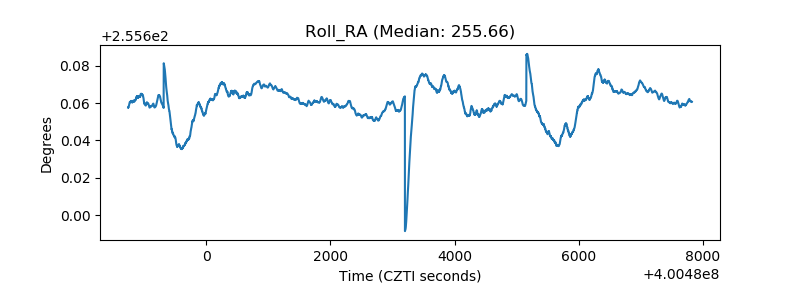 |
| Veto Counter | 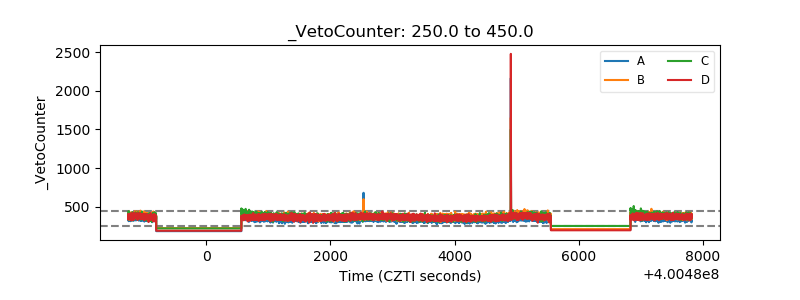 |