| Param | Original file | Final file |
|---|---|---|
| Filename | modeM0/AS1T05_053T01_9000005338_37585cztM0_level2.evt | modeM0/AS1T05_053T01_9000005338_37585cztM0_level2_quad_clean.evt |
| Size (bytes) | 1,306,520,640 | 229,878,720 |
| Size | 1.2 GB | 219.2 MB |
| Events in quadrant A | 8,453,661 | 1,499,412 |
| Events in quadrant B | 10,354,138 | 1,465,354 |
| Events in quadrant C | 8,288,779 | 1,524,593 |
| Events in quadrant D | 11,410,021 | 1,387,369 |
| Mode SS | |||
|---|---|---|---|
| Quadrant | BADHDUFLAG | Total packets | Discarded packets |
| A | 0 | 320 | 0 |
| B | 0 | 320 | 0 |
| C | 0 | 320 | 0 |
| D | 0 | 320 | 0 |
| Mode M0 | |||
|---|---|---|---|
| Quadrant | BADHDUFLAG | Total packets | Discarded packets |
| A | 0 | 34461 | 5 |
| B | 0 | 40720 | 4 |
| C | 0 | 34238 | 4 |
| D | 0 | 44378 | 4 |
| Mode M9 | |||
|---|---|---|---|
| Quadrant | BADHDUFLAG | Total packets | Discarded packets |
| A | 0 | 49 | 0 |
| B | 0 | 49 | 0 |
| C | 0 | 49 | 0 |
| D | 0 | 50 | 0 |
| Quadrant | Total seconds | Saturated seconds | Saturation percentage |
|---|---|---|---|
| A | 15733 | 112 | 0.711879% |
| B | 15733 | 904 | 5.745884% |
| C | 15733 | 92 | 0.584758% |
| D | 15733 | 1064 | 6.762855% |
Noise dominated data is calculated using 1-second bins in cleaned event files. If a bin has >2000 counts, and if more than 50% of those come from <1% of pixels, then it is considered to be noise-dominated and hence unusable.
| Quadrant | # 1 sec bins | Bins with >0 counts | Bins with >2000 counts | High rate bins dominated by noise | Noise dominated (total time) | Noise dominated (detector-on time) | Marked lightcurve |
|---|---|---|---|---|---|---|---|
| A | 19941 | 15736 | 83 | 83 | 0.42% | 0.53% | 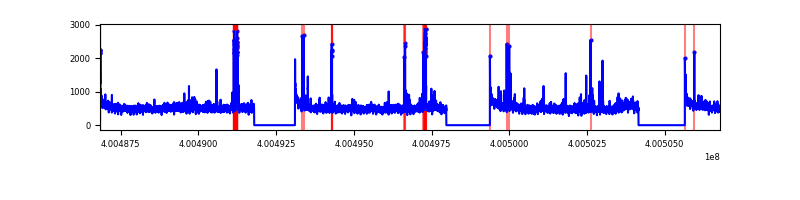 |
| B | 19941 | 15736 | 751 | 751 | 3.77% | 4.77% | 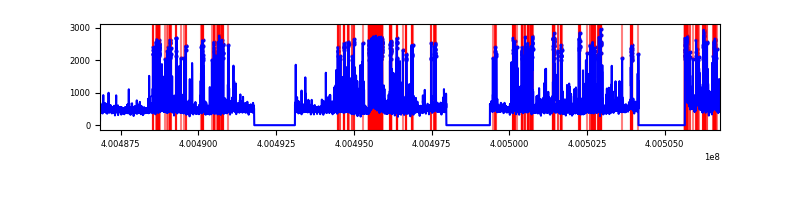 |
| C | 19941 | 15736 | 58 | 58 | 0.29% | 0.37% | 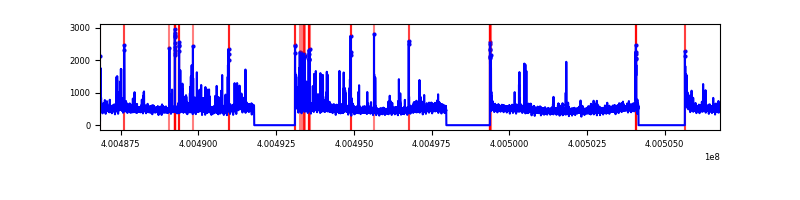 |
| D | 19941 | 15736 | 1119 | 1119 | 5.61% | 7.11% | 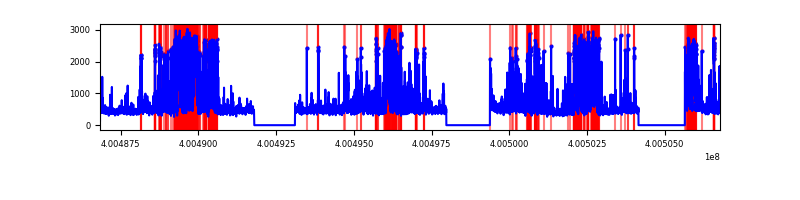 |
Top three noisy pixels from each quadrant. If the there are fewer than three noisy pixels in the level2.evt file, extra rows are filled as -1
| Pixel properties | Quadrant properties | ||||||
|---|---|---|---|---|---|---|---|
| Quadrant | DetID | PixID | Counts | Sigma | Mean | Median | Sigma |
| A | 10 | 83 | 827458 | 2298.65 | 1788 | 1751 | 359.2 |
| A | 13 | 248 | 282774 | 782.33 | 1788 | 1751 | 359.2 |
| A | 15 | 222 | 195373 | 539.01 | 1788 | 1751 | 359.2 |
| B | 5 | 255 | 1367802 | 4147.84 | 1737 | 1693 | 329.4 |
| B | 5 | 172 | 1244704 | 3774.08 | 1737 | 1693 | 329.4 |
| B | 0 | 230 | 197504 | 594.53 | 1737 | 1693 | 329.4 |
| C | 15 | 214 | 675349 | 1670.08 | 1737 | 1751 | 403.3 |
| C | 14 | 254 | 336426 | 829.77 | 1737 | 1751 | 403.3 |
| C | 12 | 249 | 281559 | 693.74 | 1737 | 1751 | 403.3 |
| D | 2 | 249 | 3337438 | 8002.12 | 1698 | 1650 | 416.9 |
| D | 2 | 153 | 306918 | 732.3 | 1698 | 1650 | 416.9 |
| D | 12 | 233 | 230043 | 547.88 | 1698 | 1650 | 416.9 |
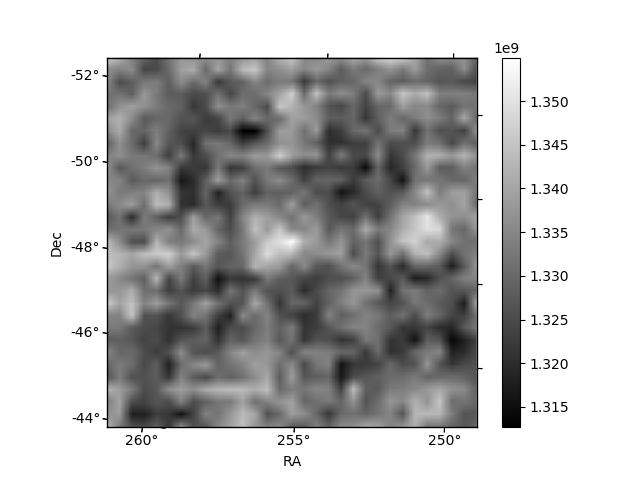
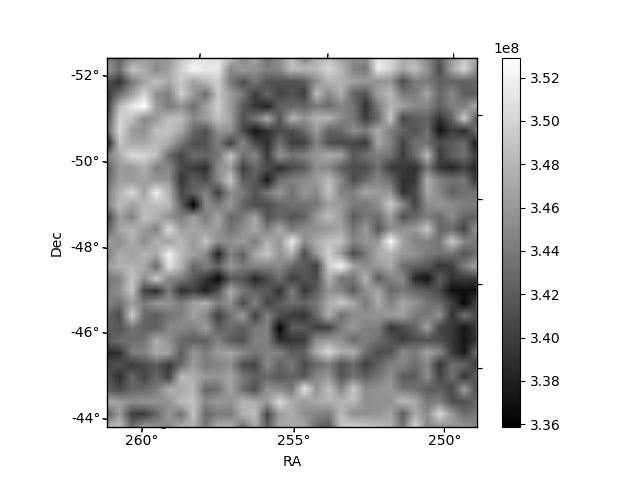
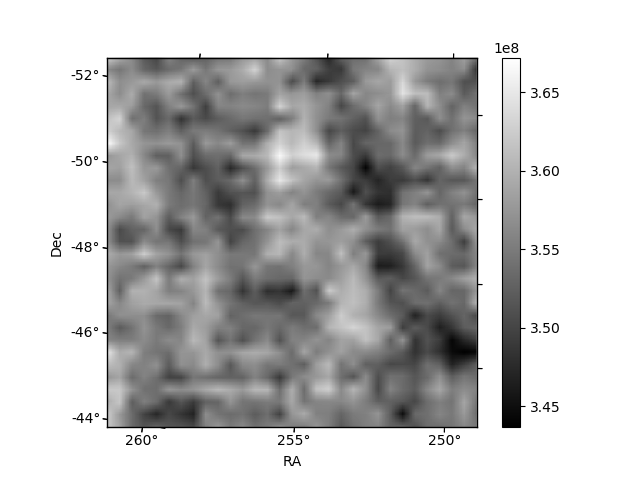
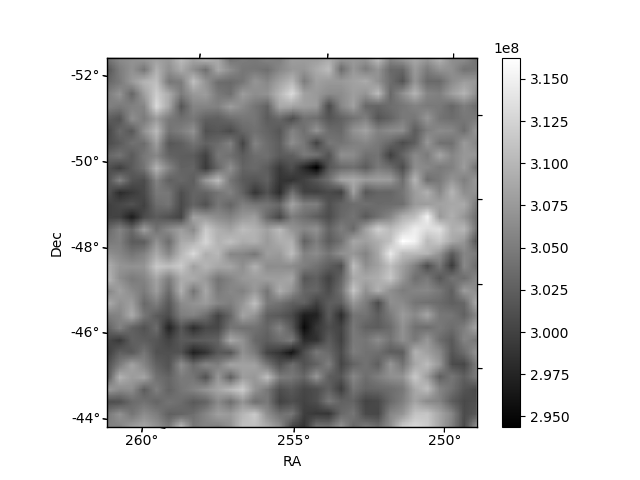
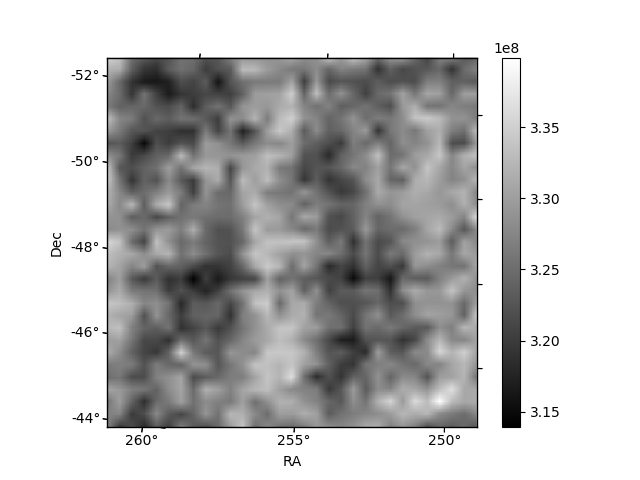
Histogram calculated using DETX and DETY for each event in the final _common_clean file
| Quadrant A | 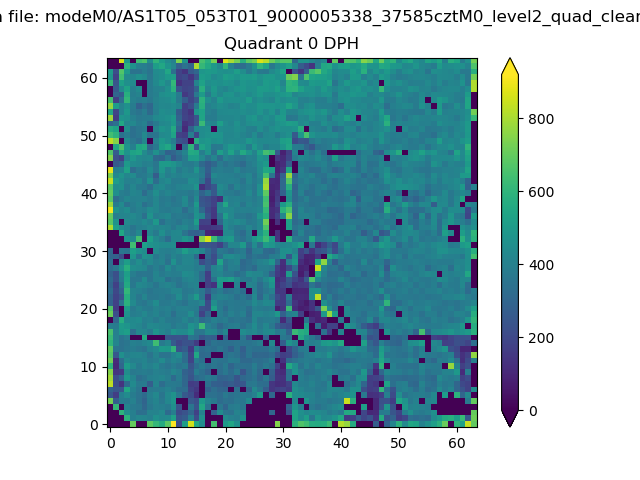 |
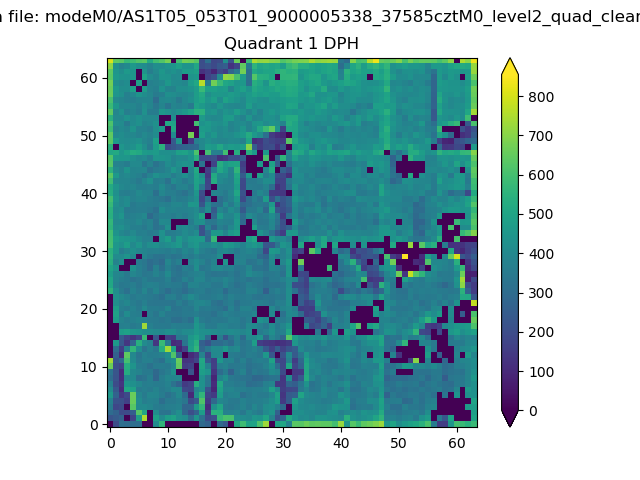 |
Quadrant B |
|---|---|---|---|
| Quadrant D | 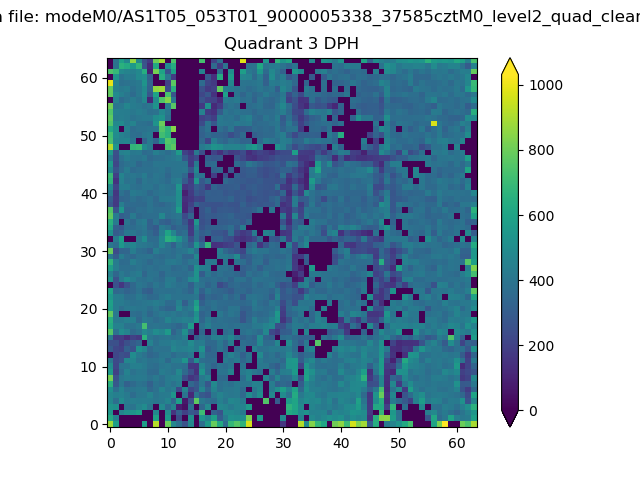 |
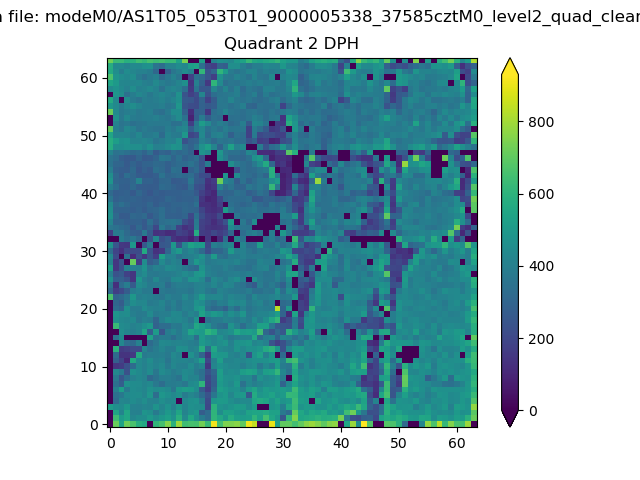 |
Quadrant C |
| Plot type | Count rate plots | Images |
|---|---|---|
| Comparison with Poisson distribution Blue bars denote a histogram of data divided into 1 sec bins. Red curve is a Poisson curve with rate = median count rate of data. |
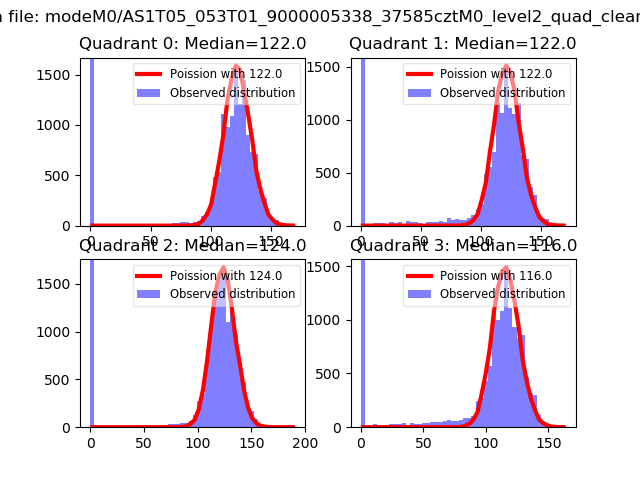 |
 |
| Quadrant-wise count rates Data is divided into 100 sec bins |
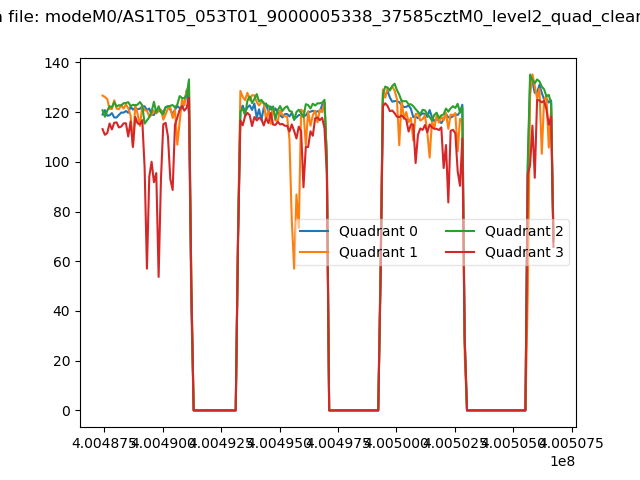 |
|
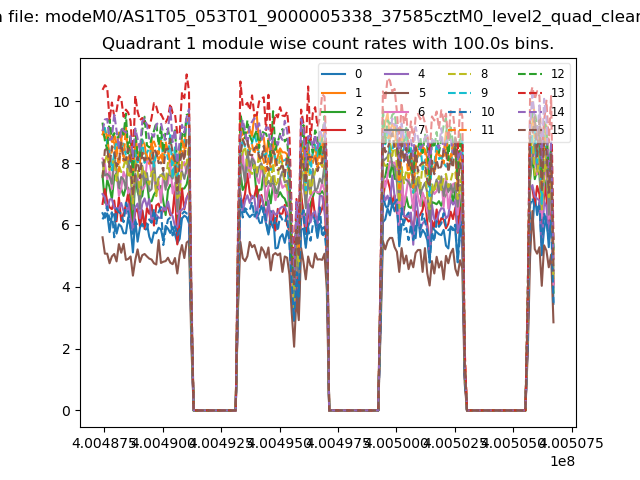
| Module-wise count rates for Quadrant A Data is divided into 100 sec bins |
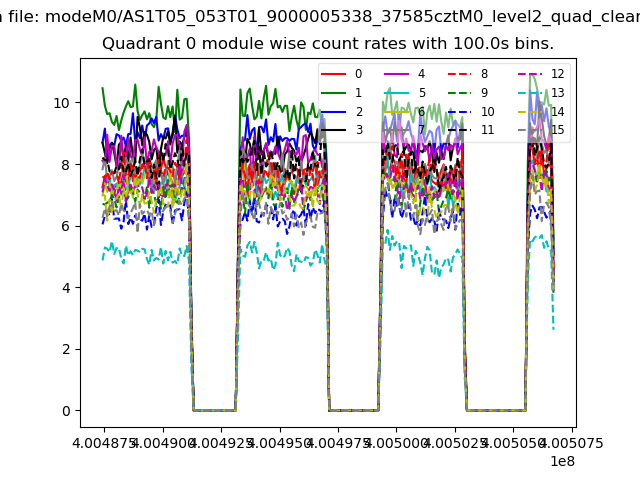 |
 |
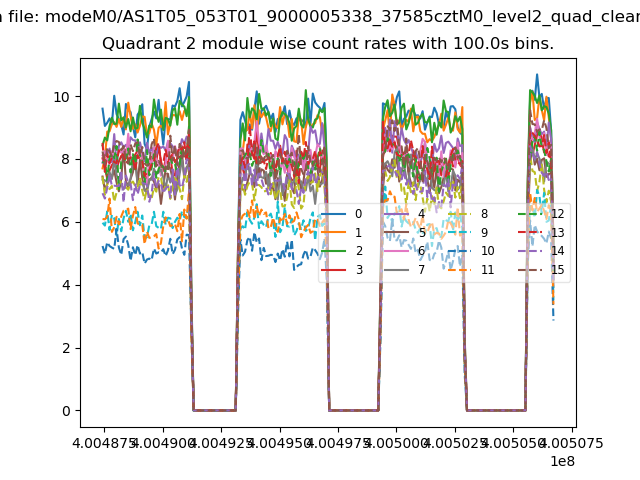
| Module-wise count rates for Quadrant B Data is divided into 100 sec bins |
 |
 |
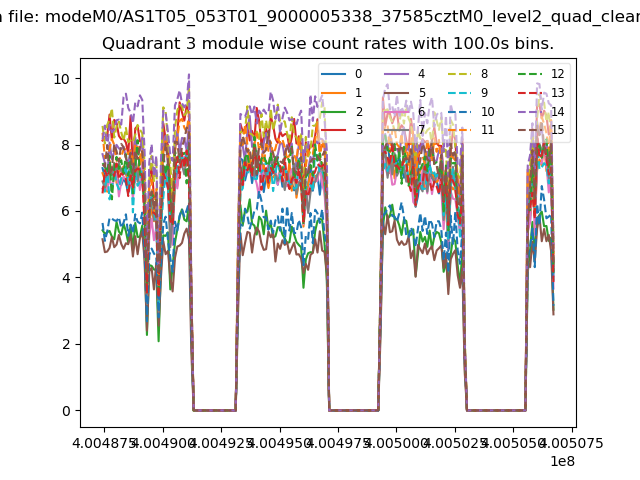
| Module-wise count rates for Quadrant C Data is divided into 100 sec bins |
 |
 |
| Module-wise count rates for Quadrant D Data is divided into 100 sec bins |
 |
 |
| Parameter | Plot |
|---|---|
| CZT HV Monitor | 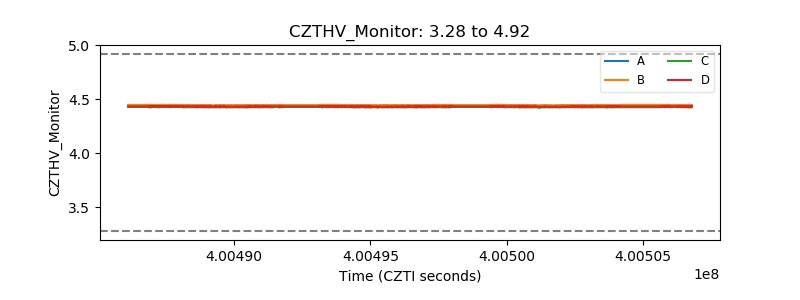 |
| D_VDD | 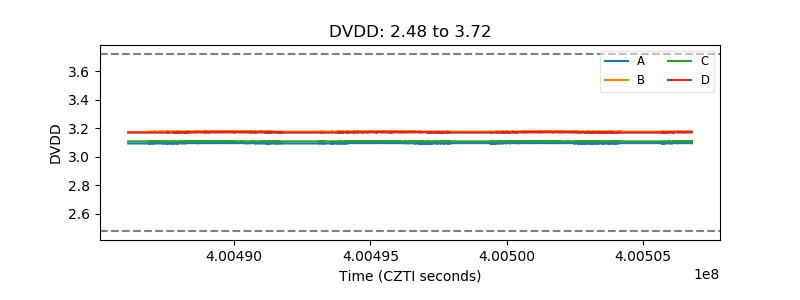 |
| Temperature 1 | 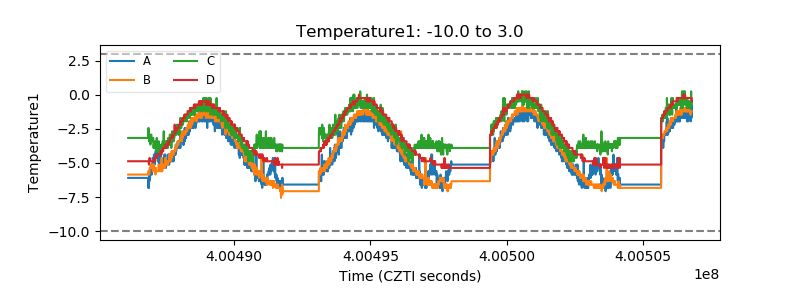 |
| Veto HV Monitor | 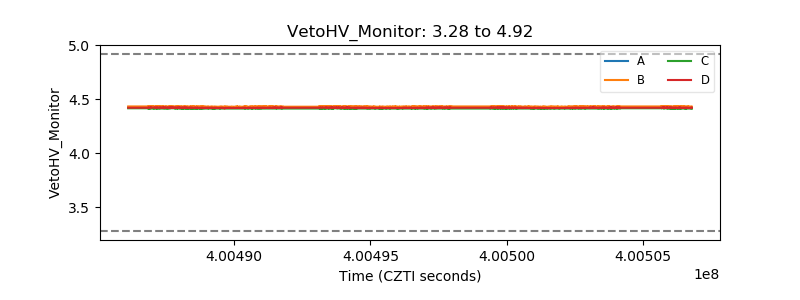 |
| Veto LLD | 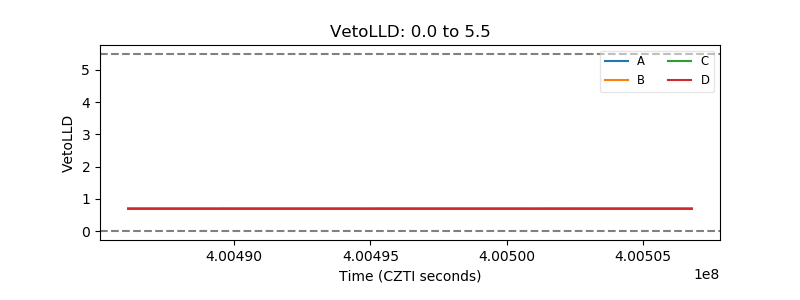 |
| Alpha Counter | 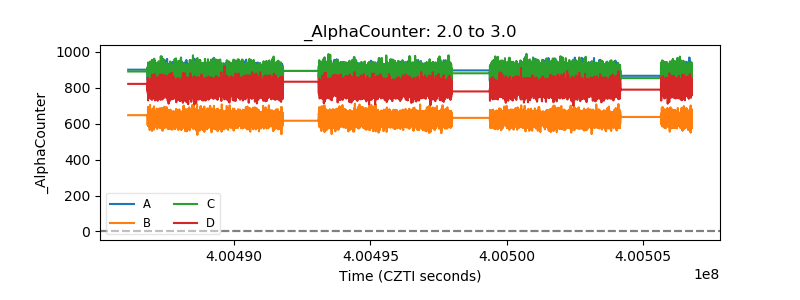 |
| _CPM_Rate | 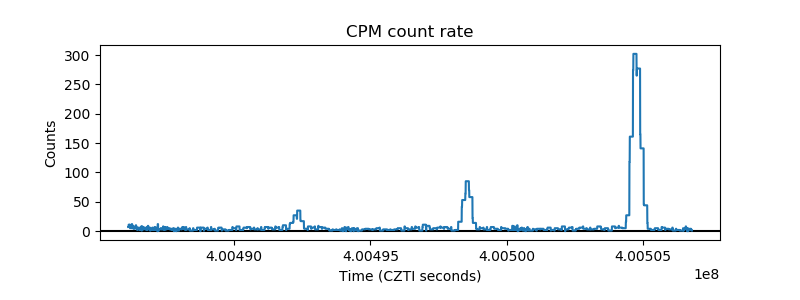 |
| CZT Counter | 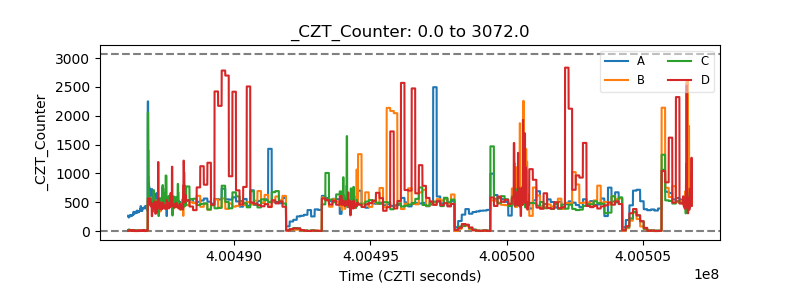 |
| +2.5 Volts monitor | 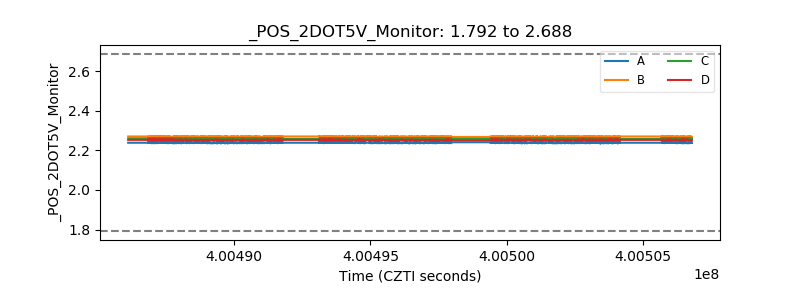 |
| +5 Volts monitor | 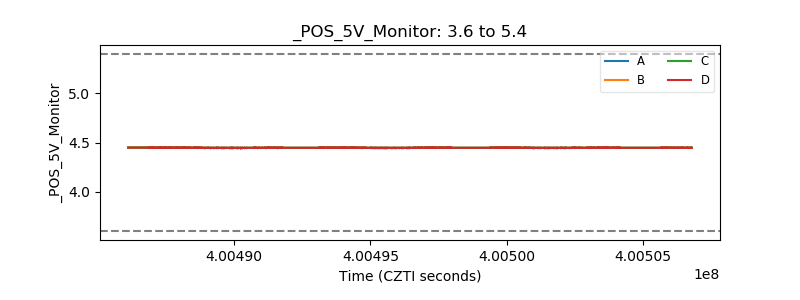 |
| _ROLL_ROT | 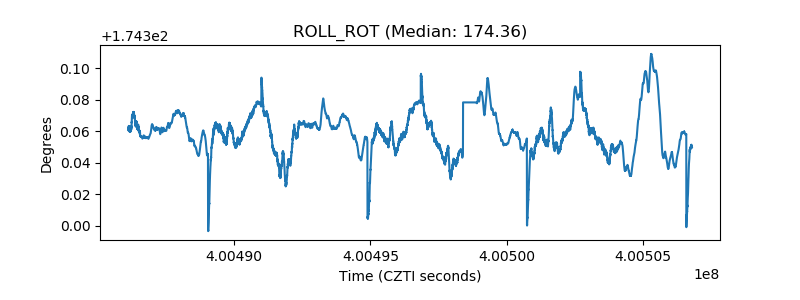 |
| _Roll_DEC | 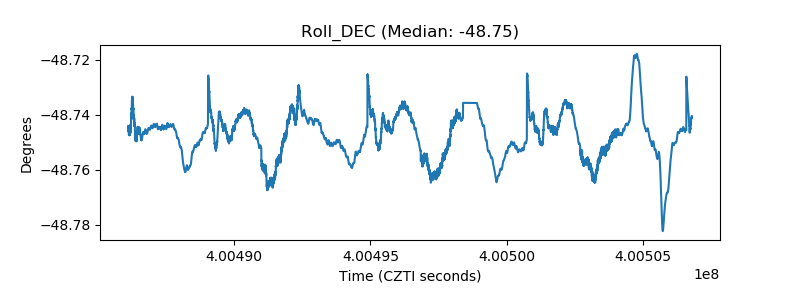 |
| _Roll_RA | 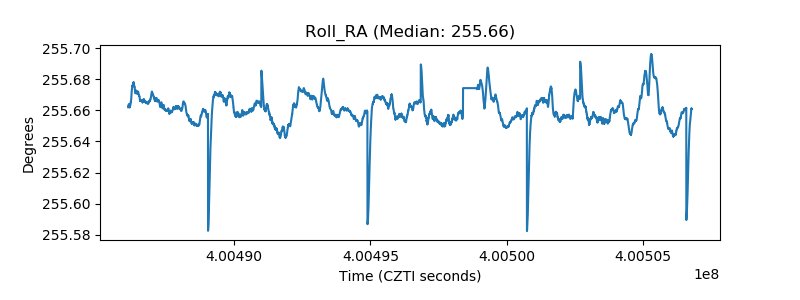 |
| Veto Counter | 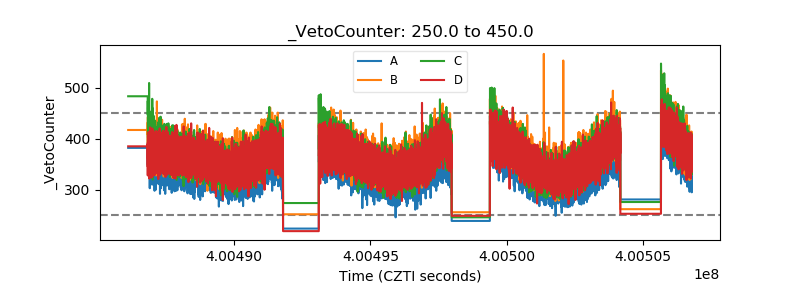 |