| Param | Original file | Final file |
|---|---|---|
| Filename | modeM0/AS1T05_053T01_9000005338_37588cztM0_level2.evt | modeM0/AS1T05_053T01_9000005338_37588cztM0_level2_quad_clean.evt |
| Size (bytes) | 475,096,320 | 79,741,440 |
| Size | 453.1 MB | 76.0 MB |
| Events in quadrant A | 2,936,431 | 516,296 |
| Events in quadrant B | 4,179,975 | 502,339 |
| Events in quadrant C | 2,926,962 | 519,548 |
| Events in quadrant D | 3,962,061 | 481,929 |
| Mode SS | |||
|---|---|---|---|
| Quadrant | BADHDUFLAG | Total packets | Discarded packets |
| A | 0 | 116 | 0 |
| B | 0 | 116 | 0 |
| C | 0 | 116 | 0 |
| D | 0 | 116 | 0 |
| Mode M0 | |||
|---|---|---|---|
| Quadrant | BADHDUFLAG | Total packets | Discarded packets |
| A | 0 | 12337 | 3 |
| B | 0 | 16208 | 2 |
| C | 0 | 12216 | 2 |
| D | 0 | 15698 | 2 |
| Mode M9 | |||
|---|---|---|---|
| Quadrant | BADHDUFLAG | Total packets | Discarded packets |
| A | 0 | 16 | 0 |
| B | 0 | 16 | 0 |
| C | 0 | 16 | 0 |
| D | 0 | 17 | 0 |
| Quadrant | Total seconds | Saturated seconds | Saturation percentage |
|---|---|---|---|
| A | 5636 | 15 | 0.266146% |
| B | 5636 | 353 | 6.263307% |
| C | 5636 | 61 | 1.082328% |
| D | 5636 | 333 | 5.908446% |
Noise dominated data is calculated using 1-second bins in cleaned event files. If a bin has >2000 counts, and if more than 50% of those come from <1% of pixels, then it is considered to be noise-dominated and hence unusable.
| Quadrant | # 1 sec bins | Bins with >0 counts | Bins with >2000 counts | High rate bins dominated by noise | Noise dominated (total time) | Noise dominated (detector-on time) | Marked lightcurve |
|---|---|---|---|---|---|---|---|
| A | 7278 | 5637 | 5 | 5 | 0.07% | 0.09% | 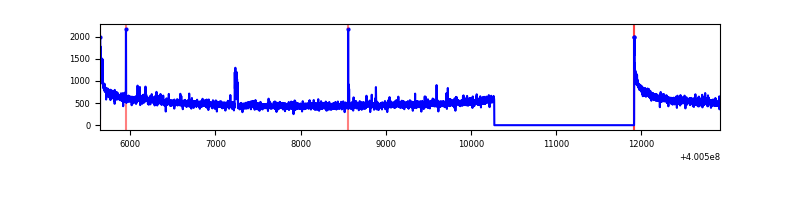 |
| B | 7278 | 5637 | 261 | 261 | 3.59% | 4.63% | 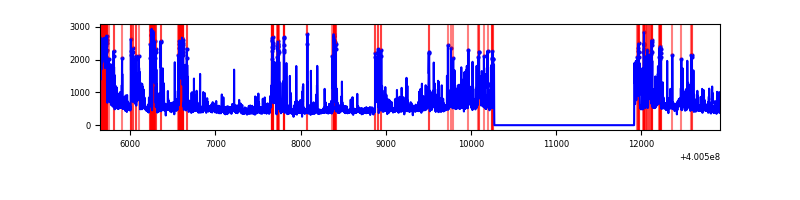 |
| C | 7278 | 5637 | 54 | 54 | 0.74% | 0.96% | 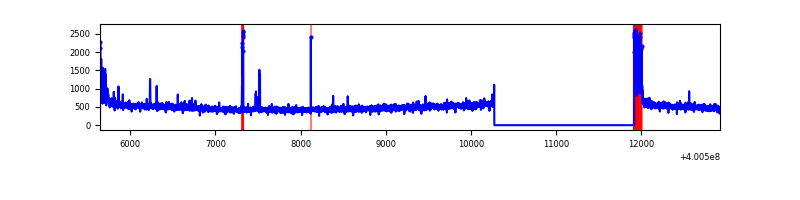 |
| D | 7278 | 5637 | 305 | 305 | 4.19% | 5.41% | 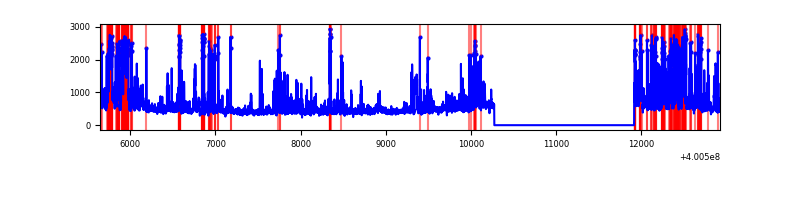 |
Top three noisy pixels from each quadrant. If the there are fewer than three noisy pixels in the level2.evt file, extra rows are filled as -1
| Pixel properties | Quadrant properties | ||||||
|---|---|---|---|---|---|---|---|
| Quadrant | DetID | PixID | Counts | Sigma | Mean | Median | Sigma |
| A | 10 | 83 | 347259 | 2641.13 | 648 | 635 | 131.2 |
| A | 15 | 222 | 33081 | 247.23 | 648 | 635 | 131.2 |
| A | 12 | 189 | 15879 | 116.15 | 648 | 635 | 131.2 |
| B | 5 | 255 | 864662 | 7132.5 | 628 | 613 | 121.1 |
| B | 5 | 172 | 472665 | 3896.67 | 628 | 613 | 121.1 |
| B | 5 | 200 | 80196 | 656.94 | 628 | 613 | 121.1 |
| C | 15 | 214 | 242201 | 1653.21 | 624 | 630 | 146.1 |
| C | 0 | 10 | 170425 | 1162.0 | 624 | 630 | 146.1 |
| C | 15 | 159 | 24172 | 161.11 | 624 | 630 | 146.1 |
| D | 2 | 249 | 413020 | 2731.8 | 617 | 600 | 151.0 |
| D | 10 | 253 | 345116 | 2282.01 | 617 | 600 | 151.0 |
| D | 1 | 52 | 259929 | 1717.75 | 617 | 600 | 151.0 |
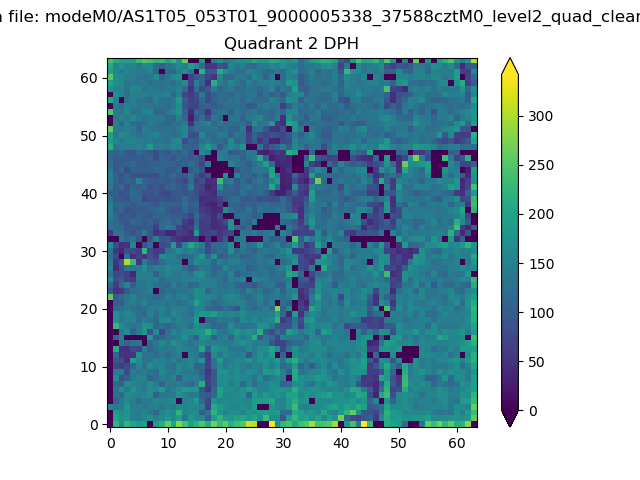
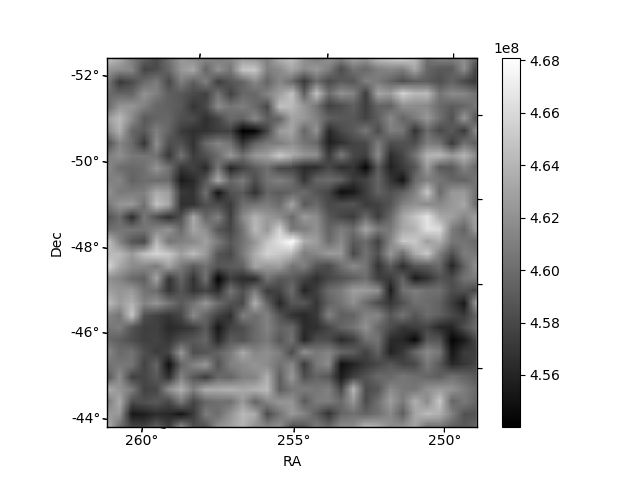
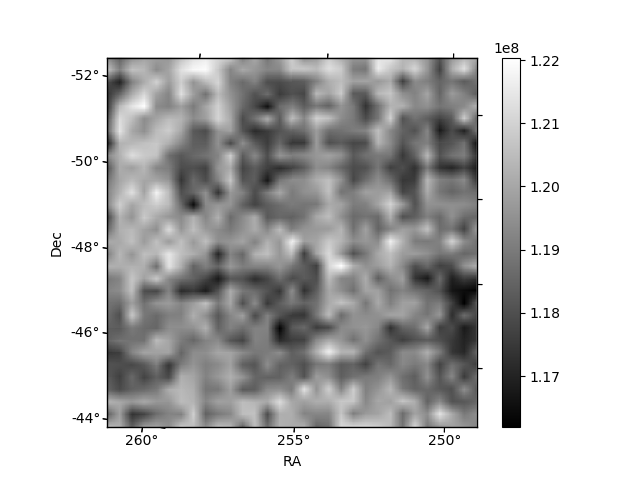
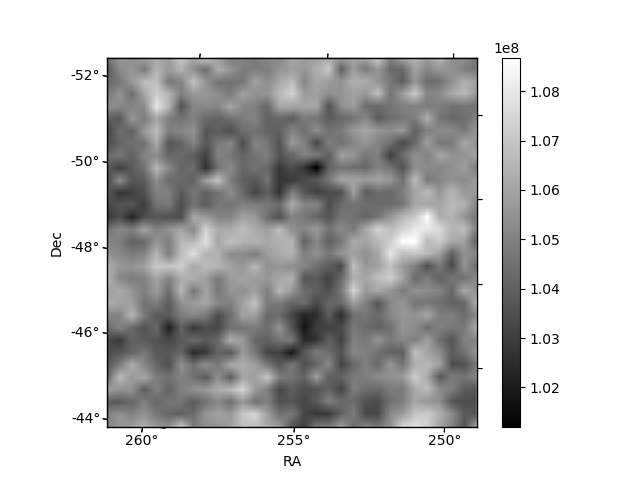
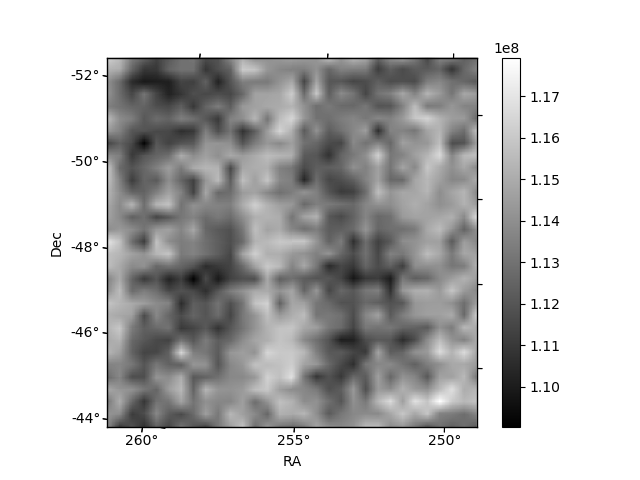
Histogram calculated using DETX and DETY for each event in the final _common_clean file
| Quadrant A | 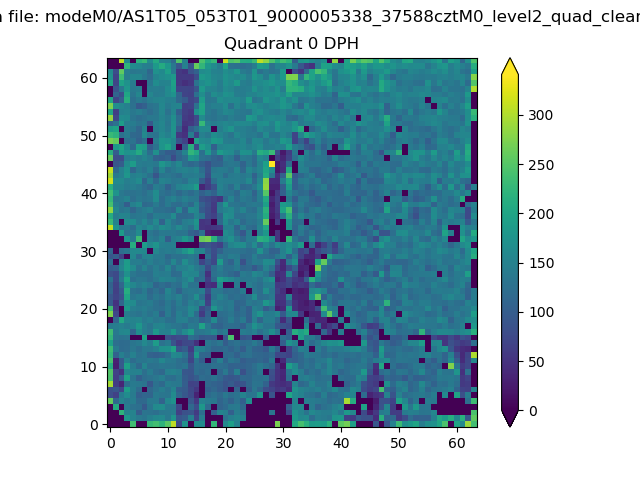 |
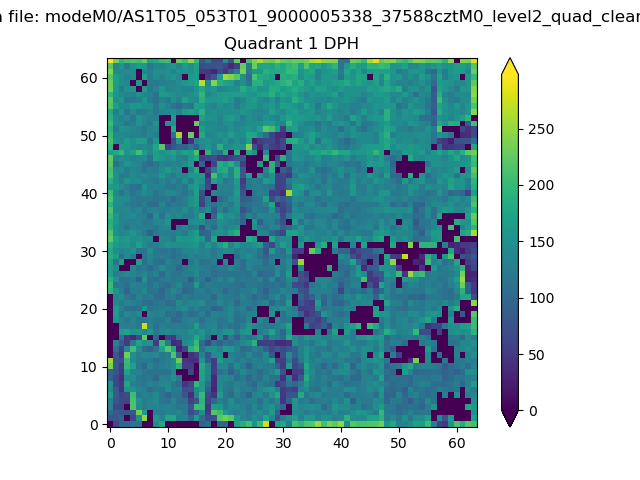 |
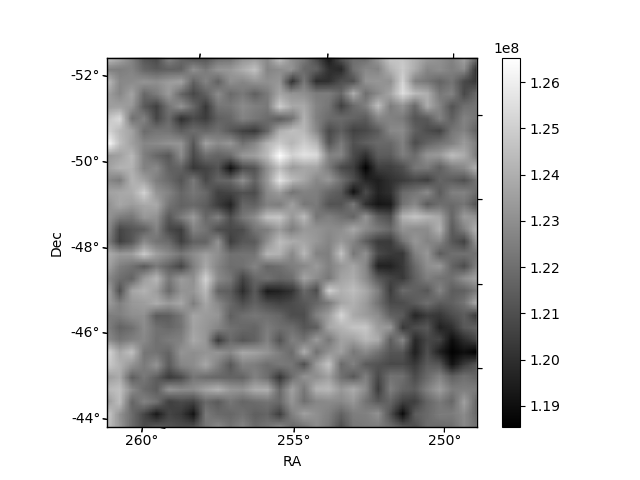
Quadrant B |
|---|---|---|---|
| Quadrant D | 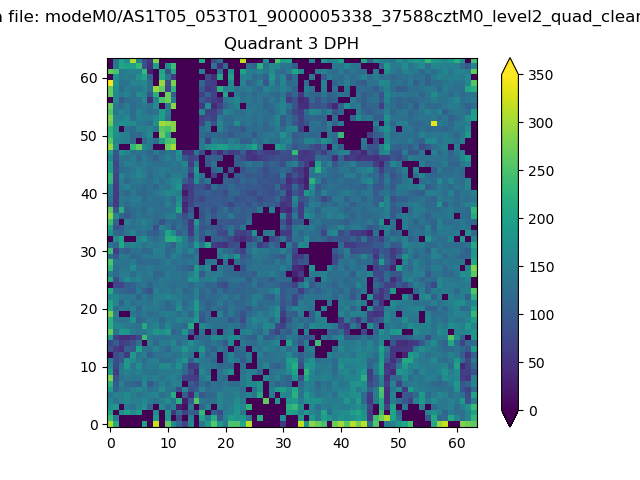 |
 |
Quadrant C |
| Plot type | Count rate plots | Images |
|---|---|---|
| Comparison with Poisson distribution Blue bars denote a histogram of data divided into 1 sec bins. Red curve is a Poisson curve with rate = median count rate of data. |
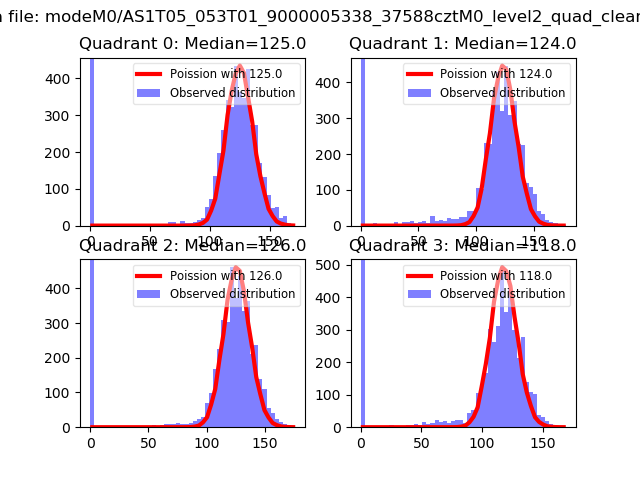 |
 |
| Quadrant-wise count rates Data is divided into 100 sec bins |
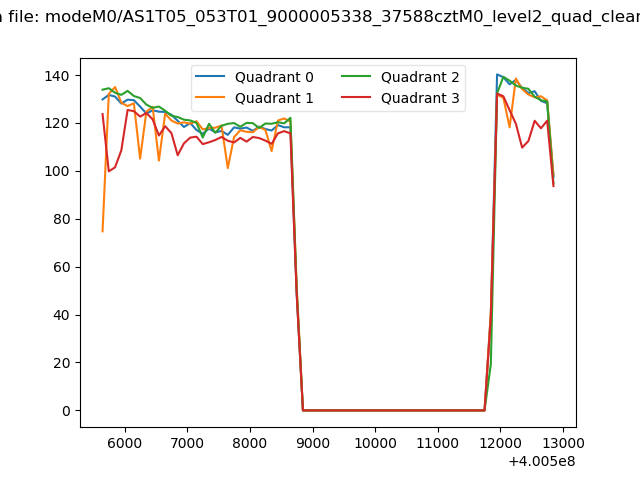 |
|
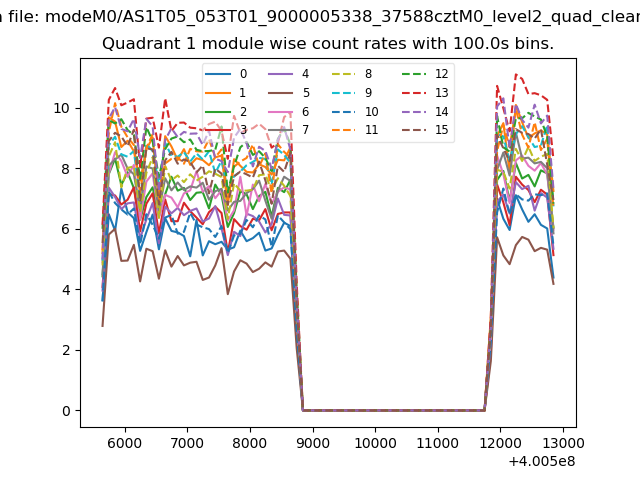
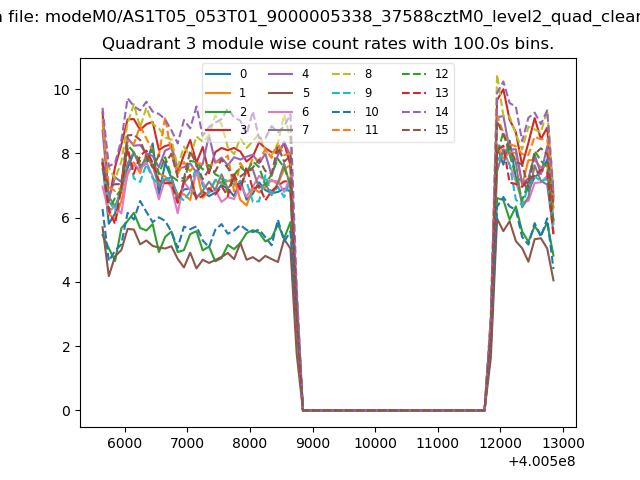
| Module-wise count rates for Quadrant A Data is divided into 100 sec bins |
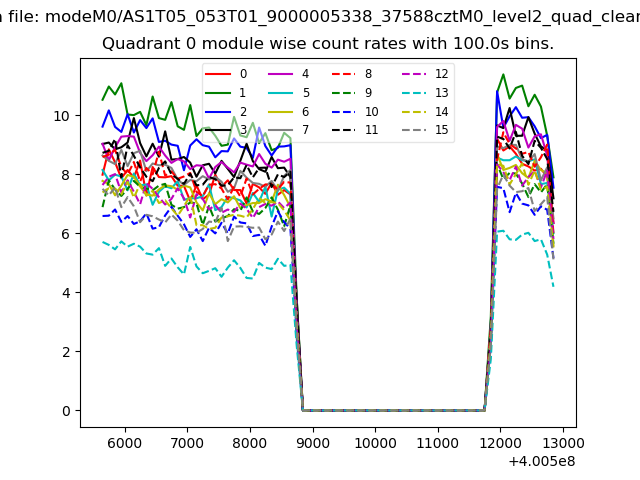 |
 |
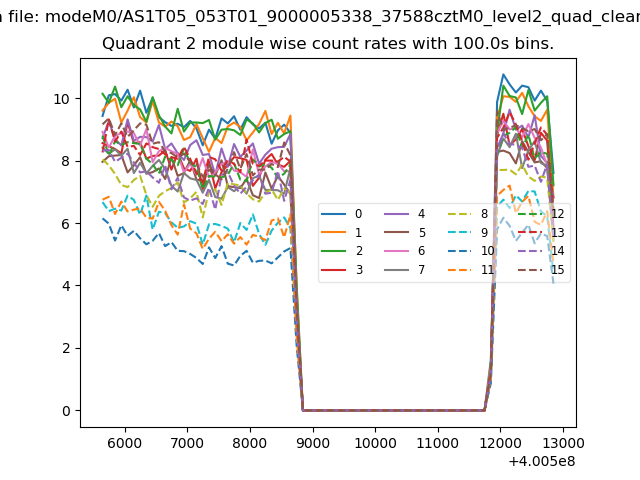
| Module-wise count rates for Quadrant B Data is divided into 100 sec bins |
 |
 |
| Module-wise count rates for Quadrant C Data is divided into 100 sec bins |
 |
 |
| Module-wise count rates for Quadrant D Data is divided into 100 sec bins |
 |
 |
| Parameter | Plot |
|---|---|
| CZT HV Monitor | 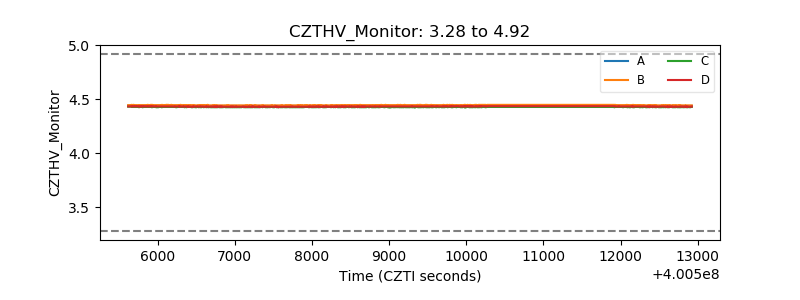 |
| D_VDD | 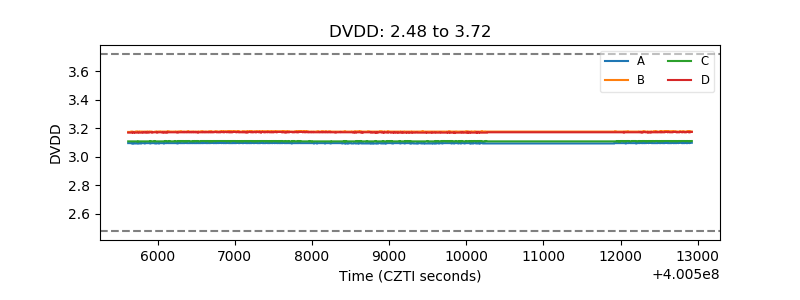 |
| Temperature 1 | 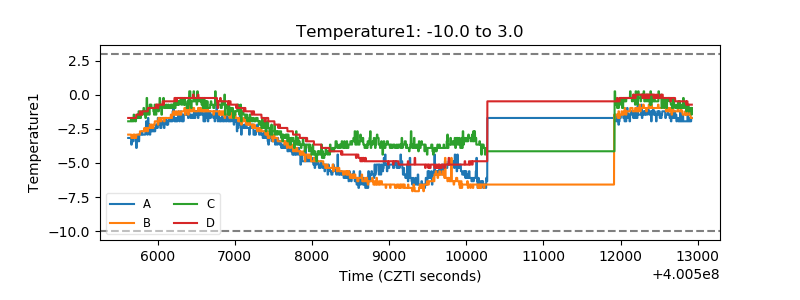 |
| Veto HV Monitor | 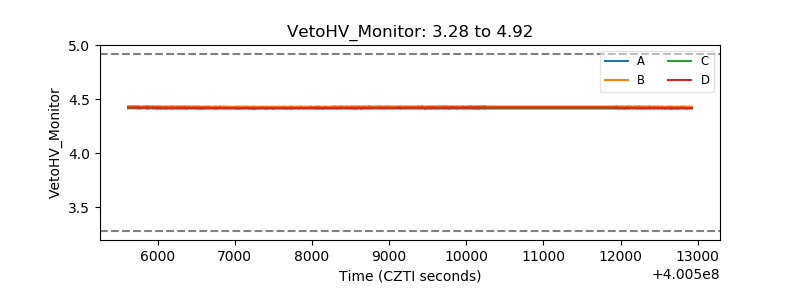 |
| Veto LLD | 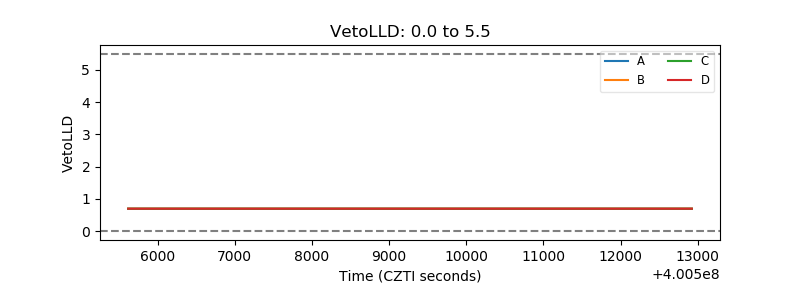 |
| Alpha Counter | 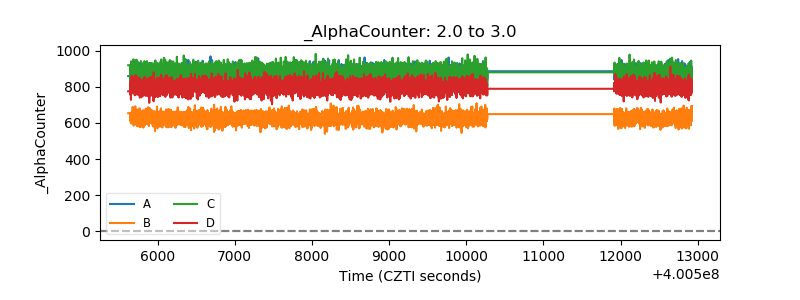 |
| _CPM_Rate | 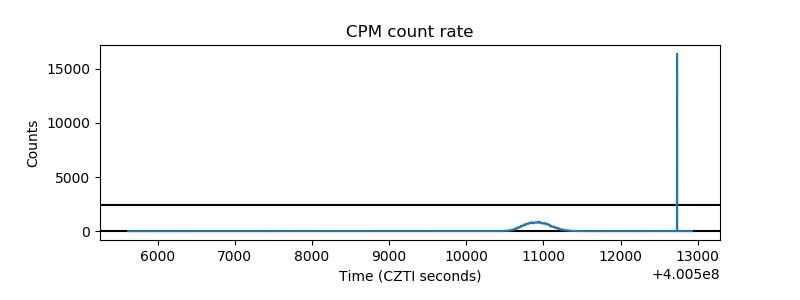 |
| CZT Counter | 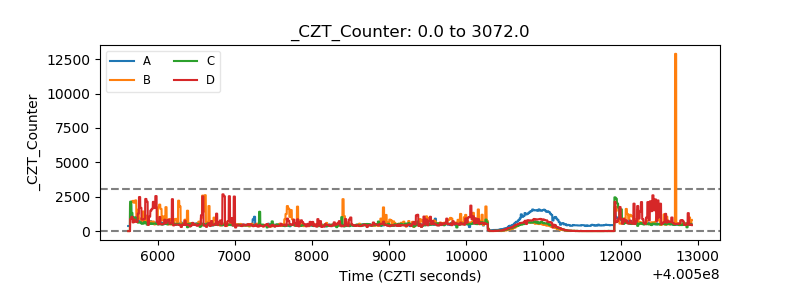 |
| +2.5 Volts monitor | 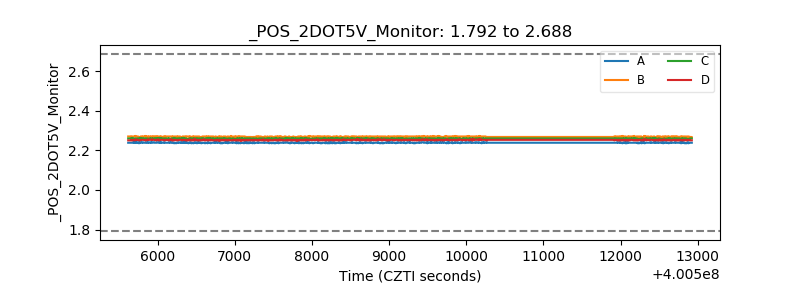 |
| +5 Volts monitor | 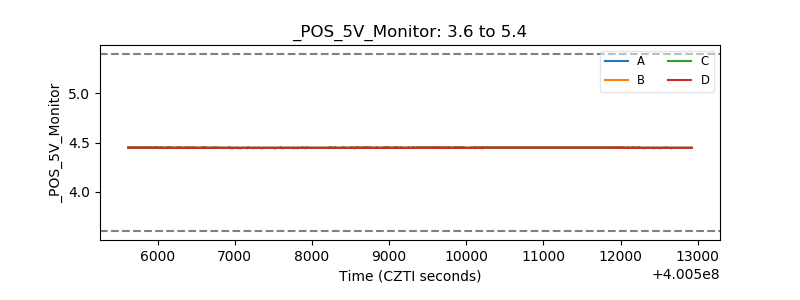 |
| _ROLL_ROT | 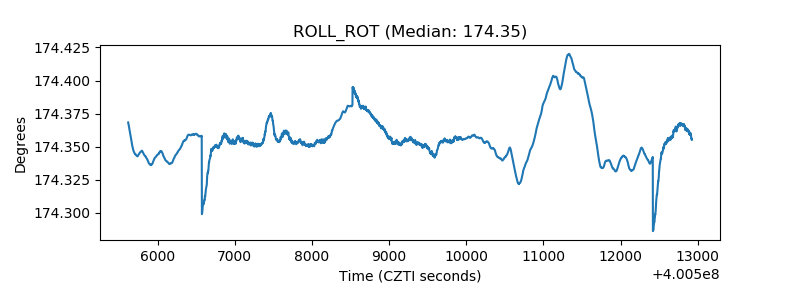 |
| _Roll_DEC | 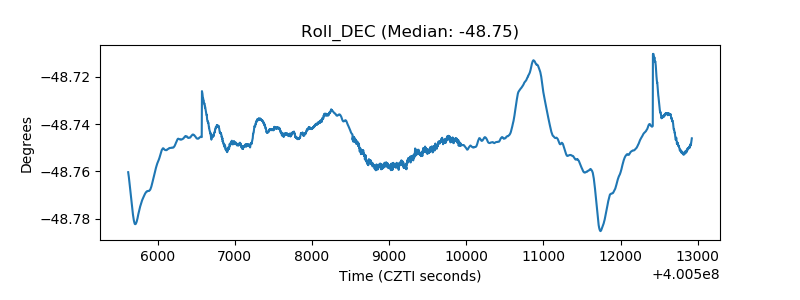 |
| _Roll_RA | 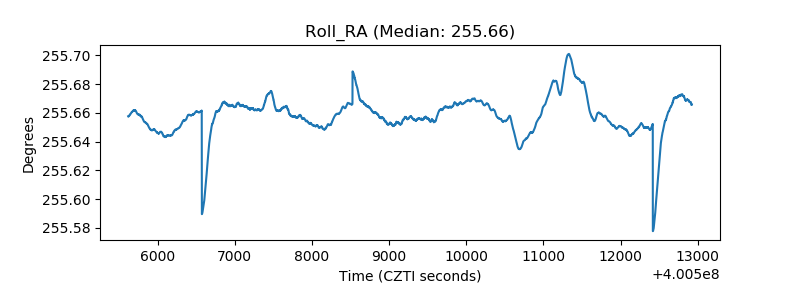 |
| Veto Counter | 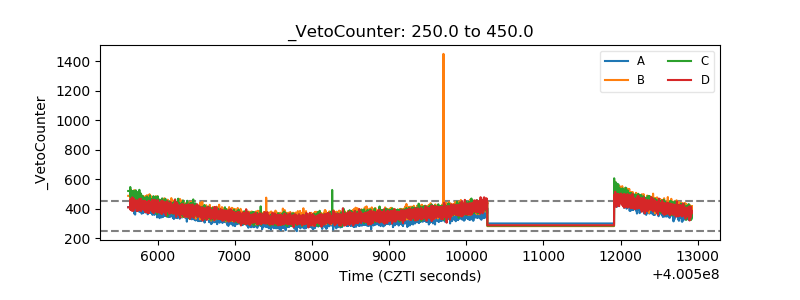 |